
Learning Circos
Bioinformatics and Genome Analysis
Fondazione Edmund Mach, San Michele all'Adige, Italy, 20 June 2019
v2.00 16 June 2019 Download PDF slides
v2.00 16 June 2019
A 1-day practical course in genomic data visualization with Circos. This material is part of the Bioinformatics and Genome Analysis course held at the Fondazione Edmund Mach in San Michele all'Adige, Italy. Materials also available here: course materials and PDF slides.
Quick links
MyPads | BCGA 2019 | 4-day Circos course | Circos documentation best practices getting started | Brewer palettes | Color resources | Nature Methods Points of View Points of Significance
Genomic Data Visualization with Circos
Thursday 20 June 2019 — Day 1
09h00 – 10h30 | Lecture 1 — Introduction to Circos
11h00 – 12h30 | Lecture (practical) 2 — Visualizing gene distribution and size in Yeast—the histogram data track
14h00 – 15h30 | Lecture (practical) 3 — Conservation in Yeast—the link data track
16h00 – 18h00 | Lecture (practical) 4 — Drawing the human genome
18h15 – 19h30 | Lecture (practical) 5 — Afterhours—Perl refresher
18h15 – 19h30 | Lecture (practical) 6 — Afterhours—Visualizing an Ebola strain
Concepts covered today
Circos configuration, common Circos errors, Circos debugging, ideograms, selecting ideograms with regular expressions, input data format, creating Circos data files, data tracks (histograms, heat map, tiles, links), color definitions and using transparency, Brewer palettes, dynamic data formatting rules, downloading files from UCSC genome browser, essential command-line tools and basic scripting,
Drawing the human genome
You're now ready to work on a small project on your own. In this lecture, you'll draw human genes and segmental duplications.
Download human gene data set (optional)
Download the NCBI RefSeq gene set from the UCSC genome browser table viewer.
 clade:    Mammal
 genome:   Human
 assembly: Dec 2013 (hg38)
 group:    Genes and Gene Predictions
 track:    NCBI RefSeq
 table:    RefSeq Curated
To learn about the format of this file, click on "Describe table schema".
I encourage you to download the file yourself but if the network connection is slow, or if you would like to save time, you can find it in lecture.4/data/genes.human.refseq.txt.
Create Circos data files
Edit scripts/create.human.gene.tracks and change the CIRCOS variable to the location of where Circos is installed.
Take some time to explore this script and makes sure that you understand (a) what it is doing and (b) how it is doing it. Note the file naming conventions here (and elsewhere in the materials): lowercase only, no spaces, no dashes, periods as separators for words. I encourage you to adopt this convention (it's very UNIXy). You can use an underscore instead of a period, though I find the period cleaner because it uses fewer screen pixels.
The first thing that the script does is create a subset of human genes in genes.43000.txt, which do not match ANY of these patterns
 random
 _alt
 none
 chrUn
Next, genes.19300.txt is created of genes with unique values of the name2 field.
The number of genes for each 3-letter gene name prefix is counted in prefixes.count.txt and a list of genes with unique 3-letter prefixes is created in genes.3500.txt.
The distribution of gene sizes histogram.gene.size.txt is calculated using histogram. What is the average gene size? What about the 50% percentile?
The number of genes on each chromosome is calculated in count.bychr.txt
A Circos data file track.genes.txt is created from the list of 19,300 genes. This file has the format that should already be familiar to you.
CHR START END NUM_EXONS name=GENENAME
and includes the gene name for each data point.
Finally, the resample Circos tool is used to generate a count of genes in 1, 5 and 10 Mb windows.
Once you've gone through this script, run it from the lecture.4/data directory.
> ../../../scripts/create.human.gene.tracks
Creating list of 43,000 genes
Creating list of 19,300 genes (unique names)
Counting genes for each 3-letter prefix
Creating list of 3,500 genes (unique 3-letter prefix)
Creating histogram of gene sizes (in kb)
Counting genes on each chromosome
Creating Circos data file of gene positions
Creating Circos data file of gene counts in 1 Mb windows
Creating Circos data file of gene counts in 5 Mb windows
Creating Circos data file of gene counts in 10 Mb windows
Creating Circos data file of gene counts in 20 Mb windows
The human karyotype is included in the Circos distribution, along with karyotypes for common organisms like mouse and rat.
Human chromosomes have the hs (Homo sapiens) prefix: hs1, hs2...
karyotype = data/karyotype/karyotype.human.txt

<plots>

<plot>

type = histogram
file = ../data/track.gene.count.5mb.txt
r1   = 0.98r
r0   = 0.90r
fill_color       = dgrey
stroke_thickness = 0

<rules>
use        = no
<rule>
condition  = var(value) < var(plot_avg)
fill_color = red
flow       = continue
</rule>
<rule>
use        = no
condition  = var(value) > var(plot_avg) + var(plot_sd)
fill_color = blue
flow       = continue
</rule>
Read the (https://en.wikipedia.org/wiki/Data_transformation_(statistics))[Wikipedia entry about data transformations] or a (http://fmwww.bc.edu/repec/bocode/t/transint.html)[friendly introduction to data transformations] to learn why sqrt() here is appropriate.
<rule>
use        = no
condition  = 1
value      = eval(sqrt(var(value)))
</rule>

</rules>

</plot>
Remove the stroke around the heat map bins. Which version do you like better?
<plot>
type  = heatmap
file  = ../data/track.gene.count.5mb.txt
r1    = 0.89r
r0    = 0.85r
color = spectral-9-div
stroke_thickness = 1
stroke_color     = white
</plot>
See Tile track Circos tutorial for details about how tile tracks work.
<plot>
type      = tile
file      = ../data/track.genes.txt
minsize   = 5u
r1        = 0.84r
r0        = 0.70r
margin    = 2u
thickness = 3p
padding   = 2p
stroke_thickness = 0
Find the three most common 3-letter prefixes in lecture.4/data/prefixes.count.txt and change these rules to show the genes that match these prefixes.
What is the average gene size in the human genome? Hint: lecture.4/data/histogram.gene.size.txt.
Write a rule that hides all genes smaller than the average.
<rules>

use = no

<rule>
condition = var(name) =~ /^LOC/
color     = red
</rule>
<rule>
condition = var(name) =~ /^KCN/
color     = black
</rule>
<rule>
condition = var(name) =~ /^TRI/
color     = grey
</rule>
<rule>
condition = 1
show      = no
</rule>
</rules>
</plot>

</plots>
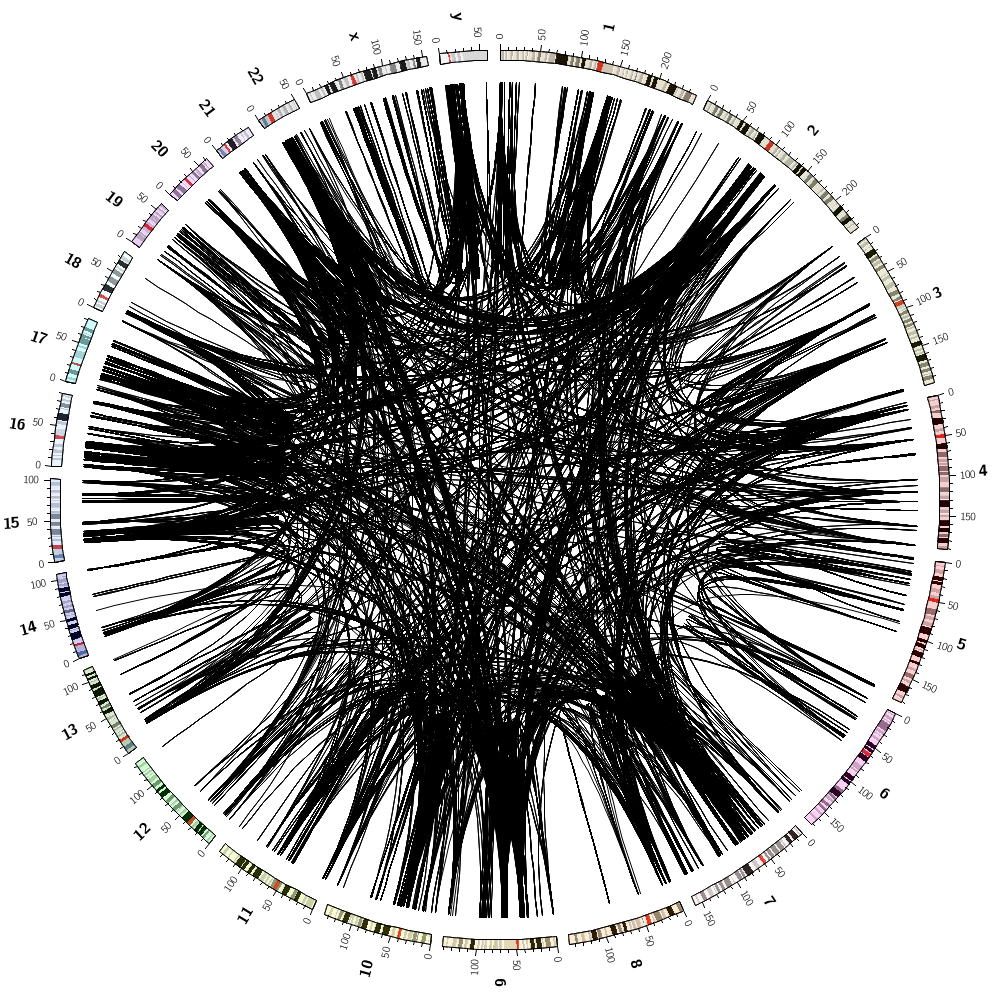
Let's now add segmental duplications as links to the plot. These are regions within the human genome that are larger than 1 kb and have more than 90% similarity.
Download segmental duplications
You can get the human segmental duplication set from the UCSC genome browser table viewer.
 clade:    Mammal
 genome:   Human
 assembly: Dec 2013 (hg38)
 group:    Repeats
 track:    Segmental Dups
 table:    genomicSuperDups
To learn about the format of this file, click on "Describe table schema".
There are about 70,000 these duplications, which are all at least 1 kb.
I encourage you to download the file yourself but if the network connection is slow, or if you want to save time, you can find it in day.2/data/segdup.human.txt.
Create Circos data files
Edit scripts/create.human.segdup.tracks and change the CIRCOS variable to the location of where Circos is installed.
Explore the script and make sure that you understand it.
It first parses the segmental duplication list into a Circos link file track.segdup.all.txt.
A histogram of segmental duplication sizes is generated in histogram.segdup.size.txt. What is the average size?
Finally, track.segdup.all.txt is parsed and modified to include a chromoeome size rank for each segmental duplication.
hs1  146541435  146905930  hs16  70811383  71168670 sizerank=1
hs1  148600078  148935345  hs1  119989247  120323081 sizerank=2
hs1  119989247  120323081  hs1  148600078  148935345 sizerank=3
...
hs2  110276210  110634615  hs2  109736854  110095177 sizerank=1
hs2  109736854  110095177  hs2  110276210  110634615 sizerank=2
hs2  94571013  94860516  hs9  65858856  66156287 sizerank=3
...
The final output file should be sorted by link size (not the rank) and should look something like this
hsY  5464146  6234575  hsX  92352303  93120510  sizerank=1
hsX  92352303  93120510  hsY  5464146  6234575  sizerank=1
hsY  25545548  26311622  hsY  23358995  24124586  sizerank=2
hsY  23358995  24124586  hsY  25545548  26311622  sizerank=3
hsY  24894109  25541603  hsY  24128531  24775999  sizerank=4
hsY  24128531  24775999  hsY  24894109  25541603  sizerank=5
hsX  90276317  90909509  hsY  3853083  4483712  sizerank=2
...
Once you've gone through this script, run it from the lecture.4/data directory.
> ../../../scripts/create.human.segdup.tracks
Creating Circos segmental duplication links
Creating histogram of segmental duplication size (in kb)
Creating Circos segmental duplication links with size rank for each chromosome
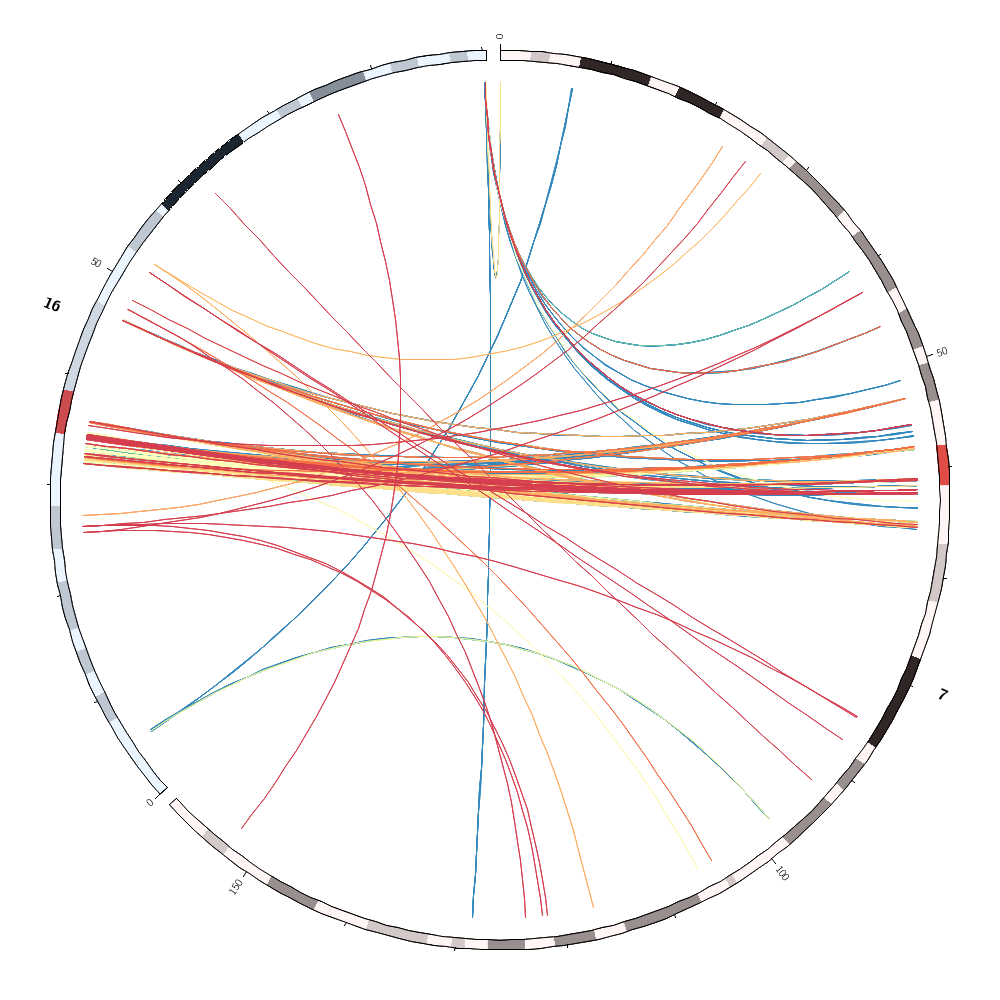
chromosomes_display_default = no chromosomes = hs1;hs2 # change this to the pair that has the most segmental duplications
karyotype = data/karyotype/karyotype.human.txt
This parameter is normally set to 25,000 in etc/housekeeping but here we will override it since we might be drawing more than 25,000 links. Keep in mind that drawing that many links can create an uninterpretable image and take a long time to draw.
max_links* = 100000

<links>
<link>
Limit the number of links that are drawn to speed up image creation. Once you're happy with your configuration, comment this out.
record_limit = 10000
Make sure that you understand the role of the sizerank parameter associated with each link.
file   = ../data/track.segdup.indexed.txt
bezier_radius = 0r
radius = 0.95r
Activate the rules
<rules>
use       = no

<rule>
condition = var(chr1) eq var(chr2)
show = no
</rule>

<rule>
condition = var(sizerank) > 500
show      = no
</rule>

<rule>
condition = var(sizerank) > 100
color     = black_a15
</rule>
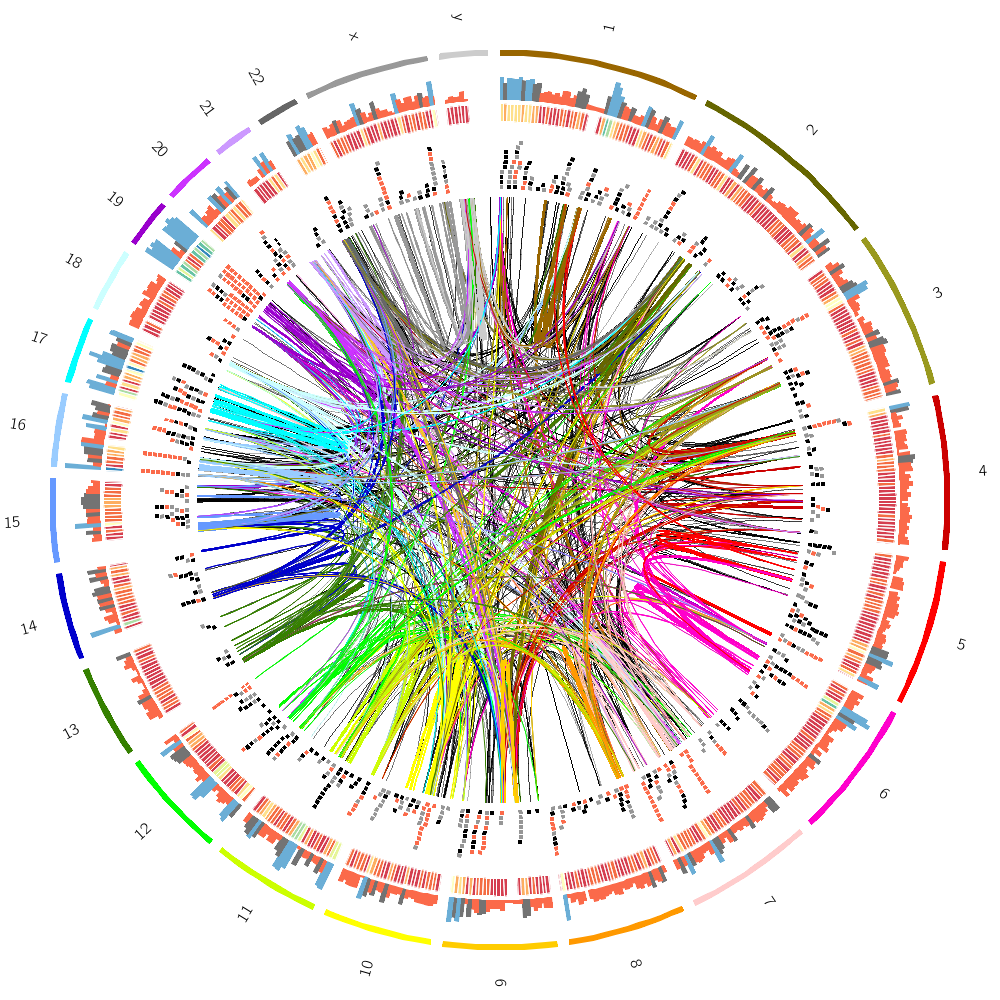
Each chromosome has an associated color with the same name as the chromosome. What is the lc doing here?
<rule>
condition = 1
color     = eval(lc var(chr1))
color = eval(sprintf("spectral-9-div-%d",remap_int(var(size1),1000,5000,1,9)))
z         = eval(var(sizerank))
flow      = continue
</rule>

<rule>
condition = var(sizerank) < 10
thickness = 3
</rule>

</rules>
Which pairs of different chromosomes have the largest number of segmental duplications? Change the configuration file to draw only these two chromosomes without any record_limit. Turn off the rule that hides and colors the links by sizerank. Change the color mapping of the links to the spectral-9-div palette and make links flat ribbons. Remove intrachromosomal links.
</link>
</links>
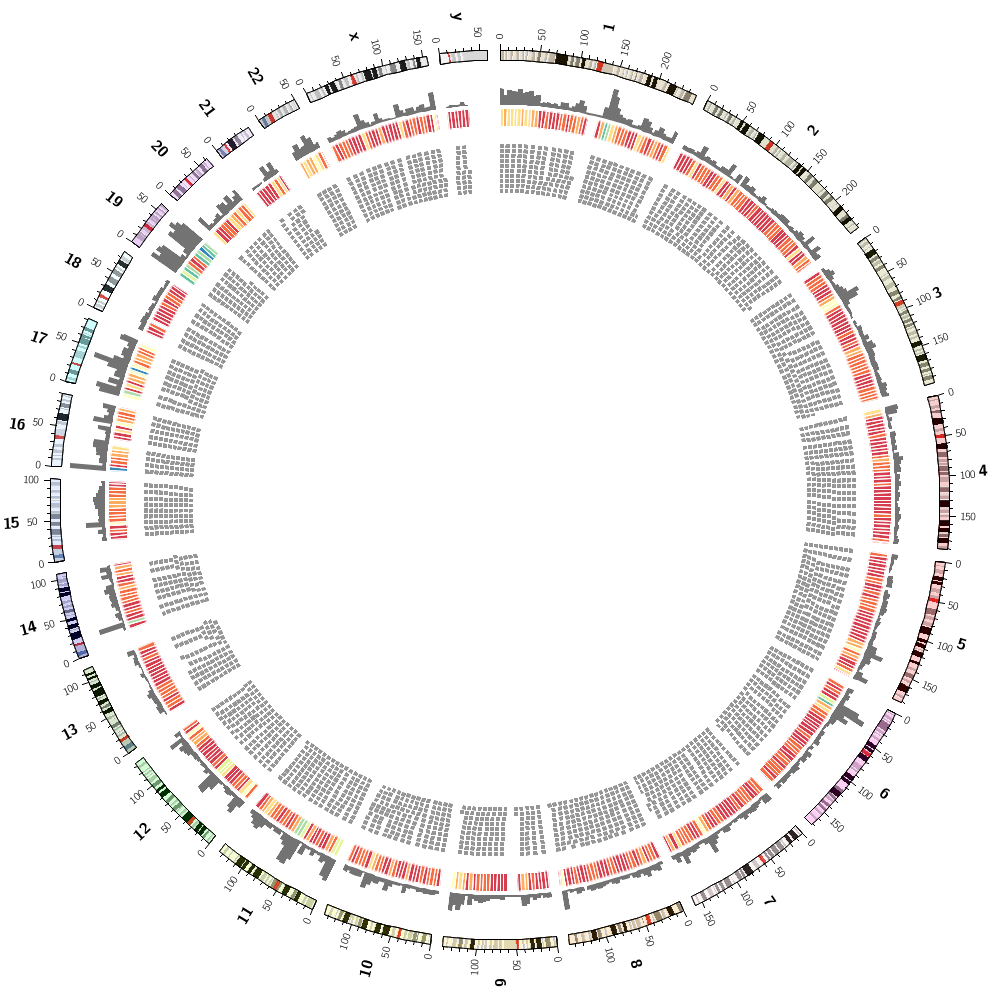
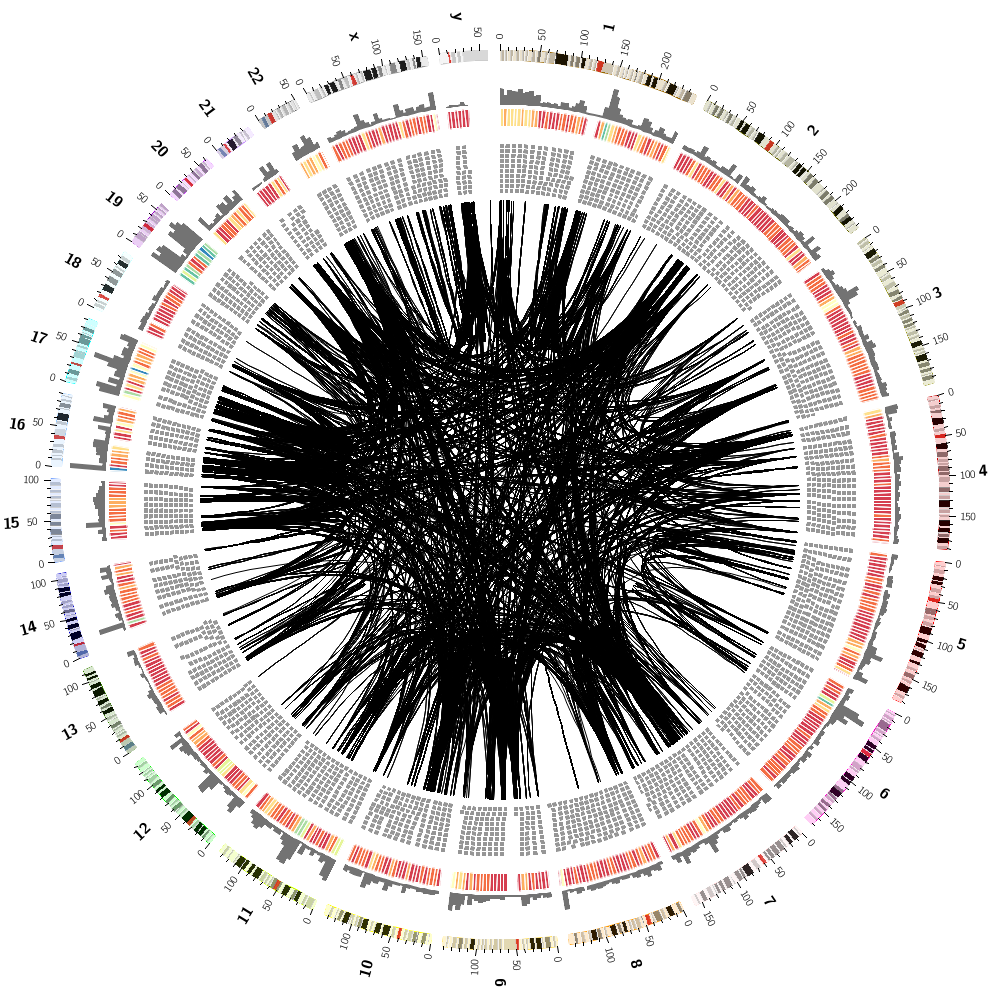
We can now combine the gene histogram, heatmap and tiles with the segmental duplication links.
karyotype = data/karyotype/karyotype.human.txt
Keep your Circos files as modular as possible. Here, we're including the content from the etc/plots.conf file from the first section.
<<include ../1/etc/plots.conf>>
And now include the links configuration from the second section.
<<include ../2/etc/links.conf>>
This configuration includes ideogram.conf from lecture.4/etc. Go to that directory and make a copy of ideogram.conf for editing. Turn off the bands and make the ideograms thinner (e.g. thickness = 5p) and have stroke_thickness = 0. Change the label_font to default. Turn off the ticks by commenting out the ../etc/ticks.conf include below.
<<include ../etc/ideogram.conf>>
<<include ../etc/ticks.conf>>
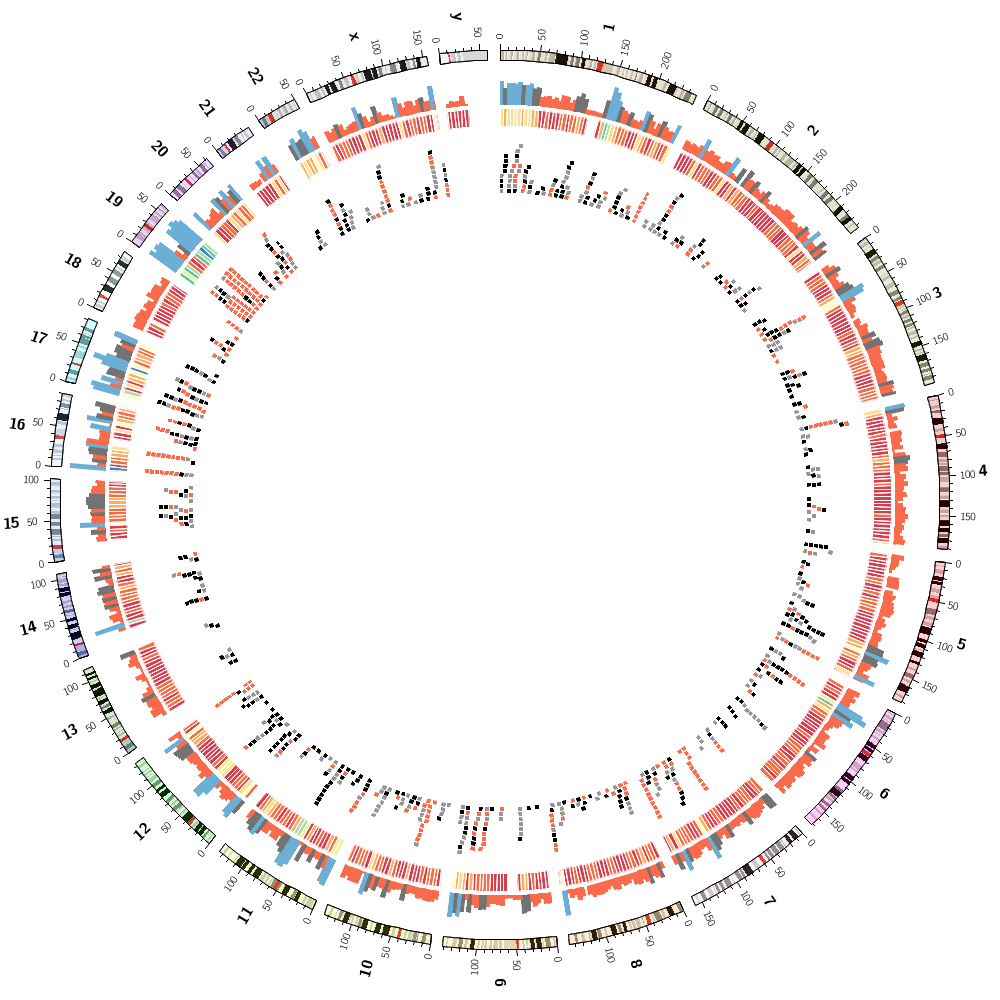
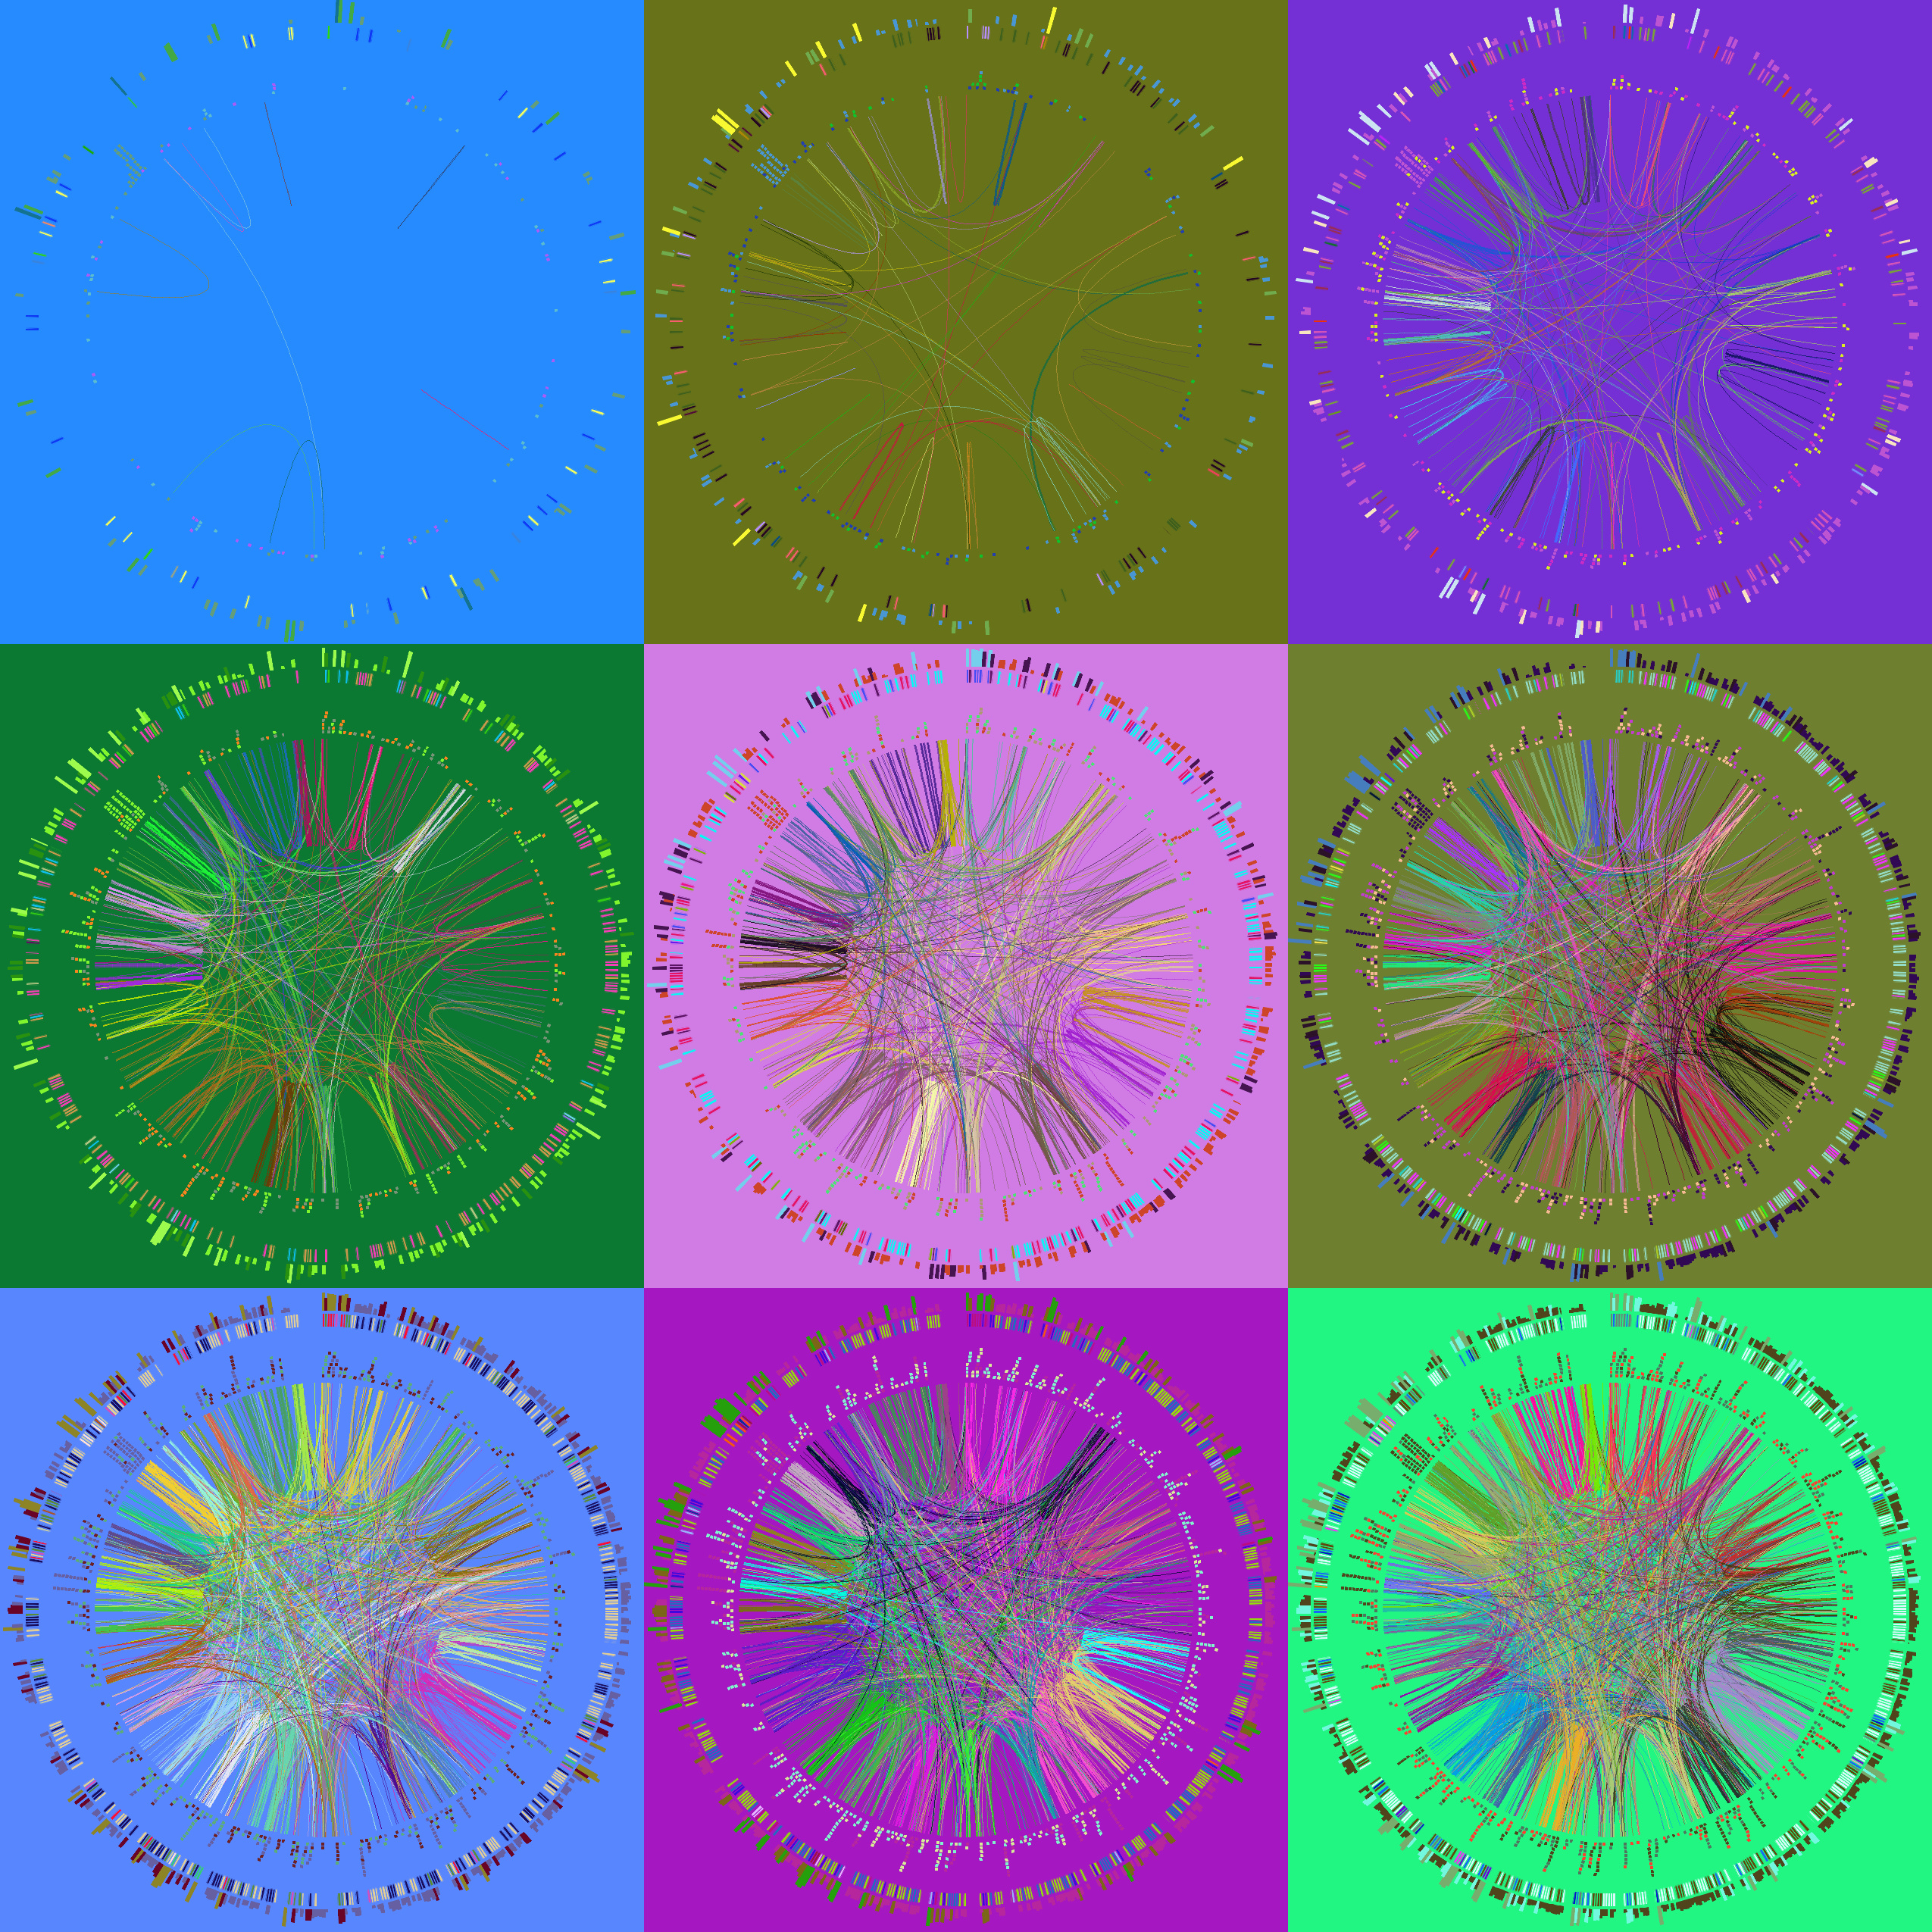
To finish off, let's make some random images based on this complex image that includes human genes and segmental duplications.
I've copied the configuration from the previous section but added a special rule to each block.
<rules>
<<include rule.hide.conf>>
...
</rules>
where the rule.hide.conf file is
<rule>
condition = rand() < conf(hidefraction)
show = no
</rule>
I have set hidefraction = 0.5 in circos.conf. Effectively, every data point has a 50% chance of being hidden.
You'll notice that for the links the rule is executed three times
<rules>
<<include rule.hide.conf>>
<<include rule.hide.conf>>
<<include rule.hide.conf>>
...
</rules>
This has the effect of increasing the possibilit of data being hidden to 1-0.5^3.
Let's make the image with this rule, but turn off the ideograms.
>circos -param ideogram/show=no -outputfile circos.1.png
Using the -param flag lets you dynamically overwrite any parameter values in the configuration. In the call above, the show parameter in the <ideogram> block is set to show=no, which basically turns of the display of ideograms.
The -outputfile sets the output filename.
You can change the fraction to hide on the command line using -param
>circos -param ideogram/show=no -param hidefraction=0.9 -outputfile circos.1.png
Finally, we're going to randomize all the colors (keeping black and white as they are).
>circos -param ideogram/show=no -param hidefraction=0.75 -outputfile circos.1.png -randomcolor white,black
Everyone's image will be different.
Let's make a set of 9 images, each with a different hiding fraction. Again, each one will be different because the colors are randomized as is the data hiding. I've set up a small batch file make.random that runs these four jobs in the background, which is achieved by the trailing &.
We will finally use Image Magick's utilities convert and montage to create a tiling of our images. See the make.tiles script for this.
As a challenge, try to replace one of your images with a photo of yourself, or any other image!
#!/bin/bash

# Randomize all colors except white and black. Try removing white,black and see what happens! Crazy, eh?

OPT="-param ideogram/show=no -randomcolor white,black"

# Alternatively, remap the colors to the hilarious and wonderfully useless
# watermelon-mint color palette (red-white-green), as requested in
# good fun by students from the EMBO course in Izmir. It's
# particularly fitting here because it matches the colors on the
# Italian flag.
#
# OPT="-param ideogram/show=no -wmmn"

for i in `seq 1 9` ; do
f=`echo "scale=1;(10-$i)/10" | bc`
echo "Drawing for hidden fraction $f to circos.$i.png"
(circos $OPT -outputfile circos.$i.png -param hidefraction=$f > out.$i; echo "Done tile $i fraction $f") &
done

echo "Please wait 30-60 seconds until all processes report finished..."
echo "Running..."
#!/bin/bash

for i in `seq 1 9`; do
convert circos.$i.png -gravity Center -crop 850x850+0+0 circos.$i.crop.png
done

montage -mode Concatenate -geometry 850x850 circos.*.crop.png circos.tiles.png