Learning Circos
Bioinformatics and Genome Analysis
Institut Pasteur Tunis Tunisia, December 10 – December 11, 2018
v2.00 6 Dec 2018 Download PDF slides
v2.00 6 Dec 2018
A 2- or 4-day practical mini-course in Circos, command-line parsing and scripting. This material is part of the Bioinformatics and Genome Analysis course held at the Institut Pasteur Tunis.
Quick links
BCGA 2018 | 1-day Circos course | Circos documentation best practices getting started | Brewer palette swatches | Color resources | Nature Methods Points of View Points of Significance
Circos case studies
Tuesday 11 December 2018 — Day 2
9h00 - 10h30 | Lecture 1 — Drawing the human genome
11h00 - 12h30 | Lecture (practical) 2 — Downloading and drawing human genes
14h00 - 15h30 | Lecture (practical) 3 — Downloading and drawing segmental duplications
16h00 - 18h00 | Lecture (practical) 4 — Creating an image montage
Concepts covered
drawing the human genome, karyotypes included in Circos distribution, generating random data with randomdata, heatmaps, color lists, interpolating colors with colorinterpolate, drawing human genes, drawing segmental duplications as links, creating image montages
Downloading and drawing segmental duplications
In this lecture, you'll draw human segmental duplications as links. You'll find answers to this challenge in Lecture 4.
Download segmental duplications
You can get the human segmental duplication set from the UCSC genome browser table viewer.
 clade:    Mammal
 genome:   Human
 assembly: Dec 2013 (hg38)
 group:    Repeats
 track:    Segmental Dups
 table:    genomicSuperDups
To learn about the format of this file, click on "Describe table schema".
There are about 70,000 these duplications, which are all at least 1 kb.
I encourage you to download the file yourself but if the network connection is slow, you can find it in day.2/data/segdup.human.txt.
Create a link file
Parse the file to generate a link file based on the coordinates of the two duplicated regions in each line.
Generate a histogram of the sizes of the segmental duplications. You can use the size on the first chromosome. What is the average size?
Create a bash script to list the largest N segmental duplications on each chromosome. For this you want to use a bash for loop.
https://unix.stackexchange.com/questions/209249/piping-commands-after-a-piped-xargs
Now use this script to modify your link file to add an sizerank=IDX column to the link file where IDX is the size rank of the duplication on its chromosome.
hs1  146541435  146905930  hs16  70811383  71168670 sizerank=1
hs1  148600078  148935345  hs1  119989247  120323081 sizerank=2
hs1  119989247  120323081  hs1  148600078  148935345 sizerank=3
...
hs2  110276210  110634615  hs2  109736854  110095177 sizerank=1
hs2  109736854  110095177  hs2  110276210  110634615 sizerank=2
hs2  94571013  94860516  hs9  65858856  66156287 sizerank=3
...
The final output file should be sorted by link size (not the rank) and should look something like this
hsY  5464146  6234575  hsX  92352303  93120510  sizerank=1
hsX  92352303  93120510  hsY  5464146  6234575  sizerank=1
hsY  25545548  26311622  hsY  23358995  24124586  sizerank=2
hsY  23358995  24124586  hsY  25545548  26311622  sizerank=3
hsY  24894109  25541603  hsY  24128531  24775999  sizerank=4
hsY  24128531  24775999  hsY  24894109  25541603  sizerank=5
hsX  90276317  90909509  hsY  3853083  4483712  sizerank=2
...
Draw the segmental duplications
Create a <link> track in the template etc/ Circos configuration file to draw the segmental duplications.
First, start by drawing the largest 100 links on each chromosome. Since you've stored their rank in sizerank you can test in a rule
<rule>
condition = var(sizerank) > 100
show      = no
</rule>
##3 Color segmental duplications by chromosome
Add a rule that colors the links by their chromosome. What happens here if you use chr2?
<rule>
condition = 1
color = eval(lc var(chr1))
</rule>
To this same rule and a line that set's the link's z parameter to the same as its rank. This parameter controls the order in which the links are drawn, in order of decreasing z. Thus, links with sizerank=1 are drawn last.
z = eval(var(sizerank))
Add a rule that draws links with sizerank<10 with thickness=2.
<rule>
condition = var(sizerank) < 10
thickness = 3
</rule>
Map size onto color
Apply a color map to map size1 of the duplication onto the spectral-9 Brewer palette. For this what you want to do is remap the var(size1) of a link from the range, for example, [1000,20000] to the colors spectral-9-div-1 to spectral-9-div-9.
color = eval(sprintf("spectral-9-div-%d",remap_int(var(size1),1000,20000,1,9)))
Try other color palettes like piyg and reds. Remember that piyg is a diverging Brewer palette so its name has -div whereas reds is sequential so it has -seq.
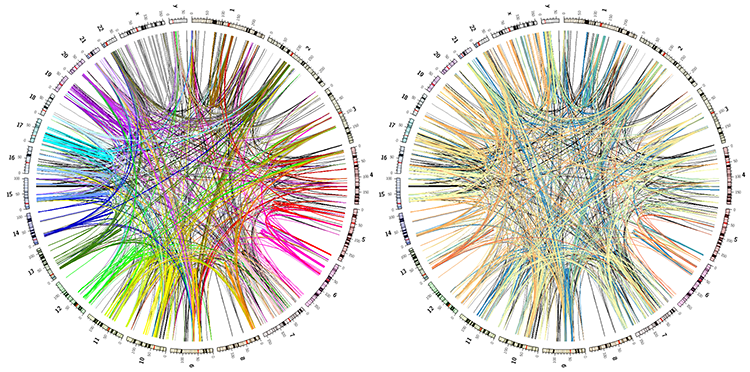
You'll be working towards images like the ones below.
karyotype = data/karyotype/karyotype.human.txt
This parameter is normally set to 25,000 in etc/housekeeping but here we will override it since we might be drawing more than 25,000 links. Keep in mind that drawing that many links can create an uninterpretable image and take a long time to draw.
max_links* = 100000

#<links>
#<link>
For debugging, you can set record_limit to read in a small number of entries from the track data file.
#record_limit = 5000
#</link>
#</links>
