Learning Circos
Bioinformatics and Genome Analysis
Institut Pasteur Tunis Tunisia, December 10 – December 11, 2018
v2.00 6 Dec 2018 Download PDF slides
v2.00 6 Dec 2018
A 2- or 4-day practical mini-course in Circos, command-line parsing and scripting. This material is part of the Bioinformatics and Genome Analysis course held at the Institut Pasteur Tunis.
Quick links
BCGA 2018 | 1-day Circos course | Circos documentation best practices getting started | Brewer palette swatches | Color resources | Nature Methods Points of View Points of Significance
Getting started with Circos: Yeast and Ebola
Monday 10 December 2018 — Day 1
9h00 - 10h30 | Lecture 1 — Introduction to Circos
11h00 - 12h30 | Lecture (practical) 2 — Visualizing gene distribution and size in Yeast: the histogram data track
14h00 - 15h30 | Lecture (practical) 3 — Conservation in Yeast: the link data track
16h00 - 18h00 | Lecture (practical) 4 — Visualizing an Ebola strain
Concepts covered today
Circos configuration, common Circos errors, Circos debugging, ideograms, selecting ideograms with regular expressions, data tracks, histograms, links, downloading files from UCSC genome browser, essential command-line tools and basic scripting, using bash to create data files for Ebola genome strains, color definitions, using transparency, Brewer palettes, runtime formatting rules, accessing data track statistics, input data formats
Your first day. Stay relaxed.
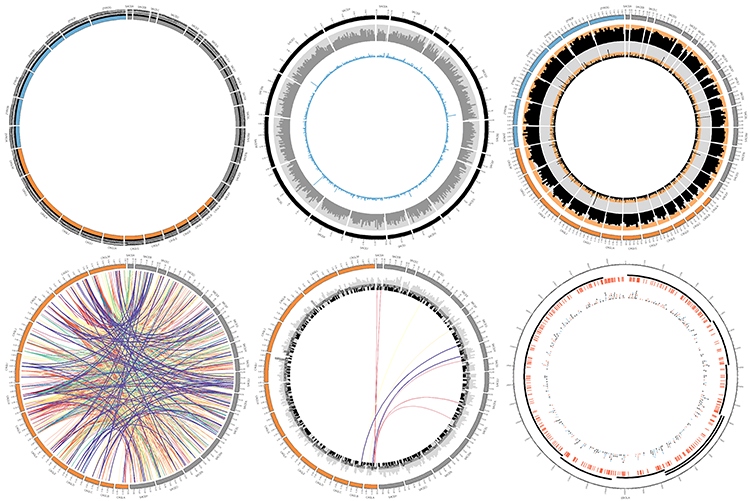
Follow along with the course files — shown in the tag right above this text. Below are the kinds of images you'll be creating today.
Let's start with Lecture 1.