data format requirements
The files you upload must be plain-text tabular data. The file can be space- or tab-delimited. Adjacent spaces will be collapsed, so don't use them to indicate missing fields (instead, use a hyphen — see below).
# use a space to separate fields
labels A B C
A 10 15 20
D 15 20 25
E 20 30 50

# use a tab to separate fields
labels	A	B	C
A	10	15	20
D	15	20	25
E	20	30	50
Row names are expected to be in the first column and column names in the first row. No two rows may have the same name. No two columns may have the same name.
Each line must have the same number of fields. This limitation requires that any leading cells in the header row are populated.
# leading header cells (here "labels") must be populated (i.e. this field must exist)
labels	A	B	C
A	10	15	20
D	15	20	25
E	20	30	50
Your table values are required to be non-negative integers. If your data value are floating values in the range [0,1], multiply each table cell by a large value, like 1000. The viewer will truncate any decimal components. Make sure that you have no thousands-separators in your output (1525, not 1,525) and no quotes around numbers (1525, not "1525").
Any lines with leading # are treated as comments and not parsed. Blank lines are also ignored.
Only the first 75 rows and 75 columns of your data will be parsed. If you would like to generate more complex images, download Circos and use the tableviewer tool.
encoding missing data
To encode missing fields (e.g. table cell for which no data is present, use a hyphen "-").
# missing data is encoded by -
labels	A	B	C
A	10	-	50
D	15	25	5
E	-	-	30
sample images
The sample images were generated using the default image settings.
sample 1
A simple table. All columns and rows have unique names.
# Small tab-delimited table with different row and column labels

| data | A | B | C | D |
| E | 105 | 450 | 92 | 96 |
| F | 20 | 46 | 78 | 33 |
| G | 118 | 553 | 94 | 317 |
| H | 100 | 18 | 108 | 104 |
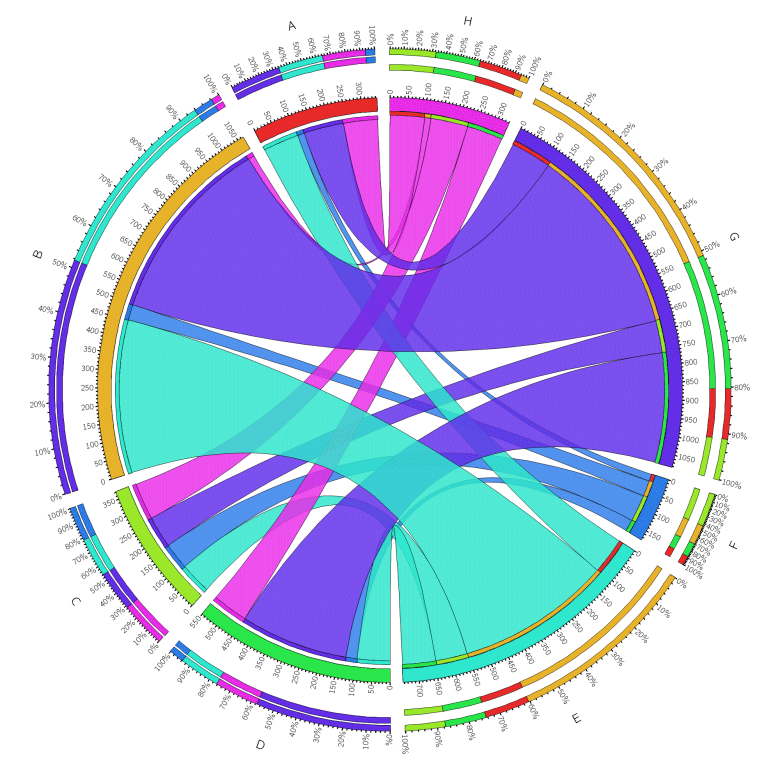
sample 2
A table file with the same data as in the previous sample, but now some rows and columns have the same name. Columns and rows with the same name are joined on the same segment.
| data | A | B | C | D |
| A | 105 | 450 | 92 | 96 |
| B | 20 | 46 | 78 | 33 |
| G | 118 | 553 | 94 | 317 |
| H | 100 | 18 | 108 | 104 |
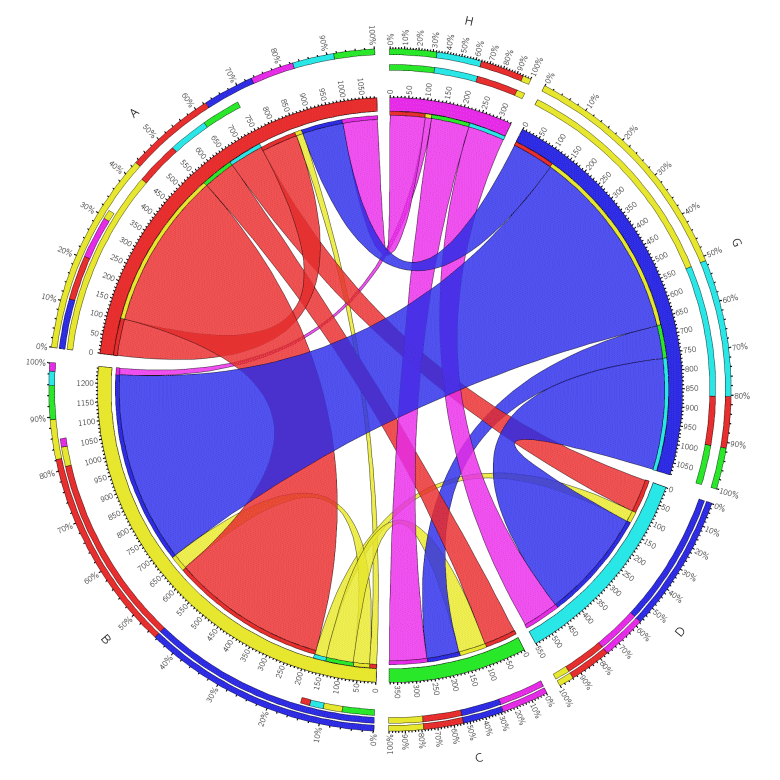
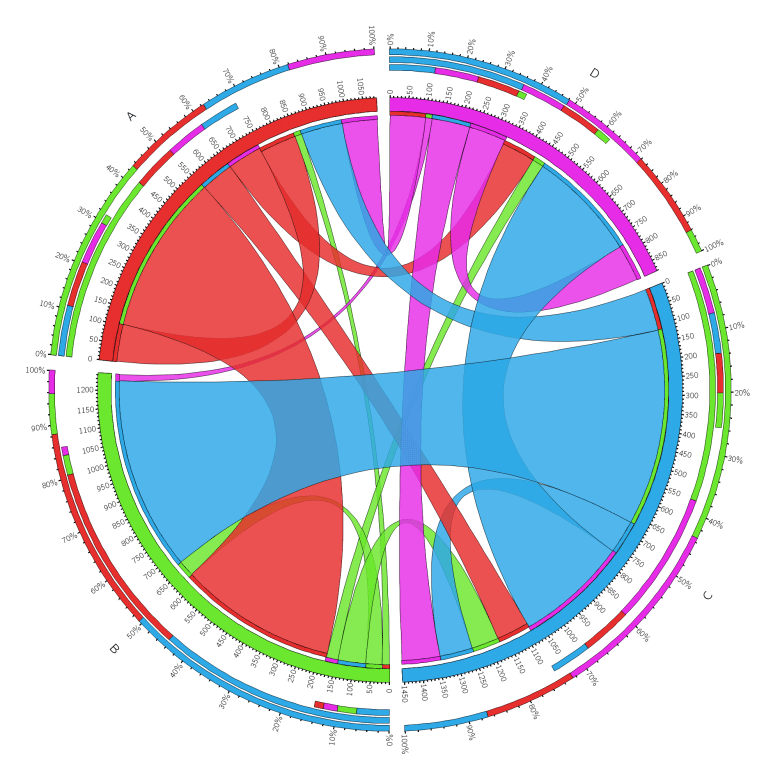
sample 3
A table file with the same data as in the previous sample, but now each row has a corresponding column of the same name. Because there are only 4 unique labels (A,B,C,D), the image has four segments.
| data | A | B | C | D |
| A | 105 | 450 | 92 | 96 |
| B | 20 | 46 | 78 | 33 |
| C | 118 | 553 | 94 | 317 |
| D | 100 | 18 | 108 | 104 |
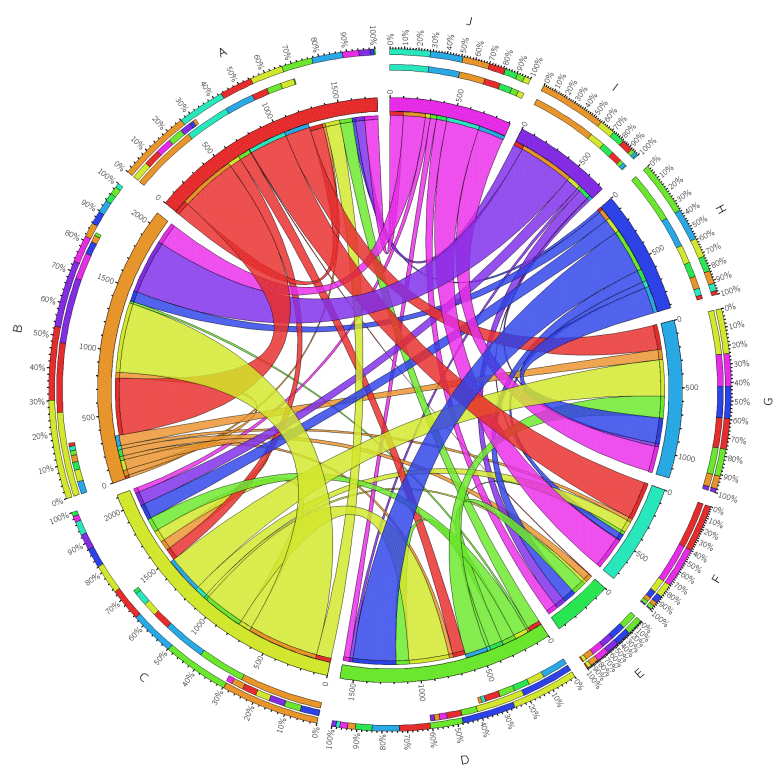
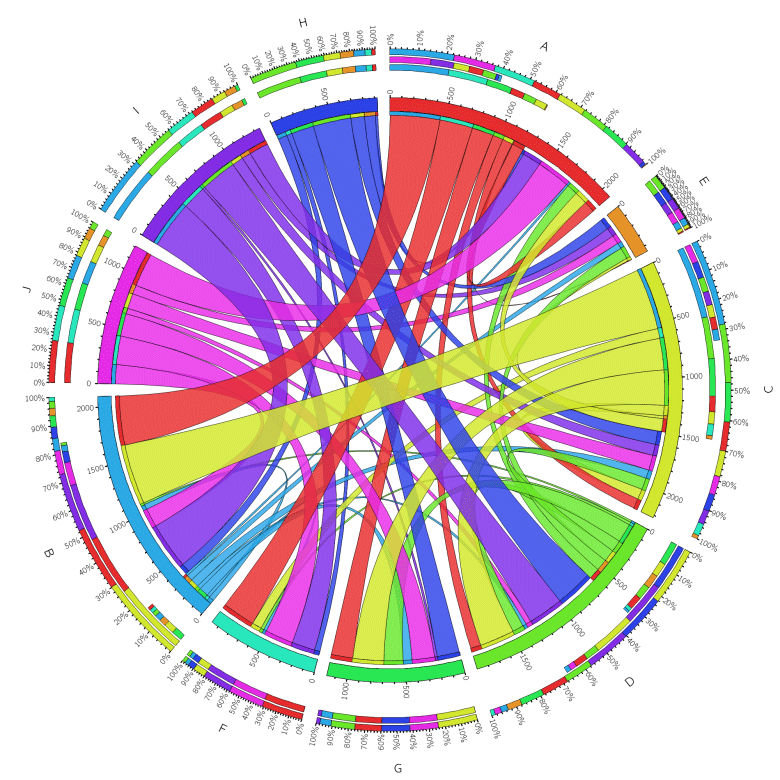
sample 4
A large table with a variety of row and column labels, some shared.
| data | A | B | C | D | E | F | G |
| A | 105 | 450 | 92 | 96 | 5 | 301 | 195 |
| B | 20 | 46 | 78 | 33 | 53 | 28 | 83 |
| C | 118 | 553 | 94 | 317 | 25 | 89 | 287 |
| D | 100 | 18 | 108 | 104 | 105 | 25 | 173 |
| H | 23 | 83 | 123 | 342 | 98 | 48 | 205 |
| I | 73 | 428 | 103 | 25 | 82 | 5 | 23 |
| J | 105 | 173 | 38 | 49 | 81 | 258 | 207 |
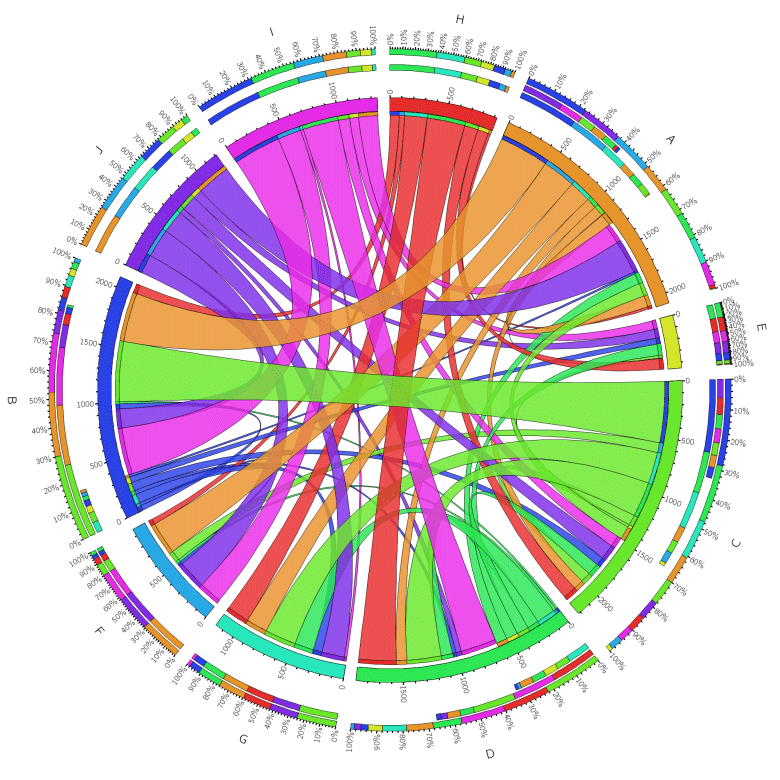
sample 5
Same table as in the sample above, but now the data file includes a row that specifies the order in which the column segments in the figure are arranged.
To parse this file correctly, you must check row with col order.
| data | 1 | 7 | 3 | 4 | 2 | 6 | 5 |
| data | A | B | C | D | E | F | G |
| A | 105 | 450 | 92 | 96 | 5 | 301 | 195 |
| B | 20 | 46 | 78 | 33 | 53 | 28 | 83 |
| C | 118 | 553 | 94 | 317 | 25 | 89 | 287 |
| D | 100 | 18 | 108 | 104 | 105 | 25 | 173 |
| H | 23 | 83 | 123 | 342 | 98 | 48 | 205 |
| I | 173 | 428 | 103 | 325 | 82 | 215 | 23 |
| J | 305 | 173 | 138 | 49 | 81 | 258 | 207 |
sample 6
Both rows and column order is specified using a leading column and row.
To parse this file correctly, you must check row with col order and col with row order.
| data | data | 1 | 7 | 3 | 4 | 2 | 6 | 5 |
| data | data | A | B | C | D | E | F | G |
| 1 | A | 105 | 450 | 92 | 96 | 5 | 301 | 195 |
| 7 | B | 20 | 46 | 78 | 33 | 53 | 28 | 83 |
| 3 | C | 118 | 553 | 94 | 317 | 25 | 89 | 287 |
| 4 | D | 100 | 18 | 108 | 104 | 105 | 25 | 173 |
| 0 | H | 23 | 83 | 123 | 342 | 98 | 48 | 205 |
| 9 | I | 173 | 428 | 103 | 325 | 82 | 215 | 23 |
| 8 | J | 305 | 173 | 138 | 49 | 81 | 258 | 207 |
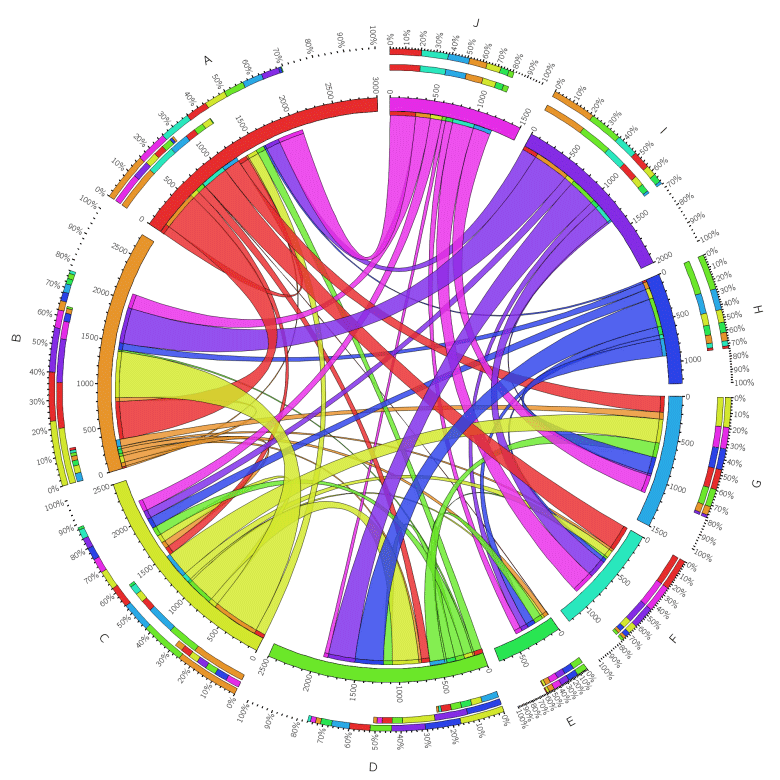
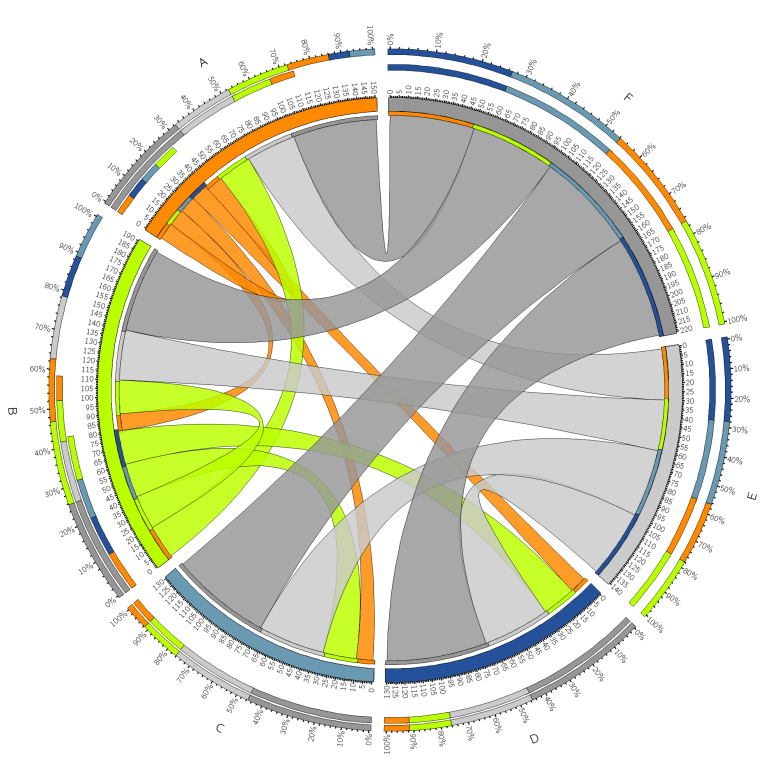
sample 7
The size of the segment is automatically calculated based on the total cell values for a given label. You can override the segment size by including a size column and/or row.
If you set the size to be larger than the cell total for a label, the trailing part of the segment will be unoccupied.
If you set the size to be smaller than the cell total for a label, some cell ribbons will not be displayed.
To parse this file correctly, you must check row with col size and col with row size.
| data | data | 3000 | 2750 | 2500 | 2500 | 750 | 1250 | 1500 |
| data | data | A | B | C | D | E | F | G |
| 3000 | A | 105 | 450 | 92 | 96 | 5 | 301 | 195 |
| 2750 | B | 20 | 46 | 78 | 33 | 53 | 28 | 83 |
| 2500 | C | 118 | 553 | 94 | 317 | 25 | 89 | 287 |
| 2500 | D | 100 | 18 | 108 | 104 | 105 | 25 | 173 |
| 1250 | H | 23 | 83 | 123 | 342 | 98 | 48 | 205 |
| 2000 | I | 173 | 428 | 103 | 325 | 82 | 215 | 23 |
| 1500 | J | 305 | 173 | 138 | 49 | 81 | 258 | 207 |
sample 8
You can include both segment size and order rows and columns. If both are used, the first leading row/column will determine the order, and the second leading row/column will determine the size.
To parse this file correctly, you must check row with col size, col with row size, row with col order and col with row order.
| data | data | data | 5 | 2 | 7 | 4 | 1 | 3 | 6 |
| data | data | data | 3000 | 2750 | 2500 | 2500 | 750 | 1250 | 1500 |
| data | data | data | A | B | C | D | E | F | G |
| 5 | 3000 | A | 105 | 450 | 92 | 96 | 5 | 301 | 195 |
| 2 | 2750 | B | 20 | 46 | 78 | 33 | 53 | 28 | 83 |
| 7 | 2500 | C | 118 | 553 | 94 | 317 | 25 | 89 | 287 |
| 4 | 2500 | D | 100 | 18 | 108 | 104 | 105 | 25 | 173 |
| 10 | 1250 | H | 23 | 83 | 123 | 342 | 98 | 48 | 205 |
| 9 | 2000 | I | 173 | 428 | 103 | 325 | 82 | 215 | 23 |
| 8 | 1500 | J | 305 | 173 | 138 | 49 | 81 | 258 | 207 |
sample 9
Normally colors are automatically assigned to segments. You can assign colors to segments by including a row (and/or column) that contains RGB colors for each segment.
If a column and row share a label (e.g. A), then both color definitions (in the color row and column) must be identical (here, 255,136,0 which is orange).
To parse this file correctly, you must check row with color column, col with color row.
| data | data | 255,136,0 | 186,255,0 | 104,152,178 | 38,82,153 |
| data | data | A | B | C | D |
| 255,136,0 | A | 10 | 10 | 10 | 10 |
| 186,255,0 | B | 20 | 20 | 20 | 20 |
| 200,200,200 | E | 30 | 30 | 40 | 40 |
| 150,150,150 | F | 50 | 50 | 60 | 60 |
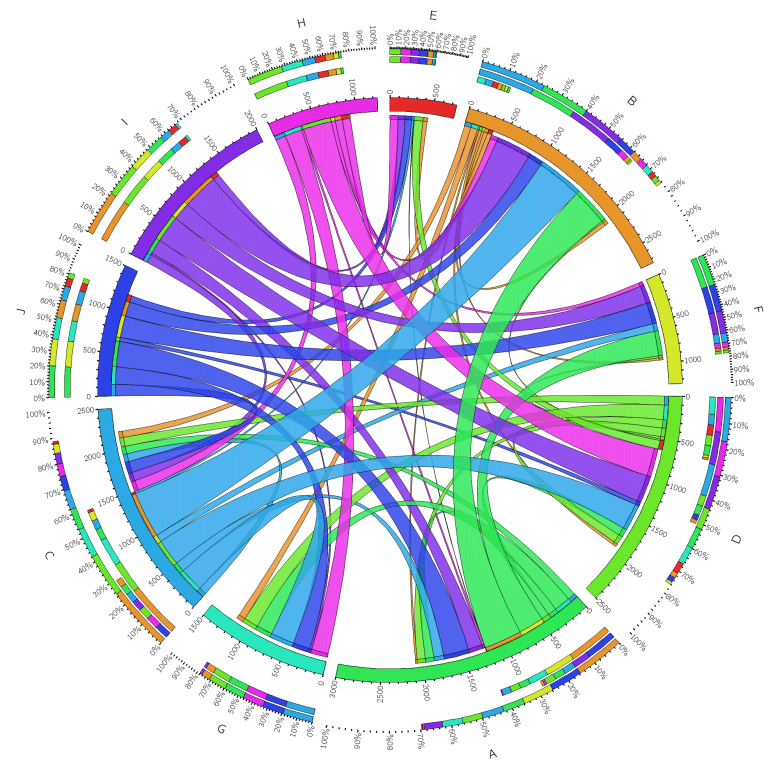
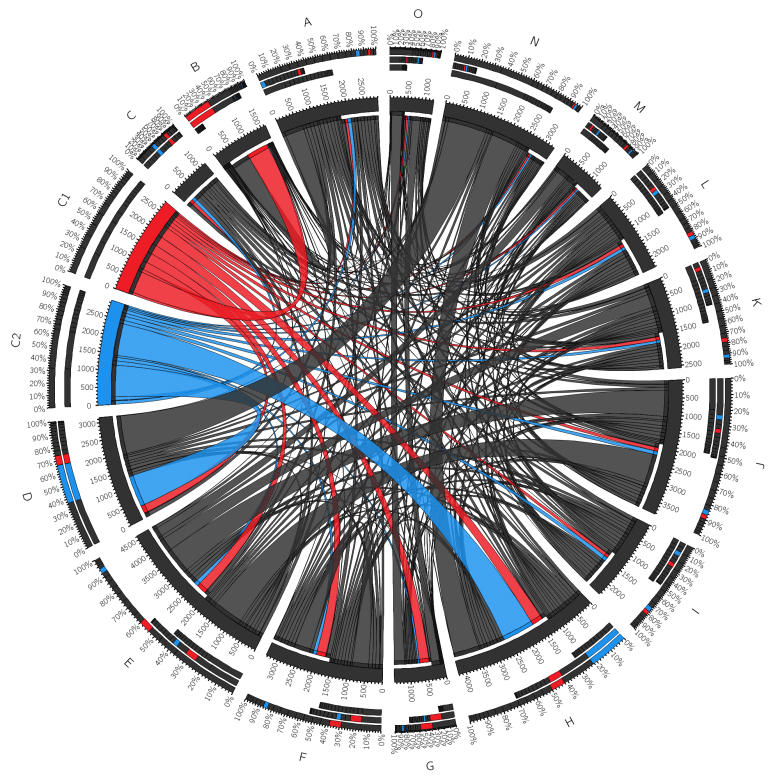
sample 10
Use custom colors to create images in which only ribbons for some columns and/or rows are colored.
Ribbons derive their color from the color of the row segment. Here, rows C1 and C2 have spot colors (C1 is red, C2 is blue) and all other segments are dark grey. Notice that you must specify a color for all segments, even if the same color is repeated.
If a column and row share a label (e.g. A), then both color definitions (in the color row and column) must be identical (here, 255,136,0 which is orange).
To parse this file correctly, you must check row with color column, col with color row.
| data | data | 50,50,50 | 50,50,50 | 50,50,50 | 50,50,50 | 50,50,50 | 50,50,50 | 50,50,50 | 50,50,50 | 50,50,50 | 50,50,50 | 50,50,50 | 50,50,50 | 50,50,50 | 50,50,50 | 50,50,50 |
| data | data | A | B | C | D | E | F | G | H | I | J | K | L | M | N | O |
| 50,50,50 | A | 91 | 558 | 96 | 113 | 109 | 125 | 57 | 109 | 115 | 102 | 92 | 89 | 42 | 51 | 45 |
| 50,50,50 | B | 21 | 1 | 21 | 21 | 18 | 18 | 8 | 25 | 17 | 20 | 16 | 21 | 11 | 8 | 10 |
| 236,28,36 | C1 | 75 | 652 | 93 | 232 | 290 | 278 | 291 | 332 | 99 | 109 | 101 | 97 | 54 | 50 | 48 |
| 28,145,236 | C2 | 104 | 22 | 100 | 940 | 120 | 109 | 52 | 958 | 112 | 116 | 92 | 96 | 49 | 50 | 45 |
| 50,50,50 | E | 97 | 22 | 122 | 86 | 112 | 102 | 47 | 104 | 81 | 898 | 79 | 101 | 55 | 54 | 47 |
| 50,50,50 | F | 83 | 23 | 103 | 96 | 114 | 483 | 46 | 95 | 97 | 94 | 93 | 92 | 50 | 51 | 52 |
| 50,50,50 | G | 12 | 2 | 10 | 10 | 8 | 10 | 0 | 8 | 10 | 8 | 9 | 9 | 6 | 5 | 247 |
| 50,50,50 | H | 96 | 20 | 109 | 102 | 106 | 107 | 48 | 117 | 98 | 88 | 94 | 111 | 44 | 46 | 48 |
| 50,50,50 | I | 100 | 21 | 98 | 87 | 97 | 95 | 45 | 92 | 119 | 111 | 86 | 106 | 50 | 57 | 49 |
| 50,50,50 | J | 101 | 18 | 81 | 83 | 777 | 111 | 52 | 115 | 100 | 100 | 109 | 99 | 44 | 48 | 45 |
| 50,50,50 | K | 96 | 19 | 96 | 97 | 400 | 105 | 43 | 86 | 103 | 112 | 92 | 86 | 52 | 52 | 48 |
| 50,50,50 | L | 100 | 19 | 122 | 70 | 97 | 90 | 41 | 110 | 94 | 85 | 97 | 98 | 60 | 46 | 47 |
| 50,50,50 | M | 45 | 9 | 49 | 42 | 280 | 47 | 28 | 50 | 47 | 40 | 49 | 50 | 25 | 22 | 29 |
| 50,50,50 | N | 81 | 16 | 80 | 1159 | 78 | 77 | 38 | 773 | 66 | 73 | 64 | 80 | 35 | 41 | 37 |
| 50,50,50 | O | 8 | 2 | 8 | 9 | 9 | 12 | 312 | 11 | 9 | 9 | 9 | 8 | 4 | 6 | 5 |
Cookie version [NO_VERSION]. Wrong cookie version [NO_VERSION] but needed [0.63-10]. Making new cookie. access_code color_ribbons_by_value 0 contribution_tracks encoding fade_transparency 0 format intra_segment label_segment_color vvvdgrey label_segment_font normal label_segment_font_size 24 label_segment_on_segment label_segment_parallel 1 label_tick_color vvvdgrey label_tick_font light label_tick_font_size 16 label_tick_parallel 0 min_percentile 0 normalize 0 placement_order row,col q1ribbonc inherit q1ribbons 1 q1ribbont inherit q1ribbonuse q2ribbonc inherit q2ribbons 1 q2ribbont inherit q2ribbonuse q3ribbonc inherit q3ribbons 1 q3ribbont inherit q3ribbonuse q4ribbonc inherit q4ribbons 1 q4ribbont inherit q4ribbonuse ratio_layout reverse_ribbons ribbon_bundle_order native ribbon_caps ribbon_color_source row ribbon_layer_order size_asc segment_color_interpolation count segment_color_order ascii segment_order ascii segment_order_progression size_desc segment_radius 0.75 segment_spacing 0.0075r segment_thickness 35p transparency 1 version 0.63-10 Baking new cookie. connection localparams
$VAR1 = {};cookie
$VAR1 = { 'access_code' => [ '' ], 'color_ribbons_by_value' => [ 0 ], 'contribution_tracks' => [ '', '', '' ], 'encoding' => [ '' ], 'fade_transparency' => [ 0 ], 'format' => [ '', '', '', '', '', '', '', '' ], 'intra_segment' => [ '' ], 'label_segment_color' => [ 'vvvdgrey' ], 'label_segment_font' => [ 'normal' ], 'label_segment_font_size' => [ 24 ], 'label_segment_on_segment' => [ '' ], 'label_segment_parallel' => [ 1 ], 'label_tick_color' => [ 'vvvdgrey' ], 'label_tick_font' => [ 'light' ], 'label_tick_font_size' => [ 16 ], 'label_tick_parallel' => [ 0 ], 'min_percentile' => [ 0 ], 'normalize' => [ 0 ], 'placement_order' => [ 'row,col' ], 'q1ribbonc' => [ 'inherit' ], 'q1ribbons' => [ 1 ], 'q1ribbont' => [ 'inherit' ], 'q1ribbonuse' => [ '' ], 'q2ribbonc' => [ 'inherit' ], 'q2ribbons' => [ 1 ], 'q2ribbont' => [ 'inherit' ], 'q2ribbonuse' => [ '' ], 'q3ribbonc' => [ 'inherit' ], 'q3ribbons' => [ 1 ], 'q3ribbont' => [ 'inherit' ], 'q3ribbonuse' => [ '' ], 'q4ribbonc' => [ 'inherit' ], 'q4ribbons' => [ 1 ], 'q4ribbont' => [ 'inherit' ], 'q4ribbonuse' => [ '' ], 'ratio_layout' => [ '' ], 'reverse_ribbons' => [ '' ], 'ribbon_bundle_order' => [ 'native' ], 'ribbon_caps' => [ '', '', '' ], 'ribbon_color_source' => [ 'row' ], 'ribbon_layer_order' => [ 'size_asc' ], 'segment_color_interpolation' => [ 'count' ], 'segment_color_order' => [ 'ascii' ], 'segment_order' => [ 'ascii' ], 'segment_order_progression' => [ 'size_desc' ], 'segment_radius' => [ '0.75' ], 'segment_spacing' => [ '0.0075r' ], 'segment_thickness' => [ '35p' ], 'transparency' => [ 1 ], 'version' => [ '0.63-10' ] };
| CGI Param |
| ENV | |
| CONTEXT_DOCUMENT_ROOT | /home/martink/www/htdocs |
| CONTEXT_PREFIX | |
| DOCUMENT_ROOT | /home/martink/www/htdocs |
| GATEWAY_INTERFACE | CGI/1.1 |
| HTTPS | on |
| HTTP_ACCEPT | text/html,application/xhtml+xml,application/xml;q=0.9,image/avif,image/webp,image/apng,*/*;q=0.8,application/signed-exchange;v=b3;q=0.7 |
| HTTP_ACCEPT_ENCODING | gzip, deflate, br, zstd |
| HTTP_CACHE_CONTROL | no-cache |
| HTTP_CONNECTION | keep-alive |
| HTTP_HOST | mk.bcgsc.ca |
| HTTP_PRAGMA | no-cache |
| HTTP_SEC_CH_UA | "HeadlessChrome";v="129", "Not=A?Brand";v="8", "Chromium";v="129" |
| HTTP_SEC_CH_UA_MOBILE | ?0 |
| HTTP_SEC_CH_UA_PLATFORM | "Windows" |
| HTTP_SEC_FETCH_DEST | document |
| HTTP_SEC_FETCH_MODE | navigate |
| HTTP_SEC_FETCH_SITE | none |
| HTTP_SEC_FETCH_USER | ?1 |
| HTTP_SURROGATE_CAPABILITY | proxy11.dmz.bcgsc.ca="Surrogate/1.0 ESI/1.0" |
| HTTP_UPGRADE_INSECURE_REQUESTS | 1 |
| HTTP_USER_AGENT | Mozilla/5.0 AppleWebKit/537.36 (KHTML, like Gecko; compatible; ClaudeBot/1.0; +claudebot@anthropic.com) |
| HTTP_VIA | 1.1 proxy11.dmz.bcgsc.ca (squid/5.5) |
| MOD_PERL | mod_perl/2.0.12 |
| MOD_PERL_API_VERSION | 2 |
| PATH | /usr/local/sbin:/usr/local/bin:/usr/sbin:/usr/bin |
| PATH_INFO | / |
| PATH_TRANSLATED | /home/martink/www/htdocs/index.mhtml |
| QUERY_STRING | |
| REMOTE_ADDR | 3.145.63.63 |
| REMOTE_PORT | 54566 |
| REQUEST_METHOD | GET |
| REQUEST_SCHEME | https |
| REQUEST_URI | /tableviewer/samples/ |
| SCRIPT_FILENAME | /home/martink/www/htdocs/tableviewer/samples |
| SCRIPT_NAME | /tableviewer/samples |
| SCRIPT_URI | https://mk.bcgsc.ca/tableviewer/samples/ |
| SCRIPT_URL | /tableviewer/samples/ |
| SERVER_ADDR | 10.9.208.135 |
| SERVER_ADMIN | martink@bcgsc.ca |
| SERVER_NAME | mk.bcgsc.ca |
| SERVER_PORT | 443 |
| SERVER_PROTOCOL | HTTP/1.1 |
| SERVER_SIGNATURE | |
| SERVER_SOFTWARE | Apache |
| UNIQUE_ID | Z_Fh_ypMaPGyRmmJEtZhRwAAAAc |
cookie
| cookie not defined |