6 . what is this?
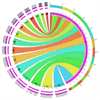
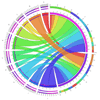
The Circos table viewer uses the Circos application to turn data tables into chord diagrams.
into circularly composited visualizations like this
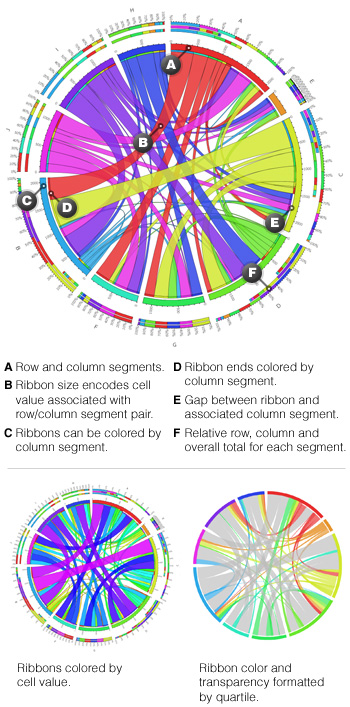
Through the settings panel You can control the manner in which your tabular data is parsed, filtered and displayed.
If you are interested in this approach, read Visualizing Tabular Data - Introduction. If you are interested in the details proceed to Visualizing Tabular Data - How to Use Circos to Visualize Tables.
This kind of plot is implemented in Pentaho and d3.js, which calls them chord diagrams. Circos table visualizations have been used to explore global migration (step-by-step tutorial) and inspired mosaic art.
7 . panel
Many people have used Circos to generate visual representations of tables. Below is a panel of 15,129 visualized tables. Download very hires hires.

0 . read slogan badges

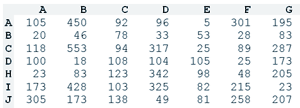
1 . check data format
Before uploading a data file, check the samples gallery to make sure that your data format is compatible.
- File must be plain text.
- Data values must be non-negative integers. If all are <1, multiply them by a fixed factor.
- Data must be space-separated (one or more tab or space, which will be collapsed).
- No two rows or columns may have the same name.
- Column and row names must begin with a letter (e.g. 'A', 'A0', 'A-0') and can only contain letters, numbers and _. No punctuation! No double underscores.
- Maximum number of rows × columns is 50 × 50.
- If you are using order, size and color rows/columns in combination they must appear in that order.
If you do not adhere to these rules, expect errors.
Need help? Post questions to the Circos Google Group.
2a . upload your file
If you are using the size, order or color options below, make sure your input file has the appropriate content (see samples 5-9).
If you'd like to edit the image (e.g. arrange labels, change specific colors, etc) use the SVG file, which is provided in the download link once the image is created.
2b . try random data
Don't have a data file? No problem, try our random data generator. Adjust the settings to change the figure.
|
|
|
|
3 . wait 10-30 seconds
Some images can take a while to make &mdsah; be patient.
Current load is 0/2. System is available.
4 . privacy
Do not use this tool on confidential or sensitive information (use the offline tableviewer which has a tutorial). All any files you send or are created during the analysis will be deleted 10 minutes after your upload.
5 . updates
27.sep.22 You can now request an access code to visualize larger tables.
16.aug.22 Updated Max row/col logic. Updated logging. Minor cosmetic changes.
9.oct.15 Updated to use Circos 0.68. Added ability to hide first tick and force drawing last tick, which corresponds to segment size.
7.sep.12 Updated to use Circos 0.63. Batch file in batch/ now uses relative paths.
12.mar.12 Updated sample images.
7.mar.12 Fixed cookie bugs. Added image features: segment radius/spacing and segment/tick label color.
14.feb.12 Fixed bugs caused by Mac and DOS line ends.
8.feb.12 Fixed bugs caused by stale cookies.
3.jan.12 More image settings.
6.aug.10 Added colored ribbon caps to indicate identity of distant segment.
28.apr.10 Added quartile ribbon transparency and color options.
27.apr.10 Added ratio layout and verbose option reports.
23.apr.10 Archive added. Site layout updated.
22.apr.10 You can specify row/col color. See Sample 9.
25.mar.10 Ribbons now have transparency. Images are anti-aliased. Web tool now doesn't crash as often.
Cookie version [NO_VERSION]. Wrong cookie version [NO_VERSION] but needed [0.63-10]. Making new cookie. access_code color_ribbons_by_value 0 contribution_tracks encoding fade_transparency 0 format intra_segment label_segment_color vvvdgrey label_segment_font normal label_segment_font_size 24 label_segment_on_segment label_segment_parallel 1 label_tick_color vvvdgrey label_tick_font light label_tick_font_size 16 label_tick_parallel 0 min_percentile 0 normalize 0 placement_order row,col q1ribbonc inherit q1ribbons 1 q1ribbont inherit q1ribbonuse q2ribbonc inherit q2ribbons 1 q2ribbont inherit q2ribbonuse q3ribbonc inherit q3ribbons 1 q3ribbont inherit q3ribbonuse q4ribbonc inherit q4ribbons 1 q4ribbont inherit q4ribbonuse ratio_layout reverse_ribbons ribbon_bundle_order native ribbon_caps ribbon_color_source row ribbon_layer_order size_asc segment_color_interpolation count segment_color_order ascii segment_order ascii segment_order_progression size_desc segment_radius 0.75 segment_spacing 0.0075r segment_thickness 35p transparency 1 version 0.63-10 Baking new cookie. connection localparams
$VAR1 = {};cookie
$VAR1 = { 'access_code' => [ '' ], 'color_ribbons_by_value' => [ 0 ], 'contribution_tracks' => [ '', '', '' ], 'encoding' => [ '' ], 'fade_transparency' => [ 0 ], 'format' => [ '', '', '', '', '', '', '', '' ], 'intra_segment' => [ '' ], 'label_segment_color' => [ 'vvvdgrey' ], 'label_segment_font' => [ 'normal' ], 'label_segment_font_size' => [ 24 ], 'label_segment_on_segment' => [ '' ], 'label_segment_parallel' => [ 1 ], 'label_tick_color' => [ 'vvvdgrey' ], 'label_tick_font' => [ 'light' ], 'label_tick_font_size' => [ 16 ], 'label_tick_parallel' => [ 0 ], 'min_percentile' => [ 0 ], 'normalize' => [ 0 ], 'placement_order' => [ 'row,col' ], 'q1ribbonc' => [ 'inherit' ], 'q1ribbons' => [ 1 ], 'q1ribbont' => [ 'inherit' ], 'q1ribbonuse' => [ '' ], 'q2ribbonc' => [ 'inherit' ], 'q2ribbons' => [ 1 ], 'q2ribbont' => [ 'inherit' ], 'q2ribbonuse' => [ '' ], 'q3ribbonc' => [ 'inherit' ], 'q3ribbons' => [ 1 ], 'q3ribbont' => [ 'inherit' ], 'q3ribbonuse' => [ '' ], 'q4ribbonc' => [ 'inherit' ], 'q4ribbons' => [ 1 ], 'q4ribbont' => [ 'inherit' ], 'q4ribbonuse' => [ '' ], 'ratio_layout' => [ '' ], 'reverse_ribbons' => [ '' ], 'ribbon_bundle_order' => [ 'native' ], 'ribbon_caps' => [ '', '', '' ], 'ribbon_color_source' => [ 'row' ], 'ribbon_layer_order' => [ 'size_asc' ], 'segment_color_interpolation' => [ 'count' ], 'segment_color_order' => [ 'ascii' ], 'segment_order' => [ 'ascii' ], 'segment_order_progression' => [ 'size_desc' ], 'segment_radius' => [ '0.75' ], 'segment_spacing' => [ '0.0075r' ], 'segment_thickness' => [ '35p' ], 'transparency' => [ 1 ], 'version' => [ '0.63-10' ] };
| CGI Param |
| ENV | |
| CONTEXT_DOCUMENT_ROOT | /home/martink/www/htdocs |
| CONTEXT_PREFIX | |
| DOCUMENT_ROOT | /home/martink/www/htdocs |
| GATEWAY_INTERFACE | CGI/1.1 |
| HTTPS | on |
| HTTP_ACCEPT | */* |
| HTTP_CACHE_CONTROL | max-age=259200 |
| HTTP_CONNECTION | keep-alive |
| HTTP_HOST | mk.bcgsc.ca |
| HTTP_IF_MODIFIED_SINCE | Sat, 27 Apr 2024 10:01:52 GMT |
| HTTP_REFERER | https://mkweb.bcgsc.ca/tableviewer/ |
| HTTP_SURROGATE_CAPABILITY | mkweb03.bcgsc.ca="Surrogate/1.0 ESI/1.0" |
| HTTP_USER_AGENT | Mozilla/5.0 AppleWebKit/537.36 (KHTML, like Gecko; compatible; ClaudeBot/1.0; +claudebot@anthropic.com) |
| HTTP_VIA | 1.1 mkweb03.bcgsc.ca (squid/5.5) |
| MOD_PERL | mod_perl/2.0.12 |
| MOD_PERL_API_VERSION | 2 |
| PATH | /usr/local/sbin:/usr/local/bin:/usr/sbin:/usr/bin |
| QUERY_STRING | |
| REMOTE_ADDR | 3.144.230.82 |
| REMOTE_PORT | 43384 |
| REQUEST_METHOD | GET |
| REQUEST_SCHEME | https |
| REQUEST_URI | /tableviewer/ |
| SCRIPT_FILENAME | /home/martink/www/htdocs/tableviewer/index.mhtml |
| SCRIPT_NAME | /tableviewer/index.mhtml |
| SCRIPT_URI | https://mk.bcgsc.ca/tableviewer/ |
| SCRIPT_URL | /tableviewer/ |
| SERVER_ADDR | 10.9.208.135 |
| SERVER_ADMIN | martink@bcgsc.ca |
| SERVER_NAME | mk.bcgsc.ca |
| SERVER_PORT | 443 |
| SERVER_PROTOCOL | HTTP/1.1 |
| SERVER_SIGNATURE | |
| SERVER_SOFTWARE | Apache/2.4.53 (Rocky Linux) OpenSSL/3.0.7 mod_apreq2-20101207/2.8.1 mod_perl/2.0.12 Perl/v5.32.1 |
| UNIQUE_ID | ZizRVmEtbuN7HYHBb4ufgQAAAJA |
cookie
| cookie not defined |