

History of the Human Genome Assembly
22 years, 3,117,275,501 bases and 0 gaps later
Round numbers are always false.
— Samuel Johnson

contents
- 1 · Glossary of terms
- 2 · Human genome assembly through the years
- 3 · Human genome assembly — the last step
- 4 · Creating the Scientific American graphic
- 4.1 · Assembly alignments to CHM13v2
- 4.2 · CHM13v2 alignment coverage
- 4.3 · Assembly history
- 4.4 · Incremental assembly history
- 4.5 · Cumulative assembly history
- 5 · Assembly history in visual form
First, a few terms to know. For more definitions, see the NIH glossary of genomic and genetic terms.
base — one of the the nucleotides A, T, G or C (in genomic sequence) and a fundamental unit of genetic information
chromosome — a threadlike structure comprising a single molecule of DNA along with proteins that create a top-level package of genomic information and serve to carry it from cell to cell
mitocondrial chromosome — a very short (e.g. human chrM is 16,569 bases) maternally-inherited circular chromosome found inside mitochondria that encode proteins involved in oxidative phosphorylation system
sequence read — an individual sequence fragment read out by a DNA sequencer, which may vary in length from 10's to 1000's of bases
contig — continuous stretches of sequence containing without gaps (i.e. containing only A, C, G, or T bases)
scaffold — an ordered set of contigs separated by gaps that are created using additional information about the relative position and orientation of the contigs
gap — a stretch of N's in a sequence representing a gap in the sequence due to lack of coverage whose length may be set to certain fixed values to represent the reason for the gap (e.g. contig gap).
assembly — an ordered and oriented set of nucleotide sequences (usually scaffolds)
fasta file — a plain-text file format for storing sequence information
Before I describe the method used to generate the graphic, let's look at some details of how the human genome assembly changed over the years, in the context of sizes of sequenced regions and gaps.
In the table below, I show the total sequence size of each assembly from hg1 (May 2000) through hg38 (Dec 2013) (download hg assemblies) to the gapless CHM13v2 telomere-to-telomere (T2T) assembly (Mar 2022). Here, the sequence size reflects the number of bases in the assemblies of chromosomes 1–22, X, and Y and excludes the mitochondrial chromosome and any unanchored, alternate or random content.
assembly year month            seq          +seq  seq/CHM    gap_n     gap_size
     hg1 2000 May    2,429,568,807                 77.94%  756,351  386,046,812
     hg2 2000 June   2,407,220,830   -22,347,977   77.22%  503,500  590,322,429
     hg4 2000 Sep    2,592,759,797   185,538,967   83.17%  332,807  508,661,915
     hg5 2000 Oct    2,662,673,274    69,913,477   85.42%  338,786  647,331,541
     hg6 2000 Dec    2,679,206,778    16,533,504   85.95%  296,300  571,716,303
     hg7 2001 Apr    2,733,032,147    53,825,369   87.67%  265,972  524,112,663
     hg8 2001 Aug    2,849,390,173   116,358,026   91.41%  232,126  529,686,227
    hg10 2001 Dec    2,795,152,898   -54,237,275   89.67%  124,985  350,152,047
    hg11 2002 Apr    2,824,723,360    29,570,462   90.62%   89,709  299,451,070
    hg12 2002 June   2,810,120,127   -14,603,233   90.15%   70,360  231,723,944
    hg13 2002 Nov    2,843,602,073    33,481,946   91.22%   69,862  207,028,754
    hg15 2003 Apr    2,832,183,299   -11,418,774   90.85%      507  238,337,817
    hg16 2003 July   2,843,413,503    11,230,204   91.21%      412  226,714,556
    hg17 2004 May    2,851,330,913     7,917,410   91.47%      345  225,450,974
    hg18 2006 Mar    2,858,012,806     6,681,893   91.68%      333  222,406,674
    hg19 2009 Feb    2,861,327,131     3,314,325   91.79%      362  234,350,281
    hg38 2013 Dec    2,937,639,113    76,311,982   94.24%    1,001  150,630,719
 CHM13v2 2022 Mar    3,117,275,501   179,636,388  100.00%        0            0
The public open-source assemblies were indexed by hgN from hg1 (May 2000) to hg38 (Dec 2013). Differences in the index value do not necessarily represent how much of the assembly changed and some indexes were skipped. Notably, although hg3 (July 2000) is reported to exist, I have been unable to locate its sequence files. Apparently, nobody can find the sequence files for hg3!
In the first assembly, hg1 (May 2000), chromosomes were reported in individual contigs. A contig is a contiguous sequence assembly and may have gaps. Chromosomes 1–22, X and Y comprised 1,620 contigs — for example, chromosome 1 was reported in 149 contigs. The number of gaps and gap size for hg1 in the table above does not reflect the gaps between contigs. In subsequent assemblies, these contigs were concatenated (with a contig-level gap as a separator) into a chromosome-level assembly.
One way to understand the pace of development of the human genome assembly is to look over the years at (a) how much sequence was added to each chromosome and (b) how many gaps (regions of unknown sequence) were closed.
For example, from 2000 to 2022 the amount of sequence in chromosome 1 changed from 210,989,981 to 248,387,328 bases, while the number of gaps in chromosome 1 dropped from 19,758 to zero.
Early in the assembly's history, some chromosome sizes decreased as misassembled regions were moved to their correct chromosome. More recently, chromosome sizes increased as gaps were filled in and difficult-to-sequence regions were completed.
The interesting consequence to this is that the order of chromosomes by their label no longer reflects their order by size. For example, chr9, chr11, chr20 and chr22 are all larger than their preceeding counterparts chr8, chr10, chr19, chr21, respectively.
In the table below, I show how the amount of sequence in each chromosome's assembly changed through the years — the most recent assembly within a given year is reported. Years in which the chromosome size increased by more than 2%, 5% or 10% are shown in light to dark green. Where size decreased by 1%, 2.5% or 4%, lines are shown in light to dark pink.
The values here represent the amount of known sequence in a chromosome — its total length would be this value plus the total size of gaps in the chromosome. For the CHM13v2 assembly, since there are no gaps, this value is equal to the length of the chromosome assembly.
Assembly names preceeded by * are the last assemblies for their given year and form the basis for the year's representation in the graphic. These were
hg6 (Dec 2000),
hg10 (Dec 2001),
hg13 (Nov 2002),
hg16 (July 2003),
hg17 (May 2004),
hg18 (Mar 2006),
hg19 (Feb 2009),
hg38 (Dec 2013).
               len (bases) Δ(%)
assembly year ----- chr1 -----  ----- chr2 -----  ----- chr3 -----  ----- chr4 -----
     hg1 2000 168,913,425       196,386,279       163,542,702       144,098,731
     hg2 2000 183,709,012  8.1  194,383,237 -1.0  165,584,260  1.2  133,549,012 -7.9
     hg4 2000 201,521,296  8.8  214,586,282  9.4  176,970,320  6.4  148,983,448 10.4
     hg5 2000 209,982,297  4.0  220,854,774  2.8  185,825,750  4.8  167,597,939 11.1
    *hg6 2000 210,989,981  0.5  221,356,626  0.2  185,824,536 -0.0  169,058,312  0.9
     hg7 2001 222,977,559  5.4  221,725,538  0.2  184,829,848 -0.5  171,864,472  1.6
     hg8 2001 234,799,493  5.0  225,165,963  1.5  194,242,316  4.8  176,201,768  2.5
   *hg10 2001 227,673,339 -3.1  226,391,327  0.5  184,536,607 -5.3  172,328,593 -2.2
    hg11 2002 221,443,782 -2.8  238,221,181  5.0  187,464,974  1.6  187,759,065  8.2
    hg12 2002 220,881,717 -0.3  236,107,886 -0.9  189,490,410  1.1  187,561,753 -0.1
   *hg13 2002 221,229,757  0.2  237,456,869  0.6  194,222,908  2.4  187,608,462  0.0
    hg15 2003 218,712,898 -1.2  237,043,673 -0.2  193,607,218 -0.3  186,580,523 -0.6
   *hg16 2003 221,562,941  1.3  237,541,603  0.2  194,473,776  0.4  186,841,959  0.1
   *hg17 2004 222,827,847  0.6  237,503,374 -0.0  194,635,735  0.1  187,161,218  0.2
   *hg18 2006 224,999,719  1.0  237,709,794  0.1  194,704,822  0.0  187,297,063  0.1
   *hg19 2009 225,280,621  0.1  238,204,518  0.2  194,797,135  0.0  187,661,676  0.2
   *hg38 2013 230,481,012  2.3  240,548,228  1.0  198,100,135  1.7  189,752,667  1.1
 CHM13v2 2022 248,387,328  7.2  242,696,752  0.9  201,105,948  1.5  193,574,945  2.0
assembly year ----- chr5 -----  ----- chr6 -----  ----- chr7 -----  ----- chr8 -----
     hg1 2000 164,809,671       146,037,284       126,787,148       112,574,678
     hg2 2000 166,925,488  1.3  149,388,392  2.2  121,050,404 -4.7  110,307,747 -2.1
     hg4 2000 163,940,667 -1.8  159,837,923  6.5  139,317,378 13.1  120,650,901  8.6
     hg5 2000 167,994,833  2.4  158,085,470 -1.1  145,591,522  4.3  124,248,692  2.9
    *hg6 2000 166,043,302 -1.2  158,660,857  0.4  147,591,730  1.4  124,912,316  0.5
     hg7 2001 164,878,747 -0.7  165,881,551  4.4  147,038,945 -0.4  129,385,700  3.5
     hg8 2001 172,166,415  4.2  176,828,634  6.2  156,866,542  6.3  137,308,140  5.8
   *hg10 2001 169,841,985 -1.4  172,818,856 -2.3  156,983,175  0.1  133,762,905 -2.7
    hg11 2002 181,189,438  6.3  176,229,400  1.9  155,514,763 -0.9  140,091,045  4.5
    hg12 2002 176,708,043 -2.5  166,004,516 -6.2  153,794,993 -1.1  139,191,073 -0.6
   *hg13 2002 177,638,514  0.5  166,765,675  0.5  153,794,793 -0.0  142,314,151  2.2
    hg15 2003 177,524,972 -0.1  166,880,540  0.1  154,546,299  0.5  141,694,337 -0.4
   *hg16 2003 177,552,822  0.0  167,256,575  0.2  154,676,518  0.1  142,347,919  0.5
   *hg17 2004 177,702,766  0.1  167,317,698  0.0  154,759,139  0.1  142,612,826  0.2
   *hg18 2006 177,702,766  0.0  167,273,991 -0.0  154,952,424  0.1  142,612,826  0.0
   *hg19 2009 177,695,260 -0.0  167,395,066  0.1  155,353,663  0.3  142,888,922  0.2
   *hg38 2013 181,265,378  2.0  170,078,522  1.6  158,970,131  2.3  144,768,136  1.3
 CHM13v2 2022 182,045,439  0.4  172,126,628  1.2  160,567,428  1.0  146,259,331  1.0
assembly year ----- chr9 -----  ----- chr10-----  ----- chr11-----  ----- chr12-----
     hg1 2000  96,580,761       112,082,289       114,442,972       117,488,755
     hg2 2000 101,613,999  5.0  119,941,602  6.6  119,010,047  3.8  113,377,946 -3.6
     hg4 2000 103,119,589  1.5  123,122,208  2.6  127,294,940  6.5  123,024,623  7.8
     hg5 2000 106,904,027  3.5  126,683,514  2.8  128,591,838  1.0  124,426,716  1.1
    *hg6 2000 109,839,313  2.7  127,014,353  0.3  129,303,236  0.6  125,990,086  1.2
     hg7 2001 111,915,677  1.9  131,169,312  3.2  133,764,924  3.3  129,714,762  2.9
     hg8 2001 119,660,584  6.5  135,125,817  2.9  136,554,494  2.0  134,784,902  3.8
   *hg10 2001 115,158,754 -3.9  132,754,952 -1.8  133,828,821 -2.0  129,564,139 -4.0
    hg11 2002 112,776,971 -2.1  132,211,963 -0.4  127,267,213 -5.2  124,711,282 -3.9
    hg12 2002 115,238,209  2.1  130,722,965 -1.1  130,025,188  2.1  126,156,683  1.1
   *hg13 2002 116,960,681  1.5  130,943,927  0.2  132,130,624  1.6  128,265,502  1.6
    hg15 2003 115,187,714 -1.5  130,710,865 -0.2  130,709,420 -1.1  129,328,332  0.8
   *hg16 2003 115,624,042  0.4  131,173,206  0.4  130,908,854  0.2  129,826,277  0.4
   *hg17 2004 117,781,268  1.8  131,613,619  0.3  131,130,753  0.2  130,259,309  0.3
   *hg18 2006 120,143,252  2.0  131,624,728  0.0  131,130,753  0.0  130,303,032  0.0
   *hg19 2009 120,143,431  0.0  131,314,738 -0.2  131,129,516 -0.0  130,481,393  0.1
   *hg38 2013 121,790,550  1.4  133,262,962  1.5  134,533,742  2.5  133,137,816  2.0
 CHM13v2 2022 150,617,247 19.1  134,758,134  1.1  135,127,769  0.4  133,324,548  0.1
assembly year ----- chr13-----  ----- chr14-----  ----- chr15-----  ----- chr16-----
     hg1 2000  85,645,372        79,343,804        67,826,689        74,917,520
     hg2 2000  87,721,609  2.4   81,516,980  2.7   66,300,573 -2.3   71,700,752 -4.5
     hg4 2000  90,313,480  2.9   88,301,397  7.7   72,271,491  8.3   65,176,734 -10.
     hg5 2000  92,930,944  2.8   86,324,201 -2.3   73,349,533  1.5   71,375,964  8.7
    *hg6 2000  93,269,031  0.4   86,368,090  0.1   74,363,214  1.4   73,084,034  2.3
     hg7 2001  96,607,817  3.5   87,531,345  1.3   75,875,723  2.0   74,218,216  1.5
     hg8 2001  97,944,675  1.4   88,761,063  1.4   80,448,614  5.7   81,170,232  8.6
   *hg10 2001  97,023,436 -0.9   88,460,447 -0.3   77,195,556 -4.2   76,728,727 -5.8
    hg11 2002  96,006,001 -1.1   87,931,086 -0.6   79,566,986  3.0   77,742,614  1.3
    hg12 2002  95,206,001 -0.8   87,163,614 -0.9   79,644,830  0.1   77,609,164 -0.2
   *hg13 2002  95,228,136  0.0   88,115,227  1.1   82,886,735  3.9   80,565,380  3.7
    hg15 2003  95,511,656  0.3   87,191,216 -1.1   81,117,055 -2.2   79,890,791 -0.8
   *hg16 2003  95,559,980  0.1   87,191,216  0.0   81,259,656  0.2   79,932,429  0.1
   *hg17 2004  95,559,980  0.0   88,290,585  1.2   81,341,915  0.1   78,884,752 -1.3
   *hg18 2006  95,559,980  0.0   88,290,585  0.0   81,341,915  0.0   78,884,752  0.0
   *hg19 2009  95,589,878  0.0   88,289,540 -0.0   81,694,766  0.4   78,884,753  0.0
   *hg38 2013  97,983,125  2.4   90,568,149  2.5   84,641,325  3.5   81,805,943  3.6
 CHM13v2 2022 113,566,686 13.7  101,161,492 10.5   99,753,195 15.1   96,330,374 15.1
assembly year ----- chr17-----  ----- chr18-----  ----- chr19-----  ----- chr20-----
     hg1 2000  67,776,776        70,211,394        49,532,089        65,503,175
     hg2 2000  67,302,722 -0.7   70,585,267  0.5   48,893,614 -1.3   59,753,369 -9.6
     hg4 2000  69,520,272  3.2   72,643,538  2.8   50,903,878  3.9   63,588,720  6.0
     hg5 2000  72,210,252  3.7   72,442,291 -0.3   55,122,885  7.7   60,221,228 -5.6
    *hg6 2000  73,859,773  2.2   72,035,922 -0.6   53,798,088 -2.5   61,555,802  2.2
     hg7 2001  75,361,783  2.0   72,931,330  1.2   54,929,280  2.1   59,153,863 -4.1
     hg8 2001  77,552,140  2.8   77,219,105  5.6   59,871,347  8.3   59,153,863  0.0
   *hg10 2001  76,771,996 -1.0   74,351,766 -3.9   58,362,679 -2.6   59,153,863  0.0
    hg11 2002  75,590,181 -1.6   74,435,887  0.1   56,327,192 -3.6   59,387,171  0.4
    hg12 2002  75,718,615  0.2   73,033,376 -1.9   56,150,739 -0.3   59,422,997  0.1
   *hg13 2002  79,580,998  4.9   74,601,365  2.1   56,230,936  0.1   59,424,940  0.0
    hg15 2003  77,480,855 -2.7   74,534,531 -0.1   55,780,860 -0.8   59,424,990  0.0
   *hg16 2003  77,677,744  0.3   74,654,041  0.2   55,785,651  0.0   59,424,990  0.0
   *hg17 2004  77,800,220  0.2   74,656,155  0.0   55,785,651  0.0   59,505,253  0.1
   *hg18 2006  77,800,220  0.0   74,656,155  0.0   55,785,651  0.0   59,505,253  0.0
   *hg19 2009  77,795,210 -0.0   74,657,229  0.0   55,808,983  0.0   59,505,520  0.0
   *hg38 2013  82,920,204  6.2   80,089,605  6.8   58,440,758  4.5   63,944,257  6.9
 CHM13v2 2022  84,276,897  1.6   80,542,538  0.6   61,707,364  5.3   66,210,255  3.4
assembly year ----- chr21-----  ----- chr22-----  ----- chrX -----  ----- chrY -----
     hg1 2000  38,719,201        34,749,742       111,552,961        20,045,389
     hg2 2000  33,923,840 -14.   33,475,975 -3.8   87,142,038 -28.   20,062,945  0.1
     hg4 2000  33,823,978 -0.3   33,785,749  0.9  128,815,270 32.4   21,245,715  5.6
     hg5 2000  33,823,978  0.0   33,785,749  0.0  122,546,667 -5.1   21,752,210  2.3
    *hg6 2000  33,823,978  0.0   33,785,749  0.0  124,872,836  1.9   21,805,613  0.2
     hg7 2001  33,823,978  0.0   33,785,749  0.0  131,614,405  5.1   22,051,623  1.1
     hg8 2001  33,823,978  0.0   33,821,688  0.1  137,258,174  4.1   22,660,226  2.7
   *hg10 2001  33,827,908  0.0   33,821,688  0.0  141,143,154  2.8   22,668,225  0.0
    hg11 2002  33,829,102  0.0   33,821,688  0.0  142,536,150  1.0   22,668,225  0.0
    hg12 2002  33,834,561  0.0   33,821,688  0.0  143,962,881  1.0   22,668,225  0.0
   *hg13 2002  33,917,713  0.2   33,821,688  0.0  147,236,866  2.2   22,660,226 -0.0
    hg15 2003  33,924,742  0.0   34,352,051  1.5  147,686,664  0.3   22,761,097  0.4
   *hg16 2003  33,924,307 -0.0   34,352,051  0.0  149,215,391  1.0   24,649,555  7.7
   *hg17 2004  34,170,106  0.7   34,764,789  1.2  150,394,264  0.8   24,871,691  0.9
   *hg18 2006  34,170,106  0.0   34,851,311  0.2  151,058,754  0.4   25,652,954  3.0
   *hg19 2009  35,106,642  2.7   34,894,545  0.1  151,100,560  0.0   25,653,566  0.0
   *hg38 2013  40,088,619 12.4   39,159,777 10.9  154,893,029  2.4   26,415,043  2.9
 CHM13v2 2022  45,090,682 11.1   51,324,926 23.7  154,259,566 -0.4   62,460,029 57.7
As the human genome assembly matured from 2000 to 2022, the number of gaps in each chromosome initially dropped rapidly (from thousands to tens). In 2013 gaps increased slightly as more fine structure in the genome was discovered (e.g. a previous gap was filled in with gapped sequence).
HOW IS THE SIZE OF A GAP DETERMINED Precise size of certain gaps can be determined from information about distance between known sequences. When the size of the gap was not known, it was set to 100 bases following tradition. Other sizes, such as 1kb, 10kb and 50kb signalled more information about the nature of the gap, such as a contig gap, short arm gap, telomere gap, and so on.
The table below shows the number of gaps and their total size. As before, the last assembly in a given year is marked by *.
               gap_n   gap_size
assembly year ------ chr1 ----- ------ chr2 ----- ----- chr3 ------ ------ chr4 -----
     hg1 2000 34,616 30,489,476 38,379 31,527,834 84,260 30,313,573 32,913 29,049,049
     hg2 2000 34,492 54,563,791 36,285 43,413,879 55,821 46,275,304 28,840 38,331,234
     hg4 2000 21,036 41,143,057 24,754 36,101,572 35,994 41,066,838 17,851 35,305,214
     hg5 2000 22,497 72,211,367 24,769 32,401,809 36,836 41,698,828 19,250 34,730,408
    *hg6 2000 19,758 65,030,485 22,153 26,651,434 32,672 33,172,331 18,464 31,116,843
     hg7 2001 15,016 55,714,365 17,631 25,388,886 30,856 30,827,190 18,062 28,884,701
     hg8 2001 12,640 52,234,435 13,443 28,448,646 33,344 33,346,591 17,268 33,697,964
   *hg10 2001  4,941 28,748,886  5,803 14,877,744 15,626 20,316,754  7,923 19,059,649
    hg11 2002  3,245 24,489,948  2,010  8,536,007 11,060 17,241,853  3,248  9,196,379
    hg12 2002  2,258 25,992,617    999  4,573,714  7,601  5,417,726  1,794  4,457,625
   *hg13 2002  1,117 23,029,017    286  4,539,918  3,139  5,335,436  1,167  4,060,816
    hg15 2003    104 26,491,000     29  6,271,355     32  5,804,513     17  5,030,000
   *hg16 2003     65 24,565,000     30  6,074,355     12  4,870,274     17  4,890,000
   *hg17 2004     37 22,695,000     28  5,514,855     10  4,870,005     15  4,250,000
   *hg18 2006     39 22,250,000     25  5,241,355     10  4,797,005     14  3,976,000
   *hg19 2009     39 23,970,000     24  4,994,855      9  3,225,295     12  3,492,600
   *hg38 2013    168 18,475,410     35  1,645,301     29    195,424     18    461,888
 CHM13v2 2022      0          0      0          0      0          0      0          0
assembly year ------ chr5 ----- ------ chr6 ----- ----- chr7 ------ ------ chr8 -----
     hg1 2000 34,513 23,854,137 21,616 30,396,288 15,613 19,560,492 32,873 25,153,250
     hg2 2000 34,359 37,141,477 20,393 33,662,304 11,347 27,333,082 21,668 29,107,452
     hg4 2000 24,947 35,689,483 10,030 29,441,631  7,951 23,195,378 15,336 28,326,522
     hg5 2000 26,341 35,090,699  9,000 24,329,772  7,607 21,032,384 16,211 28,527,729
    *hg6 2000 23,369 31,341,535  5,793 22,664,501  6,455 18,655,717 13,587 22,822,038
     hg7 2001 19,815 30,327,389  4,053 17,654,602  4,713 16,785,730 12,045 20,156,303
     hg8 2001 19,187 29,103,247  3,276 15,233,714  5,076 15,679,731 10,899 26,912,672
   *hg10 2001  8,428 14,999,700    955  5,498,715  1,507  6,827,041 10,150 11,967,677
    hg11 2002  5,240  8,381,121  1,434  6,596,115    405  4,942,264  8,634  8,342,191
    hg12 2002  3,586  4,258,357     21  4,305,001     13  3,637,800 10,083  4,683,249
   *hg13 2002  1,308  4,124,045     16  3,905,001     13  3,637,800 12,833  3,990,968
    hg15 2003     17  3,442,323     13  3,860,001     12  3,885,000     17  4,214,401
   *hg16 2003     13  3,482,100     11  3,658,001     12  3,869,000     13  3,960,900
   *hg17 2004      7  3,155,100     11  3,658,001     12  3,869,000     10  3,662,000
   *hg18 2006      7  3,155,100     11  3,626,001     12  3,869,000     10  3,662,000
   *hg19 2009      7  3,220,000     11  3,720,001     17  3,785,000      9  3,475,100
   *hg38 2013     37    272,881     16    727,457     20    375,842     12    370,500
 CHM13v2 2022      0          0      0          0      0          0      0          0
assembly year ------ chr9 ----- ------ chr10----- ----- chr11------ ------ chr12-----
     hg1 2000 25,171 14,732,314 32,064 19,073,156 121.7k 17,165,137 63,425 17,941,551
     hg2 2000 25,115 21,450,767 32,131 22,379,421 21,177 25,077,447 33,437 26,735,971
     hg4 2000 13,875 14,743,038 18,569 17,194,557 15,052 21,488,532 22,972 20,761,832
     hg5 2000 12,363 35,367,417 20,421 18,905,774 14,539 22,191,715 22,107 19,855,773
    *hg6 2000 10,060 31,423,962 17,009 16,285,393 12,737 18,204,889 17,732 18,732,591
     hg7 2001 12,655 30,026,140 14,058 13,620,198 11,255 16,809,265 12,724 16,628,828
     hg8 2001 11,017 33,199,108  7,646 11,726,572  9,229 18,010,260  9,590 19,291,470
   *hg10 2001  7,882 17,868,638  2,293  9,339,871  6,248  7,605,834  5,013 10,068,038
    hg11 2002    886 16,342,266  1,562  6,297,316  5,592  6,811,051  4,133  9,469,427
    hg12 2002    880 17,200,547    420  3,693,785  3,140  7,417,357  4,169  5,143,889
   *hg13 2002    328 15,916,433    223  3,703,975  7,300  4,390,398  1,993  5,116,887
    hg15 2003     50 19,318,105     35  4,770,009     11  4,269,364     15  4,136,102
   *hg16 2003     49 20,748,003     31  3,864,009     10  3,574,100     13  2,252,102
   *hg17 2004     41 20,648,000     27  3,800,009      9  3,321,631     14  2,190,502
   *hg18 2006     38 20,130,000     26  3,750,009      9  3,321,631     13  2,046,502
   *hg19 2009     40 21,070,000     25  4,220,009      9  3,877,000     13  3,370,502
   *hg38 2013     46 16,604,167     80    534,460     17    552,880     30    137,493
 CHM13v2 2022      0          0      0          0      0          0      0          0
assembly year ------ chr13----- ------ chr14----- ----- chr15------ ------ chr16-----
     hg1 2000 22,350 12,581,994 11,292  5,951,248 22,036 10,756,252 33,927  9,641,803
     hg2 2000 21,859 16,427,024 10,389 11,172,142 20,436 17,463,304 31,479 19,997,227
     hg4 2000 10,373 11,559,689  4,084 10,153,243 13,887 13,424,263 31,575 19,282,293
     hg5 2000 10,800 26,813,954  3,010 20,629,120 11,631 28,030,988 36,487 32,922,367
    *hg6 2000  6,885 23,947,619  1,624 19,354,512  9,734 25,699,200 36,749 27,059,711
     hg7 2001  3,687 22,178,932  1,455 18,707,124  8,079 24,832,783 43,288 27,983,727
     hg8 2001  1,580 20,795,461  1,208 17,899,680  7,363 27,584,051 39,960 27,445,559
   *hg10 2001    304 18,067,447    365 18,008,690  5,346 21,862,800 18,525 17,071,880
    hg11 2002    117 17,608,619    194 17,456,551  5,750 20,453,173 15,980 15,505,131
    hg12 2002     12 18,240,103     92 17,161,294  5,689 19,572,525  2,975  4,062,421
   *hg13 2002      7 16,070,000    191 13,103,018 12,684 13,711,627    976 10,646,501
    hg15 2003      7 18,640,000      2 18,120,000     11 18,997,000     17 10,105,208
   *hg16 2003      6 17,483,000      2 18,120,000     11 18,997,000     15 10,109,503
   *hg17 2004      6 18,583,000      2 18,078,000     11 18,997,000      6  9,942,502
   *hg18 2006      6 18,583,000      2 18,078,000     11 18,997,000      6  9,942,502
   *hg19 2009      6 19,580,000      2 19,060,000     12 20,836,626      6 11,470,000
   *hg38 2013     23 16,381,203     25 16,475,569     19 17,349,864     22  8,532,402
 CHM13v2 2022      0          0      0          0      0          0      0          0
assembly year ------ chr17----- ------ chr18----- ----- chr19------ ------ chr20-----
     hg1 2000 20,451  8,372,294 71,970  9,356,951  7,675  7,830,890 11,919  7,629,675
     hg2 2000 21,778 16,924,590 12,853 18,463,986  8,615 20,861,435  7,973  8,378,942
     hg4 2000 17,520 15,918,208  9,136 13,345,396  4,740 18,369,268  3,070  8,565,162
     hg5 2000 19,692 17,294,301  9,443 14,235,257  5,889 19,839,960    983  6,446,777
    *hg6 2000 19,720 15,321,291  8,771 11,770,782  4,488 17,209,846    967  5,641,164
     hg7 2001 19,263 13,057,941  8,464 10,947,687  4,061 17,436,332      8  5,709,984
     hg8 2001 14,724 12,324,351  7,656 12,987,228  3,970 12,430,032      8  5,709,984
   *hg10 2001 12,387  7,091,707  7,810  7,448,235  1,012 18,563,646      9  3,809,988
    hg11 2002 10,024  5,522,111  7,435  6,426,323  1,002 16,673,579      6  3,455,826
    hg12 2002 17,806  4,334,167  6,678  4,483,433    979  3,862,568      7  3,420,000
   *hg13 2002 20,285  4,716,001  4,515  3,465,940    488  3,337,874      7  3,378,000
    hg15 2003     14  4,210,361      5  3,218,979      3  8,010,000      7  4,219,878
   *hg16 2003     13  4,182,522      5  1,461,098      5  8,026,000      8  4,316,878
   *hg17 2004     10    974,522      4  1,460,998      5  8,026,000      6  2,930,711
   *hg18 2006     10    974,522      4  1,460,998      5  8,026,000      6  2,930,711
   *hg19 2009      7  3,400,000     20  3,420,019      6  3,320,000      7  3,520,000
   *hg38 2013     48    337,237     61    283,680      9    176,858     90    499,910
 CHM13v2 2022      0          0      0          0      0          0      0          0
assembly year ------ chr20----- ------ chr21----- ----- chrX ------ ------ chrY -----
     hg1 2000 11,919  7,629,675    471  2,325,440 14,929 15,861,115  1,266  1,562,653
     hg2 2000  7,973  8,378,942    702  5,187,686 10,397 41,548,747  1,194  3,057,221
     hg4 2000  3,070  8,565,162     21  1,083,592  9,668 48,158,870    343  3,467,364
     hg5 2000    983  6,446,777     22 11,083,592  8,665 40,053,263    199 29,761,374
    *hg6 2000    967  5,641,164     22 11,083,592  7,381 34,143,310    146 30,506,644
     hg7 2001      8  5,709,984     22 11,083,592  4,577 26,265,292    161 29,208,759
     hg8 2001      8  5,709,984     22 11,083,592  2,988 22,414,982      7 28,200,000
   *hg10 2001      9  3,809,988     52 10,792,471  2,375 10,529,739      6 35,700,000
    hg11 2002      6  3,455,826     33 10,792,450  1,688  9,284,472      6 35,700,000
    hg12 2002      7  3,420,000     30 10,791,932  1,096  5,286,937      6 35,700,000
   *hg13 2002      7  3,378,000     28 10,791,912    926  4,330,290      6 27,700,000
    hg15 2003      7  4,219,878     15 13,051,795     37  4,947,502      7 28,200,000
   *hg16 2003      8  4,316,878     10 13,051,790     22  4,477,000      9 25,637,000
   *hg17 2004      6  2,930,711     11 12,774,217     20  4,430,000     14 32,830,000
   *hg18 2006      6  2,930,711     11 12,774,217     16  3,855,000     14 32,120,000
   *hg19 2009      7  3,520,000     17 13,023,253     23  4,170,000     18 33,720,000
   *hg38 2013     90    499,910     52  6,621,364     34  1,147,866     61 30,812,372
 CHM13v2 2022      0          0      0          0      0          0      0          0
The title of the Scientific American Graphic Science visualization is "3,117,275,501 bases, 0 gaps". This total is based on the length of chromosomes 1–22, X and Y in the CHM13v2 assembly and excludes chrM.
The table below shows how the number and size of gaps and sequence length in each chromosome's assembly changed from 2013 to 2022.
                          human genome assembly
     --------------------------------------------------------------
         CHM13v2                 hg38/GRCh38
         Mar 2022                  Dec 2013                         CHM13v2 new
     ---------------- --------------------------------------------- -----------
chr       seq     gap       seq     ------ gap ------       tot
  1   248,387,328   0   230,481,012   168  18,475,410   248,956,422  17,906,316
  2   242,696,752   0   240,548,228    35   1,645,301   242,193,529   2,148,524
  3   201,105,948   0   198,100,135    29     195,424   198,295,559   3,005,813
  4   193,574,945   0   189,752,667    18     461,888   190,214,555   3,822,278
  5   182,045,439   0   181,265,378    37     272,881   181,538,259     780,061
  6   172,126,628   0   170,078,522    16     727,457   170,805,979   2,048,106
  7   160,567,428   0   158,970,131    20     375,842   159,345,973   1,597,297
  8   146,259,331   0   144,768,136    12     370,500   145,138,636   1,491,195
  9   150,617,247   0   121,790,550    46  16,604,167   138,394,717  28,826,697
 10   134,758,134   0   133,262,962    80     534,460   133,797,422   1,495,172
 11   135,127,769   0   134,533,742    17     552,880   135,086,622     594,027
 12   133,324,548   0   133,137,816    30     137,493   133,275,309     186,732
 13   113,566,686   0    97,983,125    23  16,381,203   114,364,328  15,583,561
 14   101,161,492   0    90,568,149    25  16,475,569   107,043,718  10,593,343
 15    99,753,195   0    84,641,325    19  17,349,864   101,991,189  15,111,870
 16    96,330,374   0    81,805,943    22   8,532,402    90,338,345  14,524,431
 17    84,276,897   0    82,920,204    48     337,237    83,257,441   1,356,693
 18    80,542,538   0    80,089,605    61     283,680    80,373,285     452,933
 19    61,707,364   0    58,440,758     9     176,858    58,617,616   3,266,606
 20    66,210,255   0    63,944,257    90     499,910    64,444,167   2,265,998
 21    45,090,682   0    40,088,619    52   6,621,364    46,709,983   5,002,063
 22    51,324,926   0    39,159,777    49  11,658,691    50,818,468  12,165,149
  X   154,259,566   0   154,893,029    34   1,147,866   156,040,895    -633,463
  Y    62,460,029   0    26,415,043    61  30,812,372    57,227,415  36,044,986
    ------------- --- ------------- ----- ----------- ------------- -----------
    3,117,275,501   0 2,937,639,113 1,001 150,630,719 3,088,269,832 179,636,388

  M        16,569   0        16,568     1           1        16,569           1
    ============= === ============= ===== =========== ============= ===========
    3,117,292,070   0 2,937,655,681 1,002 150,630,720 3,088,286,401 179,636,389

 Un*                    111,660,102   240   9,339,602
                      ============= ===== =========== =============
                      3,049,315,783 1,242 159,970,322 3,209,286,105

*chrUn represents 430 unanchored, random and alternate haplotype contigs.
I did not include the mitochondrial chromosome in the total because the visualization does not show this chromosome — it's too tiny (16,569 bases) to show at the resolution used in the graphic (1,000,000 base bins). If we were to include chrM in the total, it would be 3,117,292,070 bases.
The total bases in the “CHM13v2 new” column reflects only the difference in the total assembly size (excluding gaps). As such, it's a rough accounting of new content in the CHM13v2 assembly. The actual number of unique content in CHM13v2 is closer to 213 million bases (CHM13 unique in comparison to GRCh38/hg38 and GRCh37/hg19).
Before the telomere-to-telomere assembly, the most recent assembly was hg38 (Dec 2013). This assembly had 430 contigs representing unanchored, random and alternate haplotype contigs. These totaled 111,660,102 bases with gaps of 9,339,602 bases. This extra content is part of the assembly, in addition to the chromosome assemblies.
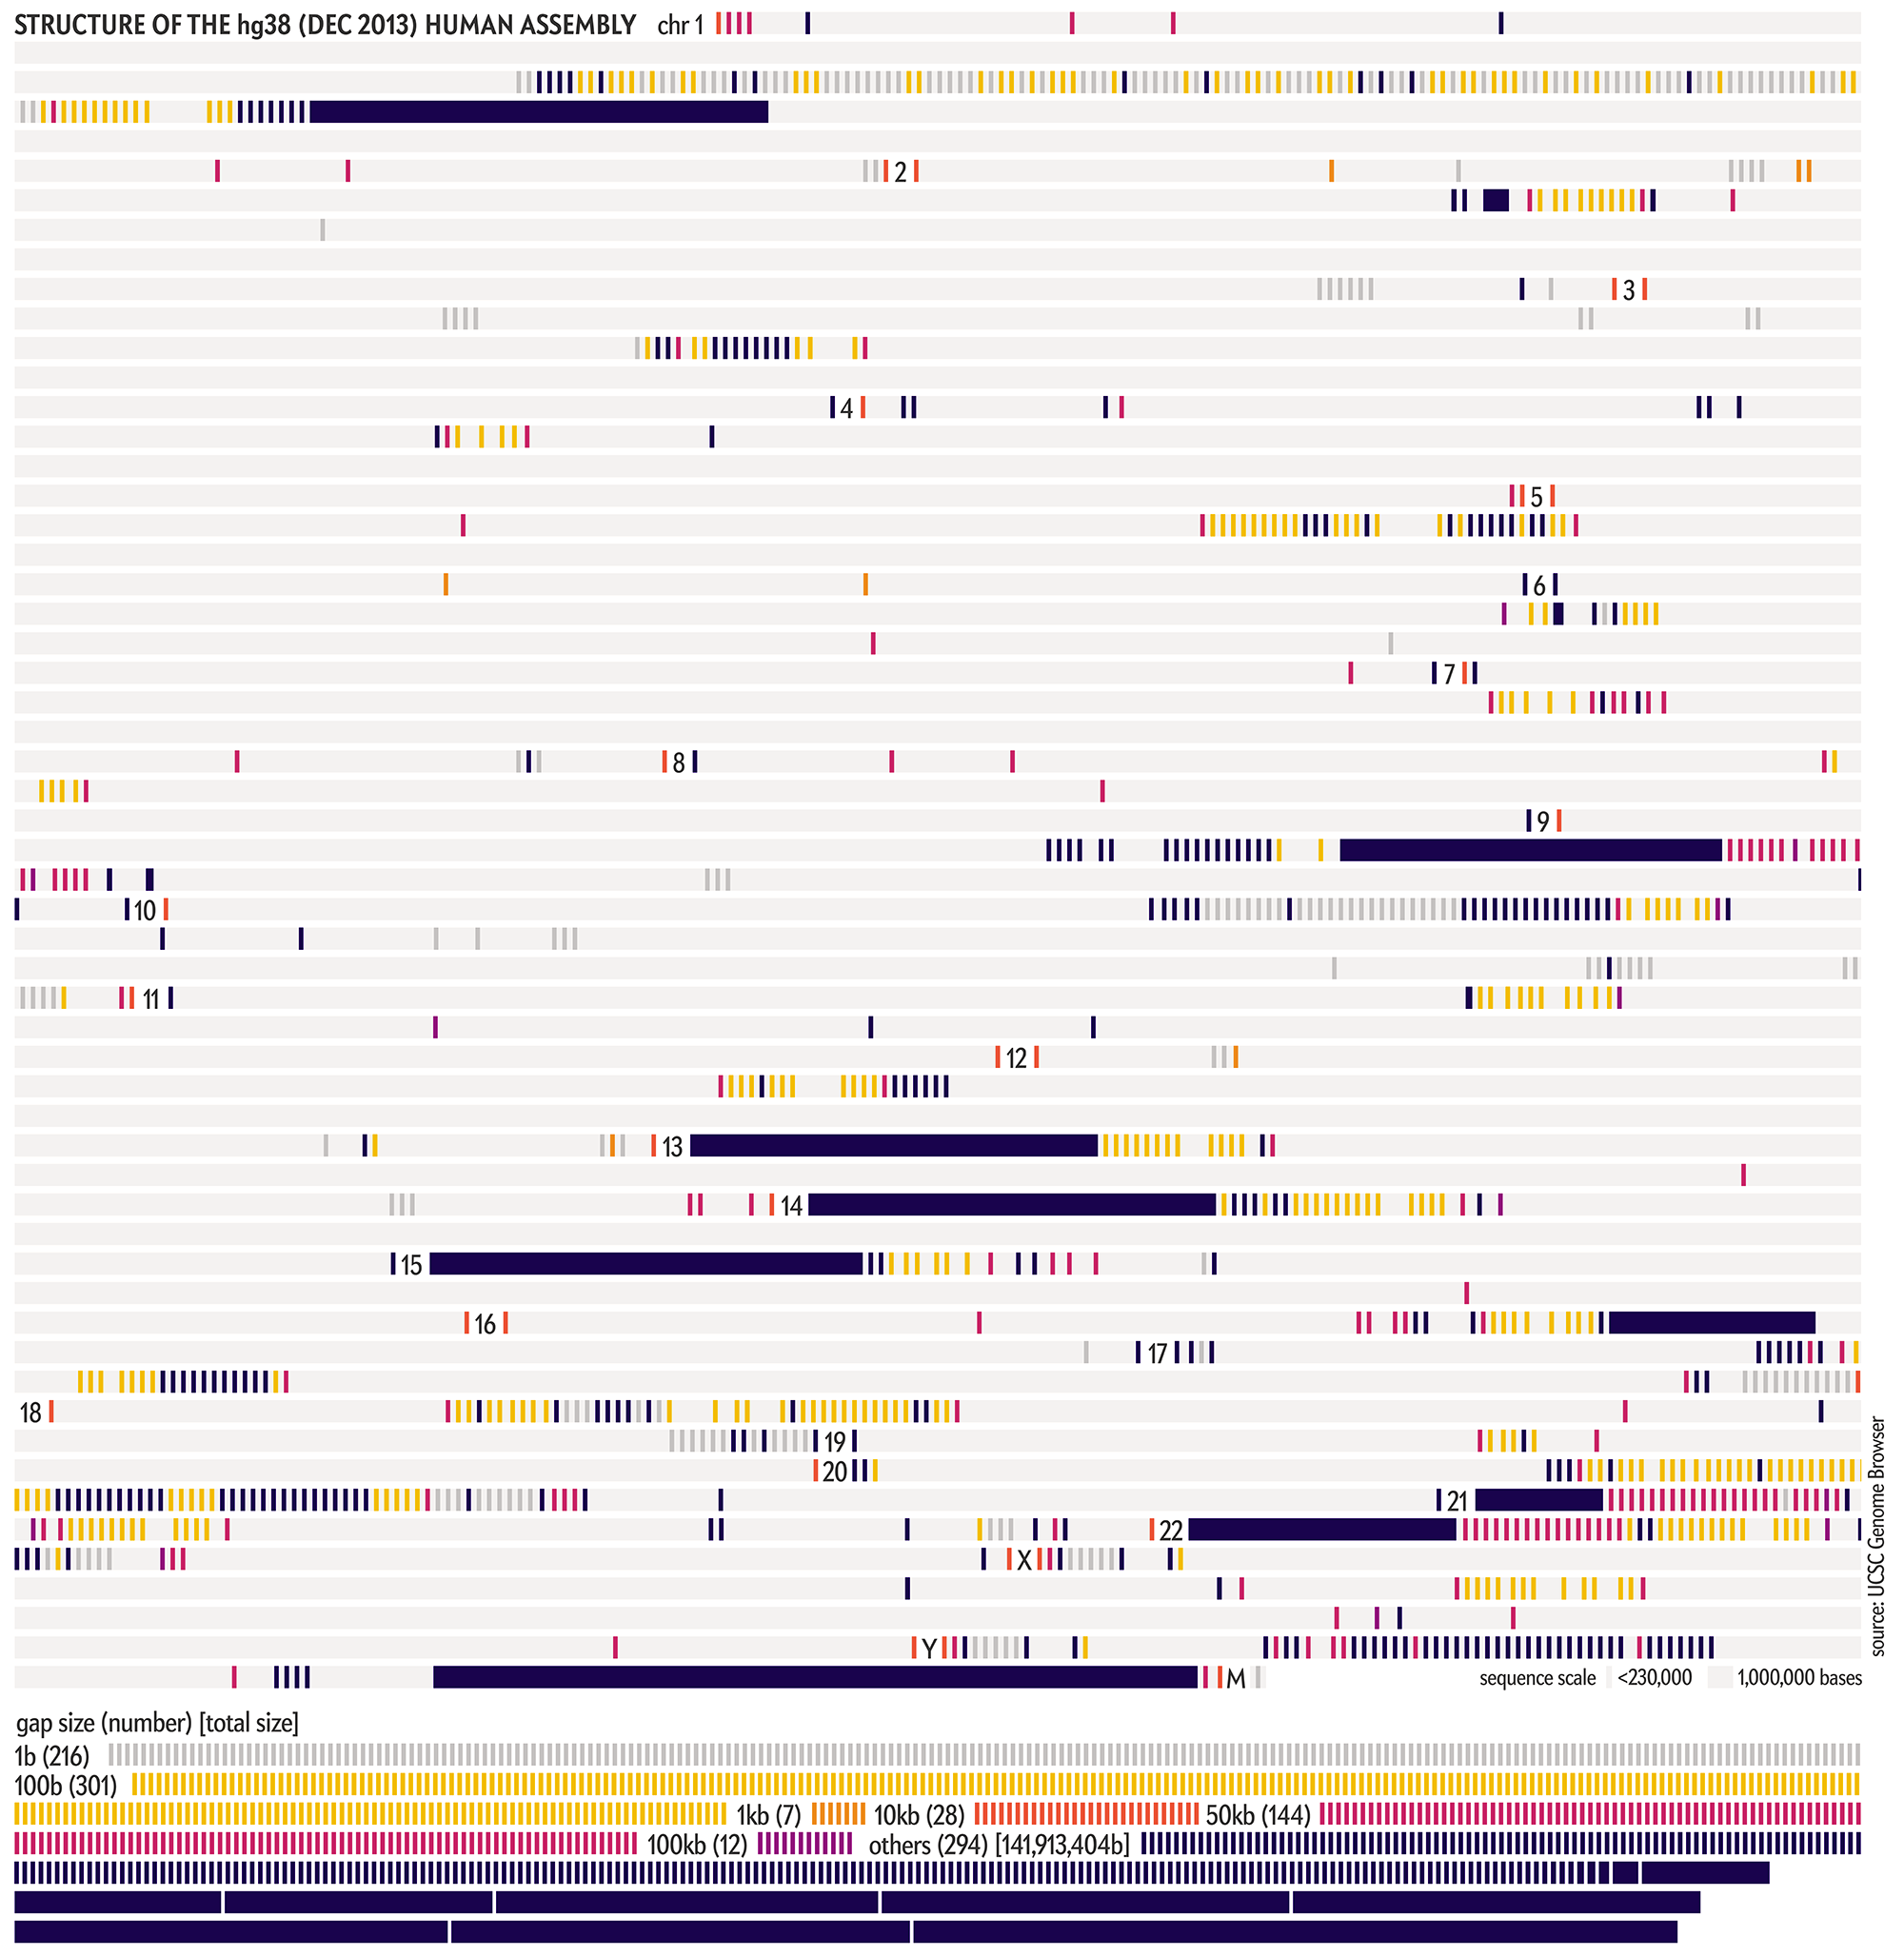
The graphic shows the sequencing history of each of the 22 numbered chromosomes and two sex chromosomes (X, Y) in the human genome. The chromosomes are shown and sized based on their length in the CHM13v2 assembly. Each chromosome is divided into regions of 1,000,000, whose color encodes the degree of completion (50, 90 or 99%+ complete) at the end of a year in which an assembly was available.
These completion cutoffs serve as reasonable milestones. We chose a 99% level of completion as a cutoff instead of 100% to accommodate the differences due to individual variation in the alignments between past assemblies and the CHM13v2 assembly.
WHY 99%? The previous hgN assemblies were constructed from DNA libraries from several individuals, while the CHM13v2 assembly is based on the CHM13hTERT cell line of a single female, with chromosome X sampled from a 51-year-old Harvard University biologist named Leonid Peshkin.
Thus, because we determine year-by-year completion of the assembly by aligning older assemblies to CHM13v2, we always expect a low-level background of differences (at the level of individual variation, which is about 1 base in 1,000), even within regions that are deemed finished. Using a 99% cutoff allows us to sidestep this complication.
Each available assembly from hg1 (May 2000) to hg38 (Dec 2013) (download hg assemblies) was aligned to the CHM13v2 (Mar 2022) assembly as follows.
For a given assembly (e.g. hg38), the assembled sequence of each chromosome was split into chunks of 250,000 bases. For example, splitting hg38 chromosome 1 this way gave 925 chunks (chr1-0000.fa to chr1-995.fa), discarding any chunks that were entirely composed of unknown bases (N's, i.e. the chunk fell in a gap), such as chr-0520.fa.
Each chunk was aligned to its homologous chromsome in the CHM13v2 assembly (e.g. chunks from hg38 chromosome 1 were aligned only to chromosome 1) using blat, a rapid sequence aligner, with the settings shown below and using over-occurring 12-mers via -ooc.
# alignment of hg38 chr1 to CHM13v2 chr1
blat chm13v2/chr1.2bit hg38/chr1.split.2bit -ooc=chm13/chr1.12.ooc
                                            -t=dna -q=dna
                                            -tileSize=12
                                            -minMatch=4 -minScore=100 -minIdentity=98
where hg38/chr1.2bit is the collection of all 250,000 base chunks from hg38 chromosome 1 in 2-bit format. The output of the alignment is in PSL format and provides the mapping between the query Q (e.g., hg38 chromosome 1) and target T (e.g. CHM13v2 chromosome 1).
For example, here's the alignment of chr1-0995.fa, which spans 45 blocks (i.e. the alignment is gapped with 45 closely-spaced individual alignments).
match	mis- 	rep. 	N's	Q gap	Q gap	T gap	T gap	strand	Q
     	match	match	   	count	bases	count	bases	      	name
196082	93	0	2	25	170	20	2922	+	chr1-0995

Q      Q     Q      T    T         T         T         block
size   start end    name size      start     end       count
206422 0     196347 chr1 248387328 248188227 248387326	45

blockSizes
300,2357,342,4216,13269,70,5142,27806,14859,36195,12552,11060,14049,19514,22919,2869,
6015,1282,36,16,562,32,59,14,62,26,6,24,6,6,29,30,17,18,5,47,87,66,12,118,6,6,5,61,5,

qStarts
0,300,2659,3004,7220,20495,20567,25709,53515,68375,104570,117136,128197,142246,161760,
184685,187647,193663,194945,194981,194997,195571,195610,195674,195688,195750,195777,
195784,195809,195816,195823,195852,195883,195900,195919,195924,195971,196058,196124,
196136,196256,196264,196272,196279,196342,

tStarts
248188227,248188529,248190886,248191228,248195446,248208715,248208785,248213988,
248241999,248256858,248293081,248305633,248316693,248330746,248350387,248373306,
248376175,248382190,248383473,248383514,248383569,248384131,248384163,248384252,
248386503,248386566,248386592,248386598,248386622,248386628,248386634,248386664,
248386694,248386712,248386730,248386736,248386838,248386971,248387042,248387125,
248387243,248387249,248387255,248387260,248387321,
Chunks that did not align or for alignments that did not complete were redone with slightly looser settings -tileSize=11 -minMatch=2 -minScore=50 -minIdentity=95.
Finally, for any alignments that were still missing or did not complete the process was repeated by chunking the 250,000 base regions into 5,000 base regions and aligning these with the tighter alignment settings shown above (-tileSize=12 ...) but without using over-occurring 12-mers.
For each chunk, alignments were processed as follows.
First, for each alignment a list of intervals on the query and target was created. Second, a running union of target intervals was initialized to the null set. Third, iterating over alignments in decreasing order of total match length (longer alignments first), any alignment whose query interval did not overlap a previously accepted alignment for this region had its target intervals added to the running union.
Once all alignments for a chromosome were processed this way (e.g. hg38 chr1 vs CHM13v2 chr1), the coverage by alignment target intervals for each 50,000 base region of the target chromosome (e.g. CHM13v2 chr1) was calculated. For example, here is the coverage by hg38 on the first several 50,000 regions of CHM13v2 chr1. The last two columns are the key quantities: total bases (e.g. 44,889 bases) in this region that aligned and the fraction of the region (44,889 / 50,000 = 0.89778) that this represents.
hg38 chr1 248387328 0 49999 50000 44889 0.89778
hg38 chr1 248387328 50000 99999 50000 44741 0.89482
hg38 chr1 248387328 100000 149999 50000 49657 0.99314
hg38 chr1 248387328 150000 199999 50000 50000 1
hg38 chr1 248387328 200000 249999 50000 47517 0.95034
hg38 chr1 248387328 250000 299999 50000 49989 0.99978
hg38 chr1 248387328 300000 349999 50000 48838 0.97676
hg38 chr1 248387328 350000 399999 50000 49928 0.99856
...
Once the coverage of each 50,000 base region of the CHM13v2 assembly by all past assemblies were calculated in this way, the first year in which the region reached 50%, 90% and 99%+ was identified. For example, for the region 100,000,000–100,999,999 on chromosome 1, we have 50% completion in 2000, 90% in 2001 and 99%+ in 2002.
year 2000 hg 6 chr 1 100 100000000 100999999 0 0.5 +
year 2001 hg 10 chr 1 100 100000000 100999999 0.5 0.90 +
year 2002 hg 13 chr 1 100 100000000 100999999 0.90 0.99 +
year 2003 hg 16 chr 1 100 100000000 100999999 0.99 0.99 2002
year 2004 hg 17 chr 1 100 100000000 100999999 0.99 0.99 2002
year 2006 hg 18 chr 1 100 100000000 100999999 0.99 0.99 2002
year 2009 hg 19 chr 1 100 100000000 100999999 0.99 0.99 2002
year 2013 hg 38 chr 1 100 100000000 100999999 0.99 0.99 2002
year 2022 hg 99 chr 1 100 100000000 100999999 0.99 0.99 2002
but for the region 246,000,000–246,999,999, there was no coverage in 2000, 50% in 2001, reaching 90% in 2003 and finally 99%+ only in 2022.
year 2000 hg 6 chr 1 246 246000000 246999999 0 0
year 2001 hg 10 chr 1 246 246000000 246999999 0 0.5 +
year 2002 hg 13 chr 1 246 246000000 246999999 0.5 0.5 2001
year 2003 hg 16 chr 1 246 246000000 246999999 0.5 0.90 +
year 2004 hg 17 chr 1 246 246000000 246999999 0.90 0.90 2003
year 2006 hg 18 chr 1 246 246000000 246999999 0.90 0.90 2003
year 2009 hg 19 chr 1 246 246000000 246999999 0.90 0.90 2003
year 2013 hg 38 chr 1 246 246000000 246999999 0.90 0.90 2003
year 2022 hg 99 chr 1 246 246000000 246999999 0.90 0.99 +
The exact fraction of 50%, 90% and 99%+ alignment coverage is a function of the size of the window over which coverage is determined (I use 50,000 bases).
You can download the full human genome assembly history file here.
In this table I show the fraction of the assembly that was added to a given level of completion for each year. For example, the hg38 (Dec 2013) assembly added 58,387,328 bases to 99%+ completed regions.
                         level of completion relative to CHM13v2
     -------------------------------------------------------------------------------
                                   50%                 90%                 99%+
                         ------------------- ------------------- -------------------
year                          seq        %        seq        %        seq        %
----                     ------------- ----- ------------- ----- ------------- -----
2000                     1,877,491,287 60.23   532,577,100 17.08   250,000,000  8.02
2001                       104,027,534  3.34   494,259,566 15.86   645,000,000 20.69
2002                        32,031,701  1.03   290,698,294  9.33 1,213,000,000 38.91
2003                        13,460,029  0.43    62,635,144  2.01   347,000,000 11.13
2004                         3,000,000  0.10    17,000,000  0.55    46,000,000  1.48
2006                         3,000,000  0.10     9,084,080  0.29    10,000,000  0.32
2009                         1,276,897  0.04     6,324,548  0.20    33,707,364  1.08
2013                        23,000,000  0.74    12,460,830  0.40    58,387,328  1.87
2022                                                               514,180,809 16.49
To correctly interpret this table (and the one below), it's important that you understand how the level of completion of each assembly was determined.
In this table I show the fraction of each assembly that had a given level of completion . For example, the hg38 (Dec 2013) assembly had 2,569,094,692 bases in 99%+ regions, which represented about 82% of the CHM13v2 assembly length.
                        level of completion relative to CHM13v2
     -------------------------------------------------------------------------------
              0%                   50%                 90%                 99%+
     ------------------- ------------------- ------------------- -------------------
year      seq         %       seq        %        seq        %        seq        %
---- ------------- ----- ------------- ----- ------------- ----- ------------- -----
2000   457,207,114 14.67 1,877,491,287 60.23   532,577,100 17.08   250,000,000  8.02
2001   358,920,014 11.51 1,157,518,821 37.13   731,836,666 23.48   869,000,000 27.88
2002   276,888,313  8.88   250,852,228  8.05   499,534,960 16.02 2,090,000,000 67.05
2003   261,382,845  8.38   124,722,552  4.00   298,170,104  9.57 2,433,000,000 78.05
2004   259,382,845  8.32   101,722,552  3.26   282,170,104  9.05 2,474,000,000 79.36
2006   255,382,845  8.19    95,638,472  3.07   279,254,184  8.96 2,487,000,000 79.78
2009   254,105,948  8.15    94,590,821  3.03   249,871,368  8.02 2,518,707,364 80.80
2013   230,105,948  7.38    96,129,991  3.08   221,944,870  7.12 2,569,094,692 82.41
2022                                                             3,117,275,501 100.0
 buy artwork

All the images here are available as posters.
The final graphic had the genome divided into 1,000,000 base regions. At this resolution, each region is about 0.6 pt wide, which is a reasonable balance of detail and legibility.

There's a lot going on in this graphic. Below, I show only the regions that flipped to a specific completion level in a year.


More detailed profiles are possible — here I show the graphic using 250,000 base regions — their detail is hard to discern on the printed page.

Less detailed profiles provide a good overview — here I show the graphic using 5,000,000 base regions.

While the final graphic shows a snapshot of the genome for each year in which an assembly was available, it's possible to look at the timeline of all the assemblies from hg1 (May 2000) to hg38 (Dec 2013) (assembly release dates). For example, here is a detailed look at progress of completion of chromosome 1 in regions of 1,000,000 bases, with blue indicating 99%+ completion.

And now drawing all the chromosomes,

One of the earlier designs for the graphic had the entire genome shown at a higher resolution (50,000 bases per region) with color encoding the assembly in which the region first reached 99%+ completion.
Though it showed promise and definitely showed more data, we thought that this graphic, ultimately, answered fewer interesting questions. But it does make for a pretty poster.
For example, only one level of completion is possible to encode (unless we use textures — yuck) and it's not easy to quickly tell how much activity occurred in any given year. It's also hard to quickly find the start and end of chromosomes.

And here is a take of the assembly at a glance graphic at lower resolution, using 250,000 base regions.
Nasa to send our human genome discs to the Moon
We'd like to say a ‘cosmic hello’: mathematics, culture, palaeontology, art and science, and ... human genomes.


Comparing classifier performance with baselines
All animals are equal, but some animals are more equal than others. —George Orwell
This month, we will illustrate the importance of establishing a baseline performance level.
Baselines are typically generated independently for each dataset using very simple models. Their role is to set the minimum level of acceptable performance and help with comparing relative improvements in performance of other models.

Unfortunately, baselines are often overlooked and, in the presence of a class imbalance5, must be established with care.
Megahed, F.M, Chen, Y-J., Jones-Farmer, A., Rigdon, S.E., Krzywinski, M. & Altman, N. (2024) Points of significance: Comparing classifier performance with baselines. Nat. Methods 20.
Happy 2024 π Day—
sunflowers ho!
Celebrate π Day (March 14th) and dig into the digit garden. Let's grow something.

How Analyzing Cosmic Nothing Might Explain Everything
Huge empty areas of the universe called voids could help solve the greatest mysteries in the cosmos.
My graphic accompanying How Analyzing Cosmic Nothing Might Explain Everything in the January 2024 issue of Scientific American depicts the entire Universe in a two-page spread — full of nothing.

The graphic uses the latest data from SDSS 12 and is an update to my Superclusters and Voids poster.
Michael Lemonick (editor) explains on the graphic:
“Regions of relatively empty space called cosmic voids are everywhere in the universe, and scientists believe studying their size, shape and spread across the cosmos could help them understand dark matter, dark energy and other big mysteries.
To use voids in this way, astronomers must map these regions in detail—a project that is just beginning.
Shown here are voids discovered by the Sloan Digital Sky Survey (SDSS), along with a selection of 16 previously named voids. Scientists expect voids to be evenly distributed throughout space—the lack of voids in some regions on the globe simply reflects SDSS’s sky coverage.”
voids
Sofia Contarini, Alice Pisani, Nico Hamaus, Federico Marulli Lauro Moscardini & Marco Baldi (2023) Cosmological Constraints from the BOSS DR12 Void Size Function Astrophysical Journal 953:46.
Nico Hamaus, Alice Pisani, Jin-Ah Choi, Guilhem Lavaux, Benjamin D. Wandelt & Jochen Weller (2020) Journal of Cosmology and Astroparticle Physics 2020:023.
Sloan Digital Sky Survey Data Release 12
Alan MacRobert (Sky & Telescope), Paulina Rowicka/Martin Krzywinski (revisions & Microscopium)
Hoffleit & Warren Jr. (1991) The Bright Star Catalog, 5th Revised Edition (Preliminary Version).
H0 = 67.4 km/(Mpc·s), Ωm = 0.315, Ωv = 0.685. Planck collaboration Planck 2018 results. VI. Cosmological parameters (2018).
constellation figures
stars
cosmology
Error in predictor variables
It is the mark of an educated mind to rest satisfied with the degree of precision that the nature of the subject admits and not to seek exactness where only an approximation is possible. —Aristotle
In regression, the predictors are (typically) assumed to have known values that are measured without error.
Practically, however, predictors are often measured with error. This has a profound (but predictable) effect on the estimates of relationships among variables – the so-called “error in variables” problem.

Error in measuring the predictors is often ignored. In this column, we discuss when ignoring this error is harmless and when it can lead to large bias that can leads us to miss important effects.
Altman, N. & Krzywinski, M. (2024) Points of significance: Error in predictor variables. Nat. Methods 20.
Background reading
Altman, N. & Krzywinski, M. (2015) Points of significance: Simple linear regression. Nat. Methods 12:999–1000.
Lever, J., Krzywinski, M. & Altman, N. (2016) Points of significance: Logistic regression. Nat. Methods 13:541–542 (2016).
Das, K., Krzywinski, M. & Altman, N. (2019) Points of significance: Quantile regression. Nat. Methods 16:451–452.