statistics
+ data
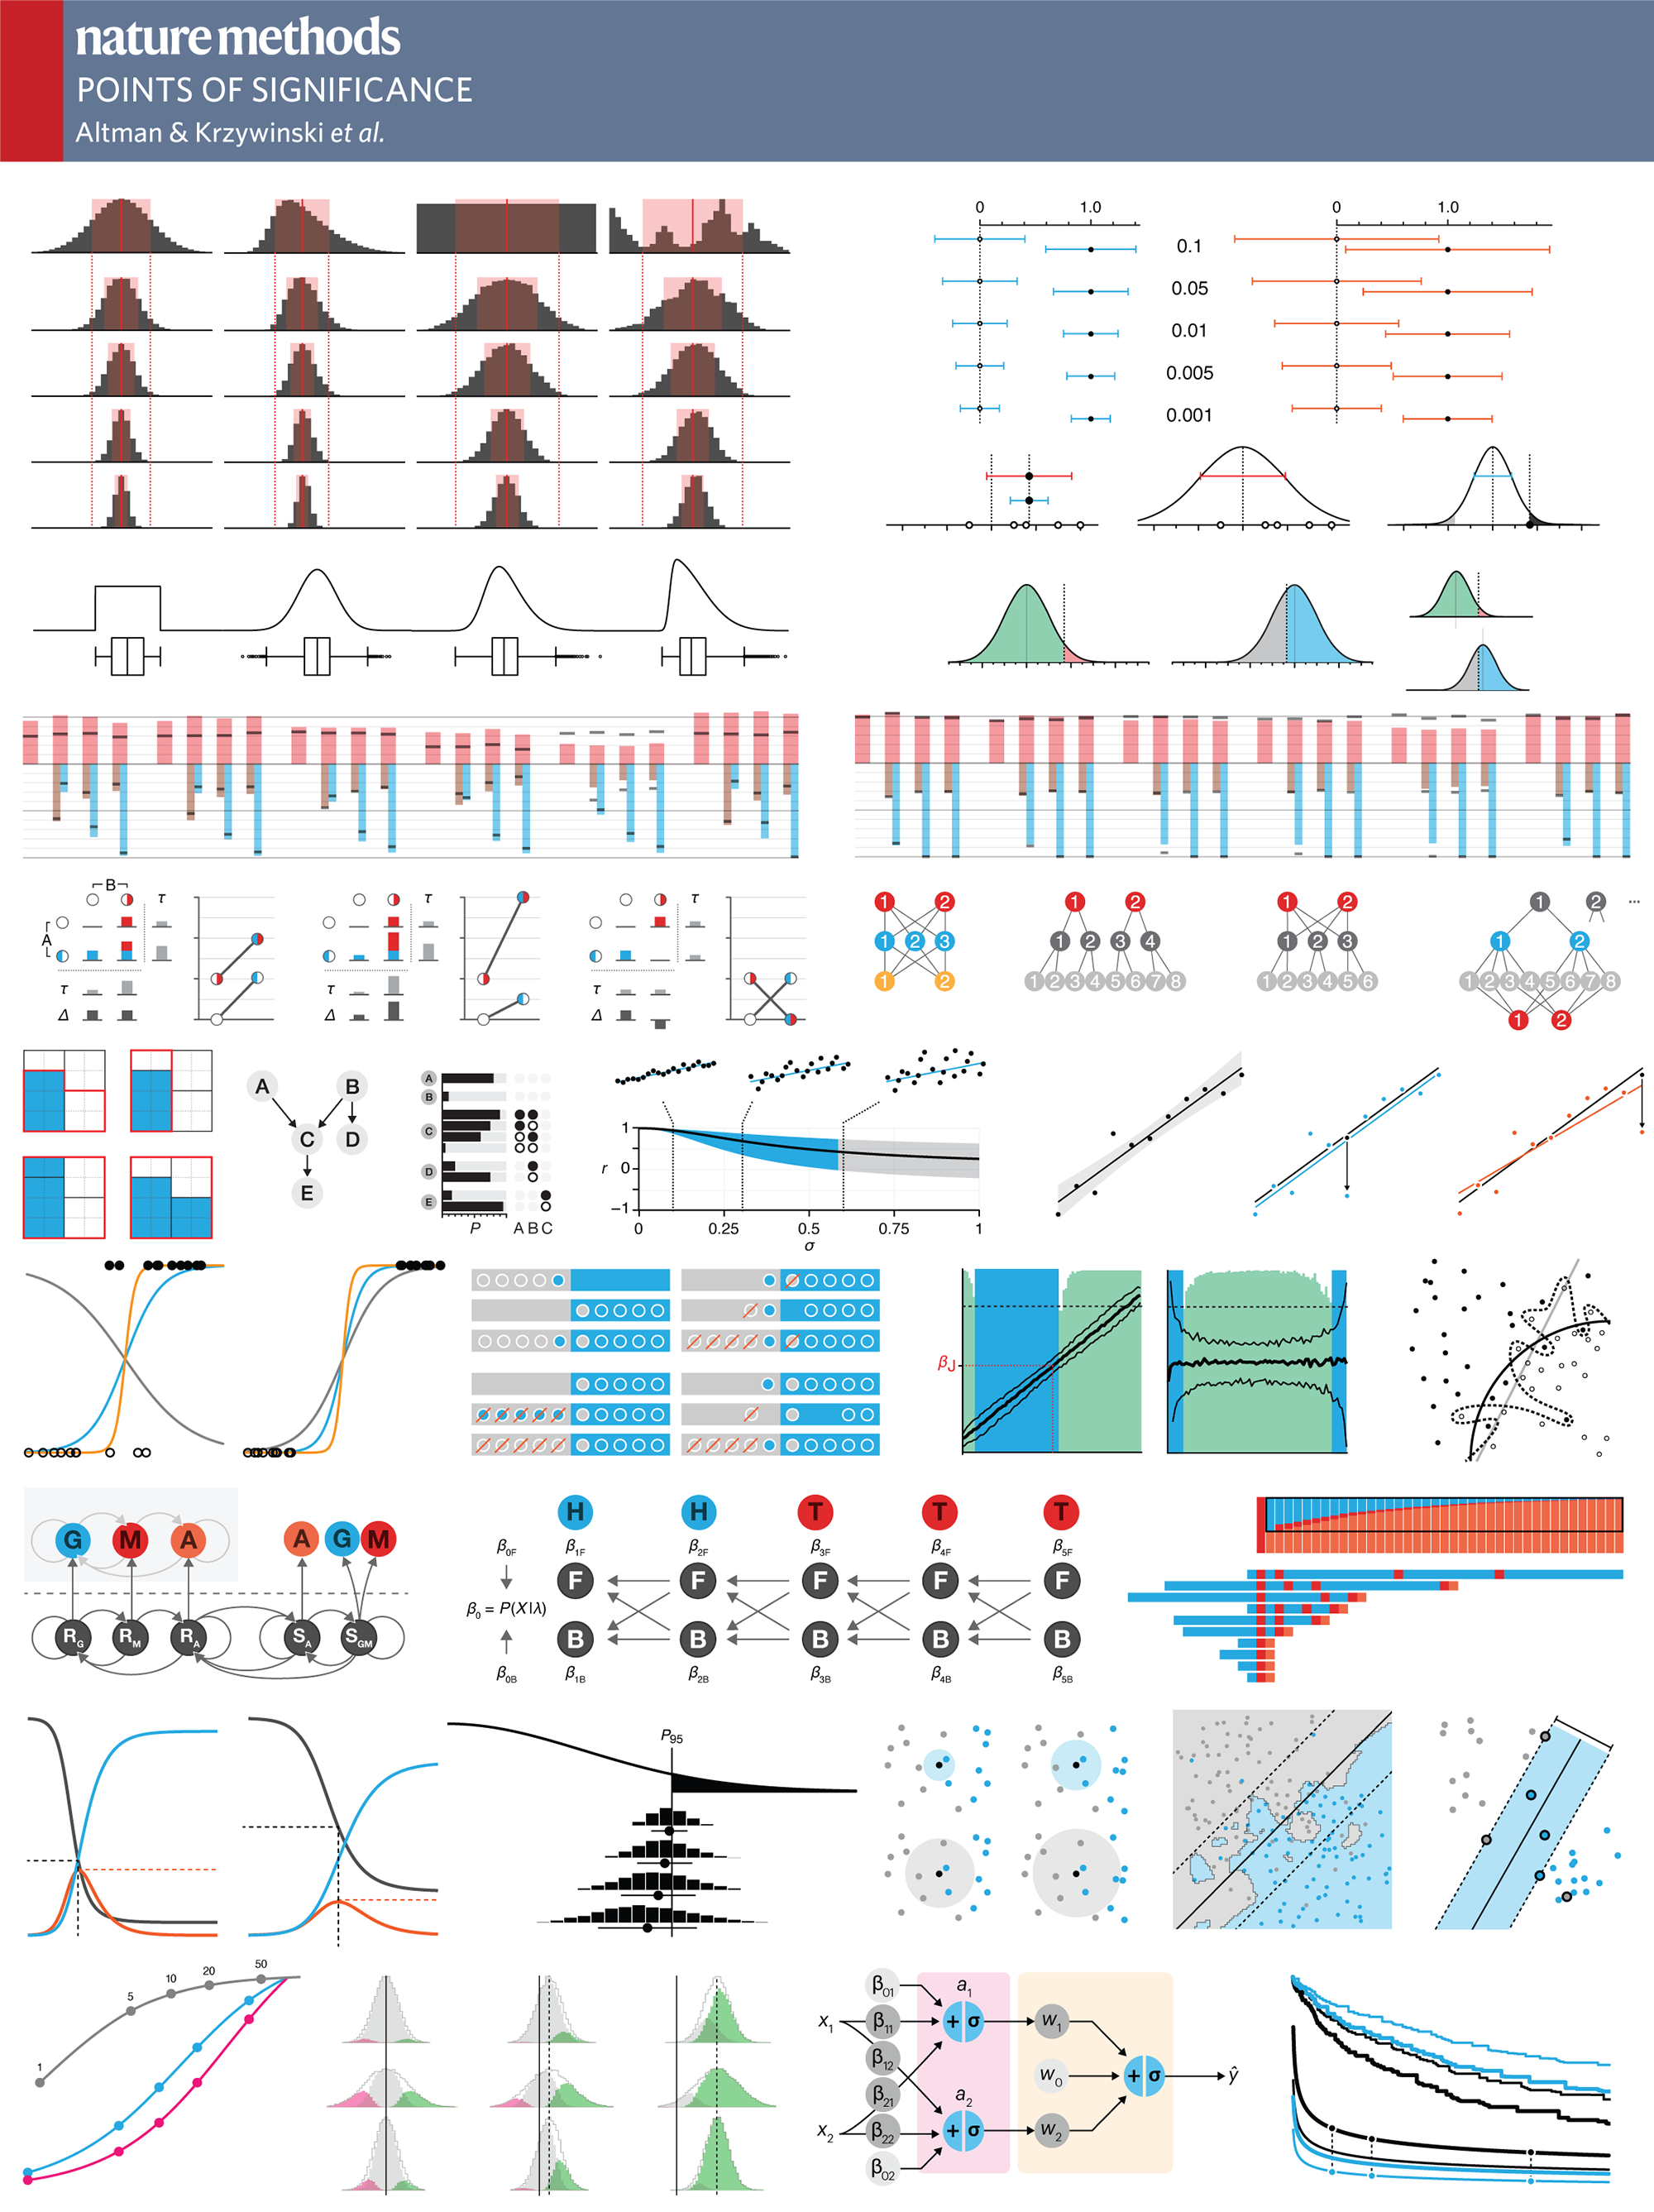
Nature Methods: Points of Significance
Generated on 13-May-2024 (7 days ago).
Metrics are provided by Altmetric.
Access values larger than 10,000 are rounded off to nearest 1,000 by Altmetric.
| article |
accesses |
daily |
%nm |
%all |
cit (ws) |
cit (cross) |
altmetric |
| Significance, P values and t-tests |
223,000 |
58 |
91
|
98
|
95 |
94 |
94 |
| Error bars |
208,000 |
54 |
98
|
99
|
163 |
178 |
187 |
| Visualizing samples with box plots |
198,000 |
53 |
86
|
98
|
343 |
367 |
82 |
| Principal component analysis |
193,000 |
77 |
86
|
96
|
463 |
763 |
80 |
| Association, correlation and causation |
172,000 |
55 |
97
|
99
|
157 |
186 |
183 |
| P values and the search for significance |
133,000 |
49 |
94
|
98
|
56 |
68 |
156 |
| Replication |
129,000 |
36 |
60
|
93
|
100 |
92 |
26 |
| Statistics versus machine learning |
123,000 |
55 |
97
|
99
|
202 |
787 |
351 |
| Importance of being uncertain |
117,000 |
30 |
80
|
96
|
52 |
56 |
52 |
| Power and sample size |
107,000 |
28 |
79
|
97
|
113 |
129 |
56 |
| Nonparametric tests |
64,000 |
17 |
56
|
88
|
49 |
54 |
13 |
| Comparing samples—part I |
63,000 |
17 |
68
|
92
|
25 |
33 |
21 |
| Analysis of variance and blocking |
60,000 |
17 |
62
|
92
|
41 |
48 |
19 |
| Nested designs |
59,000 |
17 |
86
|
97
|
40 |
38 |
56 |
| Bayes' theorem |
58,000 |
17 |
73
|
95
|
54 |
56 |
38 |
| Two-factor designs |
57,000 |
16 |
34
|
51
|
20 |
27 |
3 |
| Comparing samples—part II |
53,000 |
14 |
47
|
87
|
48 |
51 |
12 |
| Sources of variation |
52,000 |
15 |
57
|
92
|
15 |
18 |
17 |
| Simple linear regression |
51,000 |
16 |
76
|
93
|
63 |
81 |
29 |
| Split plot design |
51,000 |
15 |
40
|
78
|
42 |
46 |
7 |
| The SEIRS model for infectious disease dynamics |
48,000 |
33 |
98
|
99
|
72 |
102 |
358 |
| Bayesian statistics |
48,000 |
15 |
57
|
90
|
16 |
17 |
17 |
| Designing comparative experiments |
48,000 |
13 |
52
|
83
|
11 |
14 |
9 |
| Interpreting P values |
46,000 |
17 |
75
|
95
|
35 |
51 |
60 |
| Sampling distributions and the bootstrap |
46,000 |
14 |
54
|
91
|
61 |
75 |
18 |
| Multiple linear regression |
44,000 |
14 |
81
|
95
|
62 |
79 |
43 |
| Classification and regression trees |
40,000 |
16 |
46
|
80
|
122 |
185 |
10 |
| Classification evaluation |
38,000 |
13 |
70
|
95
|
171 |
223 |
45 |
| Model selection and overfitting |
36,000 |
13 |
66
|
92
|
309 |
358 |
27 |
| Bayesian networks |
35,000 |
11 |
45
|
77
|
29 |
26 |
7 |
| Clustering |
32,000 |
13 |
50
|
89
|
64 |
87 |
20 |
| Optimal experimental design |
25,000 |
12 |
50
|
89
|
43 |
53 |
21 |
| Analyzing outliers: influential or nuisance? |
25,000 |
8 |
35
|
68
|
51 |
56 |
5 |
| Machine learning: supervised methods |
22,000 |
9 |
56
|
92
|
128 |
181 |
24 |
| Logistic regression |
21,000 |
7 |
68
|
92
|
62 |
70 |
25 |
| Regression diagnostics |
21,000 |
7 |
46
|
72
|
37 |
47 |
6 |
| Ensemble methods: bagging and random forests |
18,000 |
7 |
37
|
79
|
96 |
135 |
9 |
| Modeling infectious epidemics |
17,000 |
11 |
85
|
97
|
45 |
64 |
111 |
| The curse(s) of dimensionality |
17,000 |
8 |
58
|
89
|
145 |
192 |
21 |
| Machine learning: a primer |
16,000 |
7 |
89
|
97
|
63 |
91 |
80 |
| Tabular data |
13,000 |
5 |
28
|
64
|
2 |
2 |
4 |
| Regularization |
12,000 |
4 |
54
|
87
|
28 |
26 |
14 |
| Two-level factorial experiments |
10,000 |
5 |
12
|
24
|
10 |
10 |
1 |
| Predicting with confidence and tolerance |
7,723 |
4 |
34
|
69
|
3 |
5 |
6 |
| Markov models—Markov chains |
7,249 |
4 |
40
|
90
|
12 |
16 |
23 |
| Markov models — hidden Markov models |
5,804 |
3 |
25
|
79
|
16 |
20 |
9 |
| The standardization fallacy |
4,860 |
4 |
47
|
93
|
24 |
25 |
32 |
| Convolutional neural networks |
4,752 |
17 |
17
|
72
|
0 |
5 |
6 |
| Quantile regression |
4,049 |
2 |
36
|
78
|
14 |
55 |
9 |
| Markov models — training and evaluation of hidden Markov models |
4,016 |
3 |
41
|
85
|
5 |
4 |
12 |
| The class imbalance problem |
3,665 |
4 |
20
|
75
|
17 |
32 |
7 |
| Analyzing outliers: robust methods to the rescue |
3,441 |
2 |
25
|
50
|
16 |
18 |
3 |
| Uncertainty and the management of epidemics |
3,423 |
3 |
21
|
70
|
5 |
9 |
7 |
| Survival analysis—time-to-event data and censoring |
3,322 |
5 |
17
|
68
|
2 |
6 |
4 |
| Neural networks primer |
2,957 |
6 |
19
|
69
|
1 |
2 |
4 |
| Graphical assessment of tests and classifiers |
2,152 |
2 |
28
|
83
|
4 |
4 |
11 |
| Regression modeling of time-to-event data with censoring |
1,857 |
3 |
11
|
71
|
1 |
2 |
5 |
| Testing for rare conditions |
1,492 |
1 |
15
|
60
|
2 |
2 |
4 |
| Comparing classifier performance with baselines |
1,220 |
23 |
27
|
77
|
0 |
0 |
7 |
| Errors in predictor variables |
1,089 |
8 |
1
|
19
|
0 |
0 |
1 |
|
2,912,071 |
1,012 |
53 |
83 |
3,925 |
5,521 |
%NM percentile rank (avg 53) for the article of tracked articles of a similar age in Nature Methods.
%ALL percentile rank (avg 83) for the article of tracked articles of a similar age in all journals.
Total accesses 2,912,071.
Total citations 5,538 = sum(maxi(webscience,crossref)).
news
+ thoughts
Sat 23-03-2024
We'd like to say a âcosmic helloâ: mathematics, culture, palaeontology, art and science, and ... human genomes.

▲ SANCTUARY PROJECT | A cosmic hello of art, science, and genomes.
(
details)

▲ SANCTUARY PROJECT | Benoit Faiveley, founder of the Sanctuary project gives the Sanctuary disc a visual check at CEA LeQ Grenoble (image: Vincent Thomas).
(
details)

▲ SANCTUARY PROJECT | Sanctuary team examines the Life disc at INRIA Paris Saclay (image: Benedict Redgrove)
(
details)
Sat 23-03-2024
All animals are equal, but some animals are more equal than others. âGeorge Orwell
This month, we will illustrate the importance of establishing a baseline performance level.
Baselines are typically generated independently for each dataset using very simple models. Their role is to set the minimum level of acceptable performance and help with comparing relative improvements in performance of other models.

▲ Nature Methods Points of Significance column: Comparing classifier performance with baselines.
(
read)
Unfortunately, baselines are often overlooked and, in the presence of a class imbalance5, must be established with care.
Megahed, F.M, Chen, Y-J., Jones-Farmer, A., Rigdon, S.E., Krzywinski, M. & Altman, N. (2024) Points of significance: Comparing classifier performance with baselines. Nat. Methods 20.
Sat 09-03-2024
Celebrate Ï Day (March 14th) and dig into the digit garden. Let's grow something.

▲ 2024 Ï DAY | A garden of 1,000 digits of Ï.
(
details)
Thu 18-01-2024
Huge empty areas of the universe called voids could help solve the greatest mysteries in the cosmos.
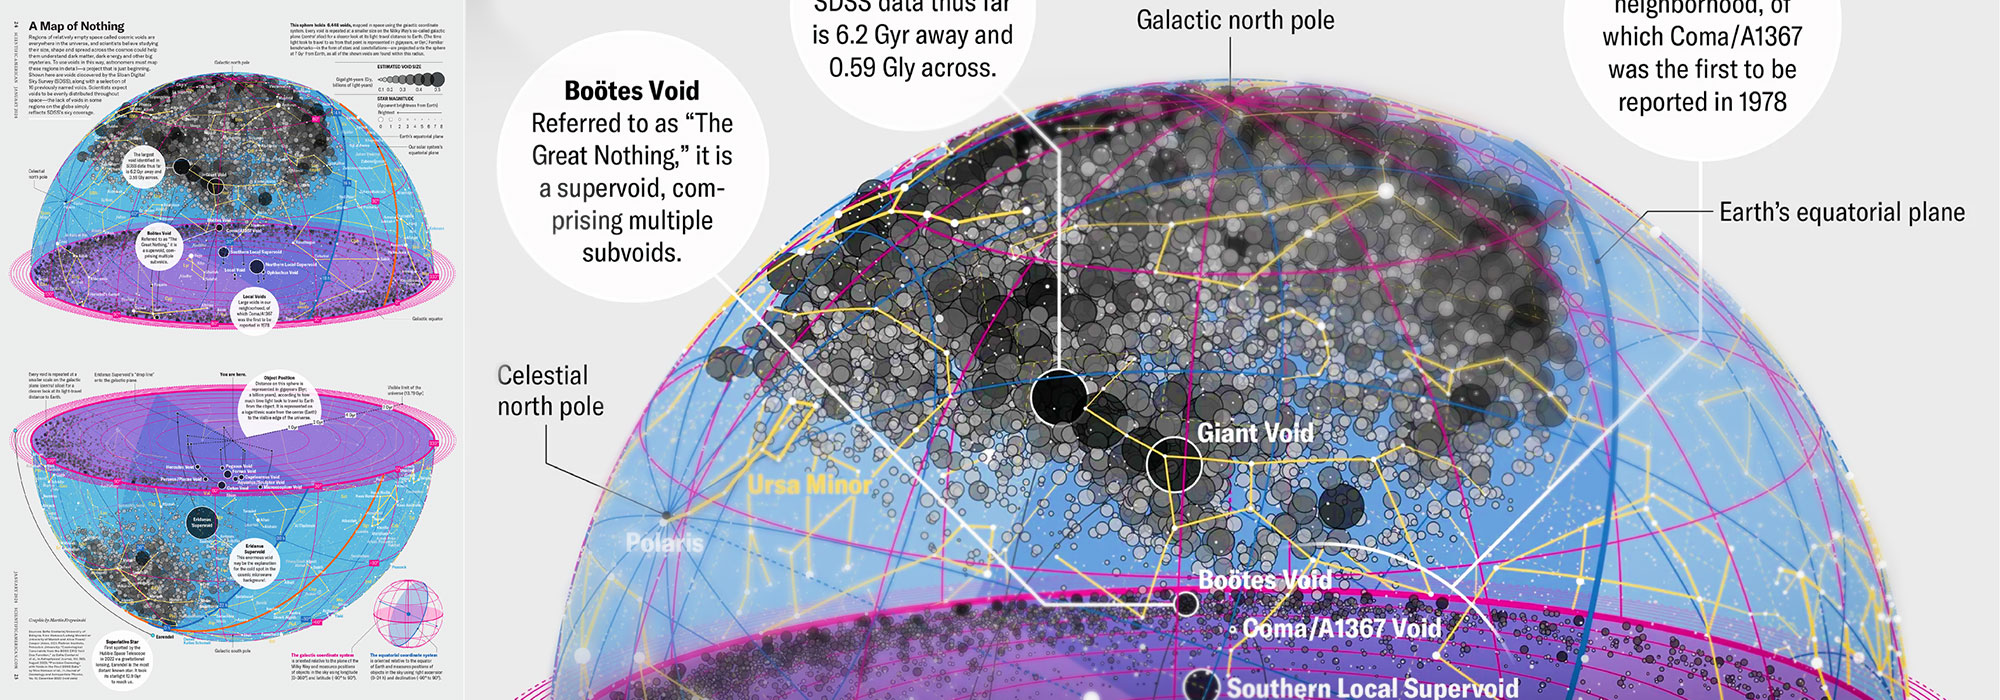
My graphic accompanying How Analyzing Cosmic Nothing Might Explain Everything in the January 2024 issue of Scientific American depicts the entire Universe in a two-page spread — full of nothing.

▲ How Analyzing Cosmic Nothing Might Explain Everything. Text by Michael Lemonick (editor), art direction by Jen Christiansen (Senior Graphics Editor), source: SDSS
The graphic uses the latest data from SDSS 12 and is an update to my Superclusters and Voids poster.
Michael Lemonick (editor) explains on the graphic:
“Regions of relatively empty space called cosmic voids are everywhere in the universe, and scientists believe studying their size, shape and spread across the cosmos could help them understand dark matter, dark energy and other big mysteries.
To use voids in this way, astronomers must map these regions in detailâa project that is just beginning.
Shown here are voids discovered by the Sloan Digital Sky Survey (SDSS), along with a selection of 16 previously named voids. Scientists expect voids to be evenly distributed throughout spaceâthe lack of voids in some regions on the globe simply reï¬ects SDSSâs sky coverage.”
voids
Sofia Contarini, Alice Pisani, Nico Hamaus, Federico Marulli Lauro Moscardini & Marco Baldi (2023) Cosmological Constraints from the BOSS DR12 Void Size Function Astrophysical Journal 953:46.
Nico Hamaus, Alice Pisani, Jin-Ah Choi, Guilhem Lavaux, Benjamin D. Wandelt & Jochen Weller (2020) Journal of Cosmology and Astroparticle Physics 2020:023.
Sloan Digital Sky Survey Data Release 12
constellation figures
Alan MacRobert (Sky & Telescope), Paulina Rowicka/Martin Krzywinski (revisions & Microscopium)
stars
Hoffleit & Warren Jr. (1991) The Bright Star Catalog, 5th Revised Edition (Preliminary Version).
cosmology
H0 = 67.4 km/(Mpc·s), Ωm = 0.315, Ωv = 0.685. Planck collaboration Planck 2018 results. VI. Cosmological parameters (2018).