Brewer Palettes
contents
- 1 · Presetations about color and brewer paletes
- 2 · Brewer palettes at a glance
- 3 · The challenge of color palettes
- 4 · Selecting colors in RGB and HSV
- 5 · Perceptual uniformity
- 6 · Brewer palettes
- 6.1 · Types of Brewer Palettes
- 6.2 · Brewer Palette Swatches for Adobe
- 6.3 · Uses of Brewer Palettes
- 7 · Brewer palettes and color blindness
- 8 · Resources
My presentation “Color palettes matter” provides the background to understand Brewer palettes: why they're needed and how to use them.
Brewer palettes are color combinations selected for their special properties for use in data visualization and information design.
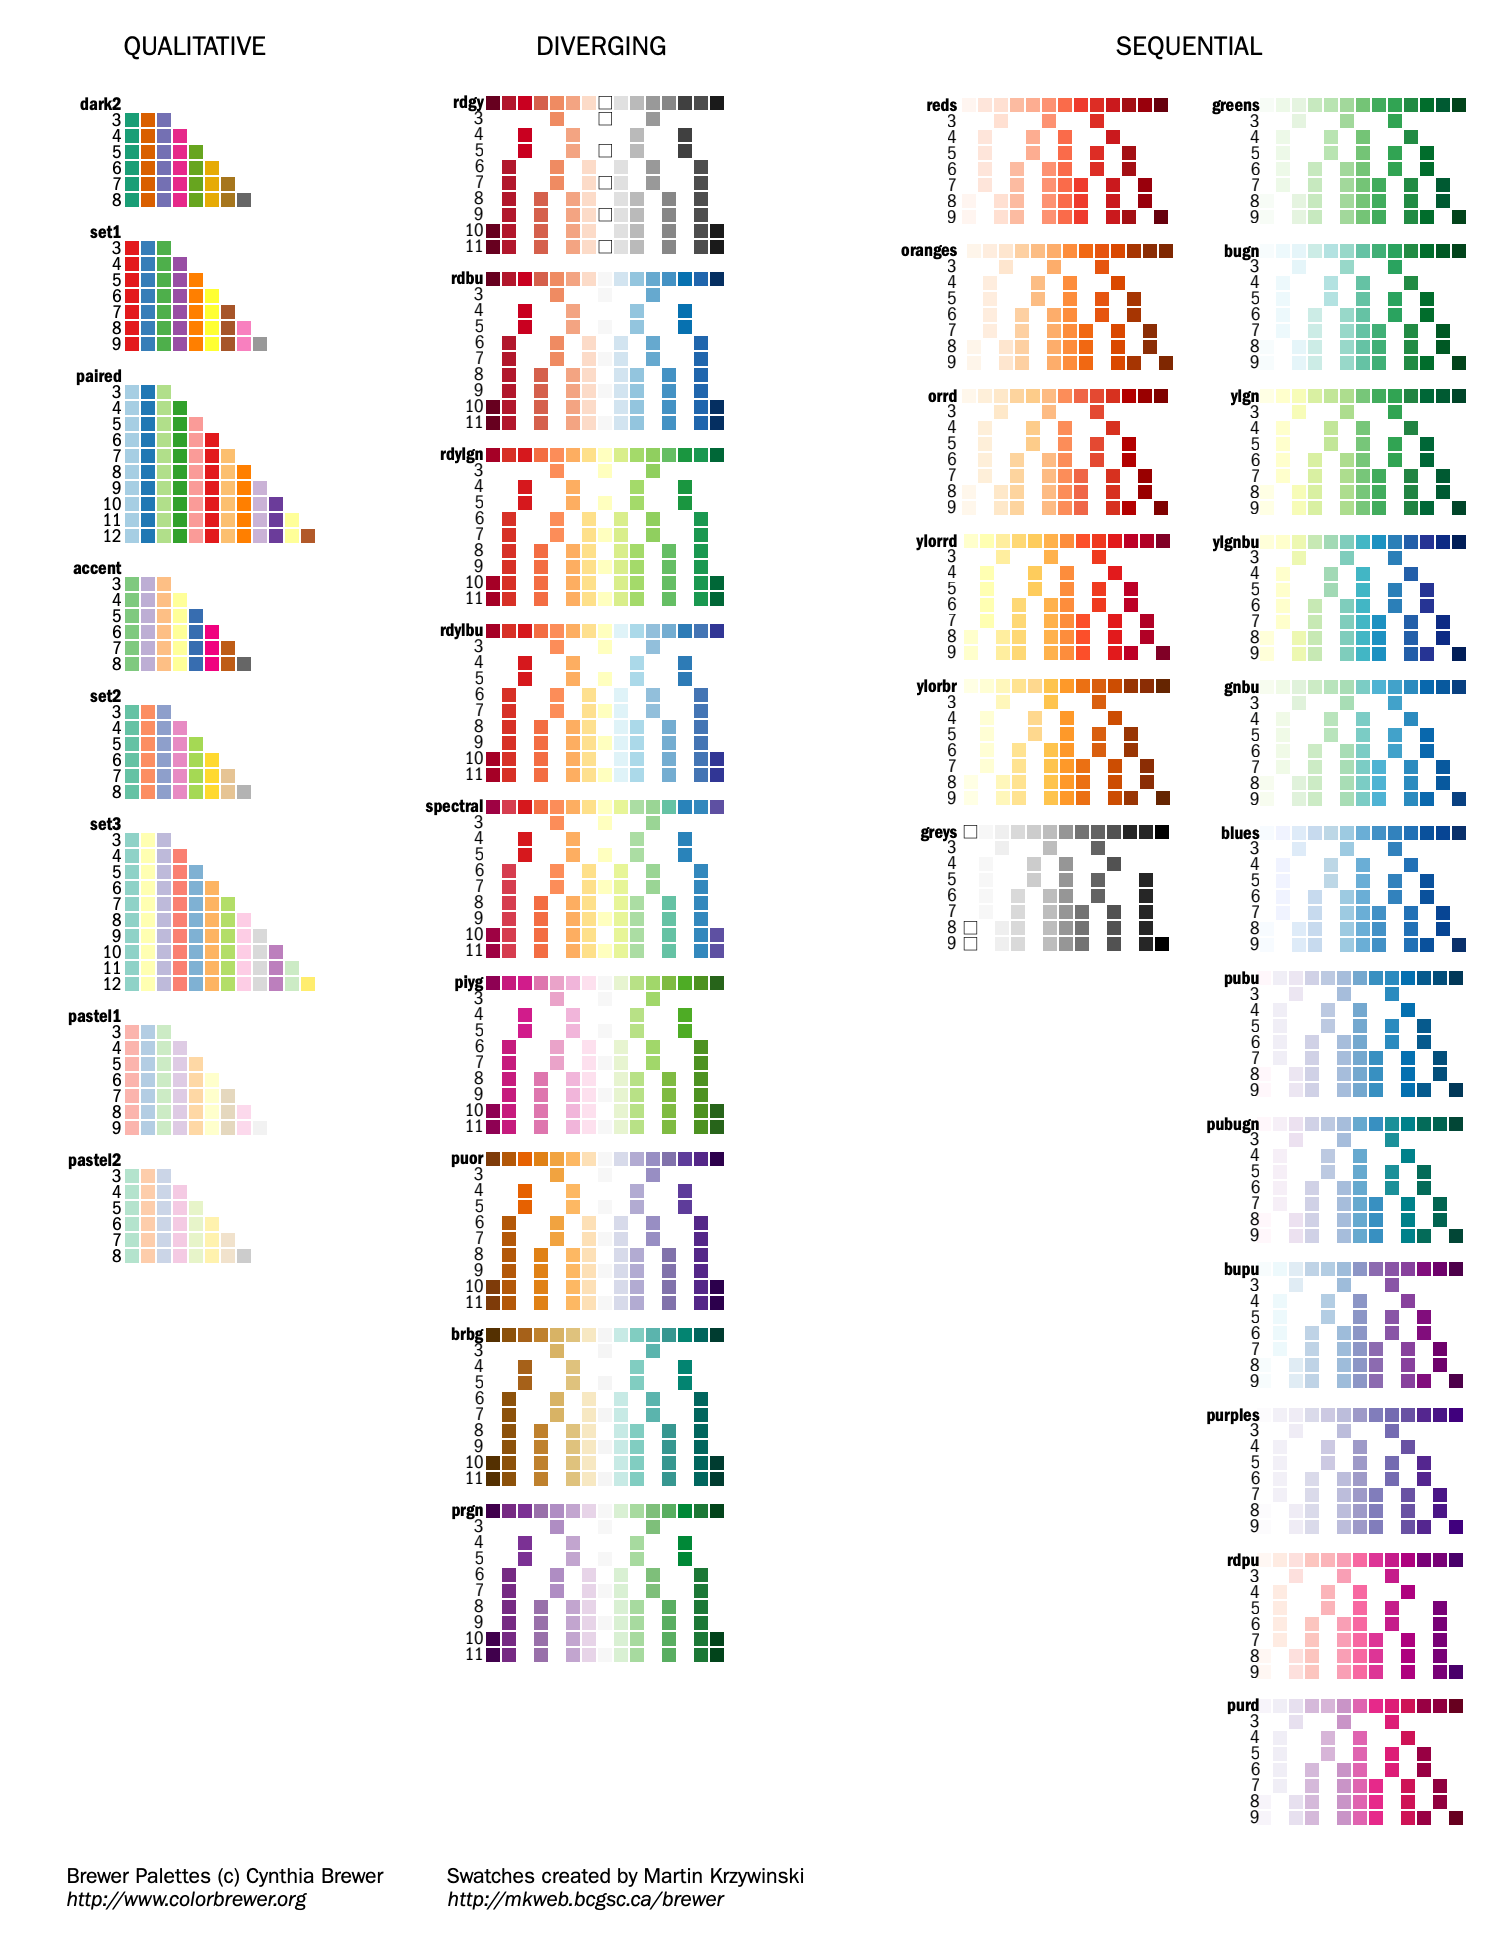
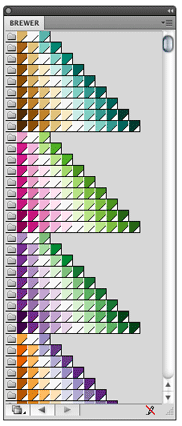
Below is a list of all the Brewer palettes, shown in the context of the sets of colors used to create them.
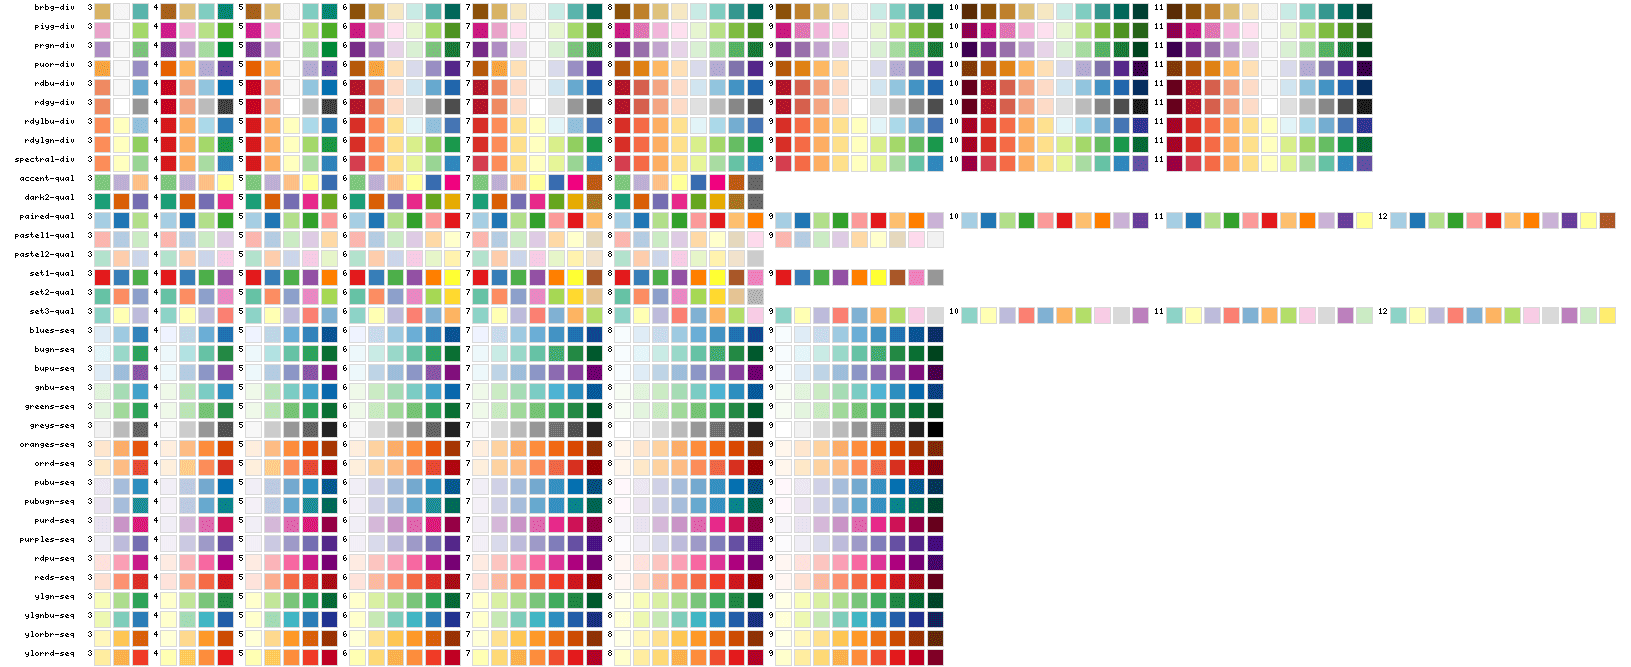
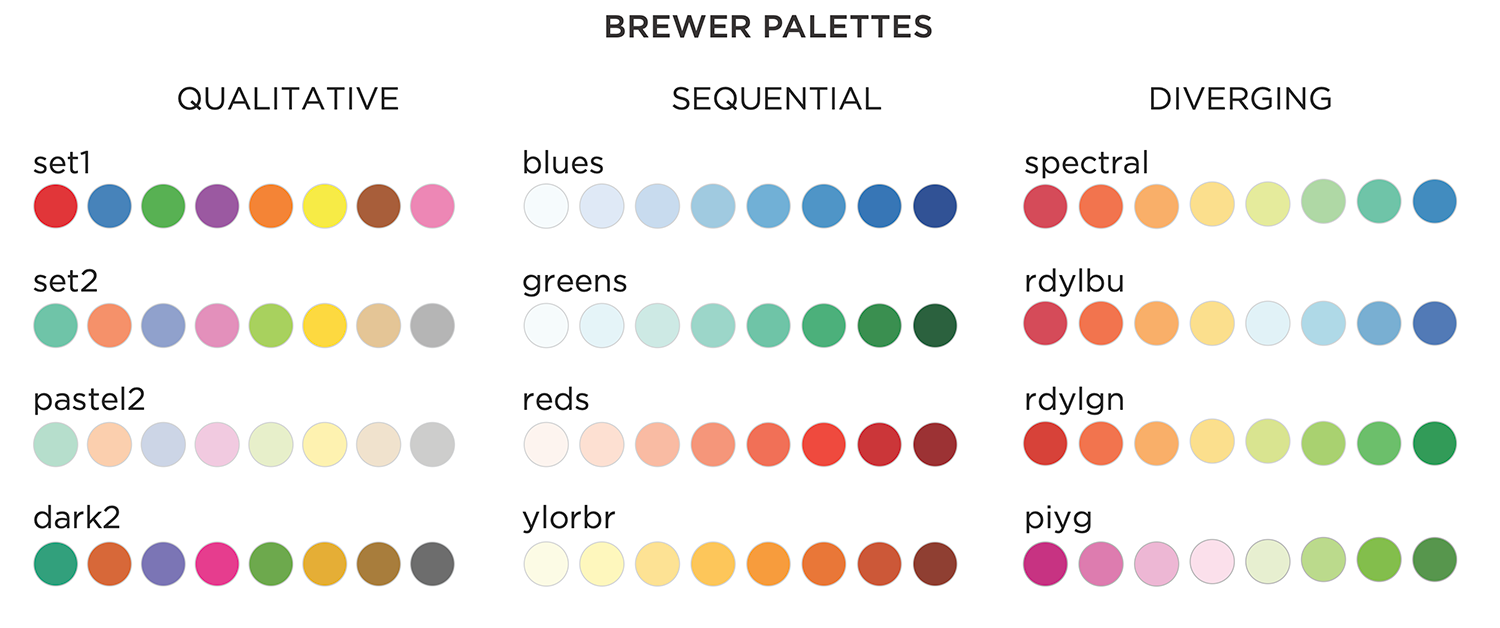
The image below shows a more compact representation of all the Brewer palettes.
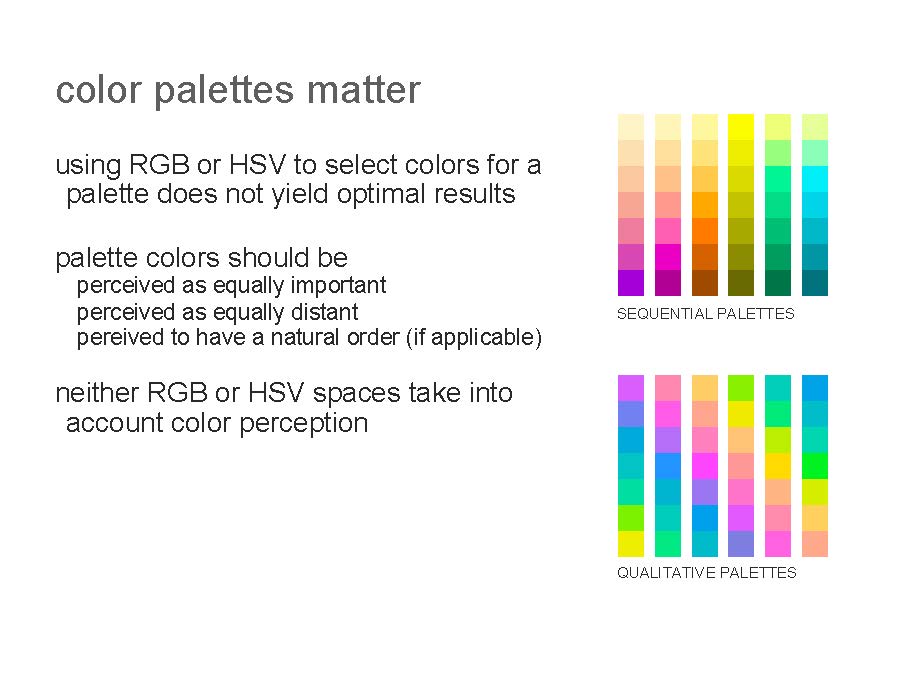
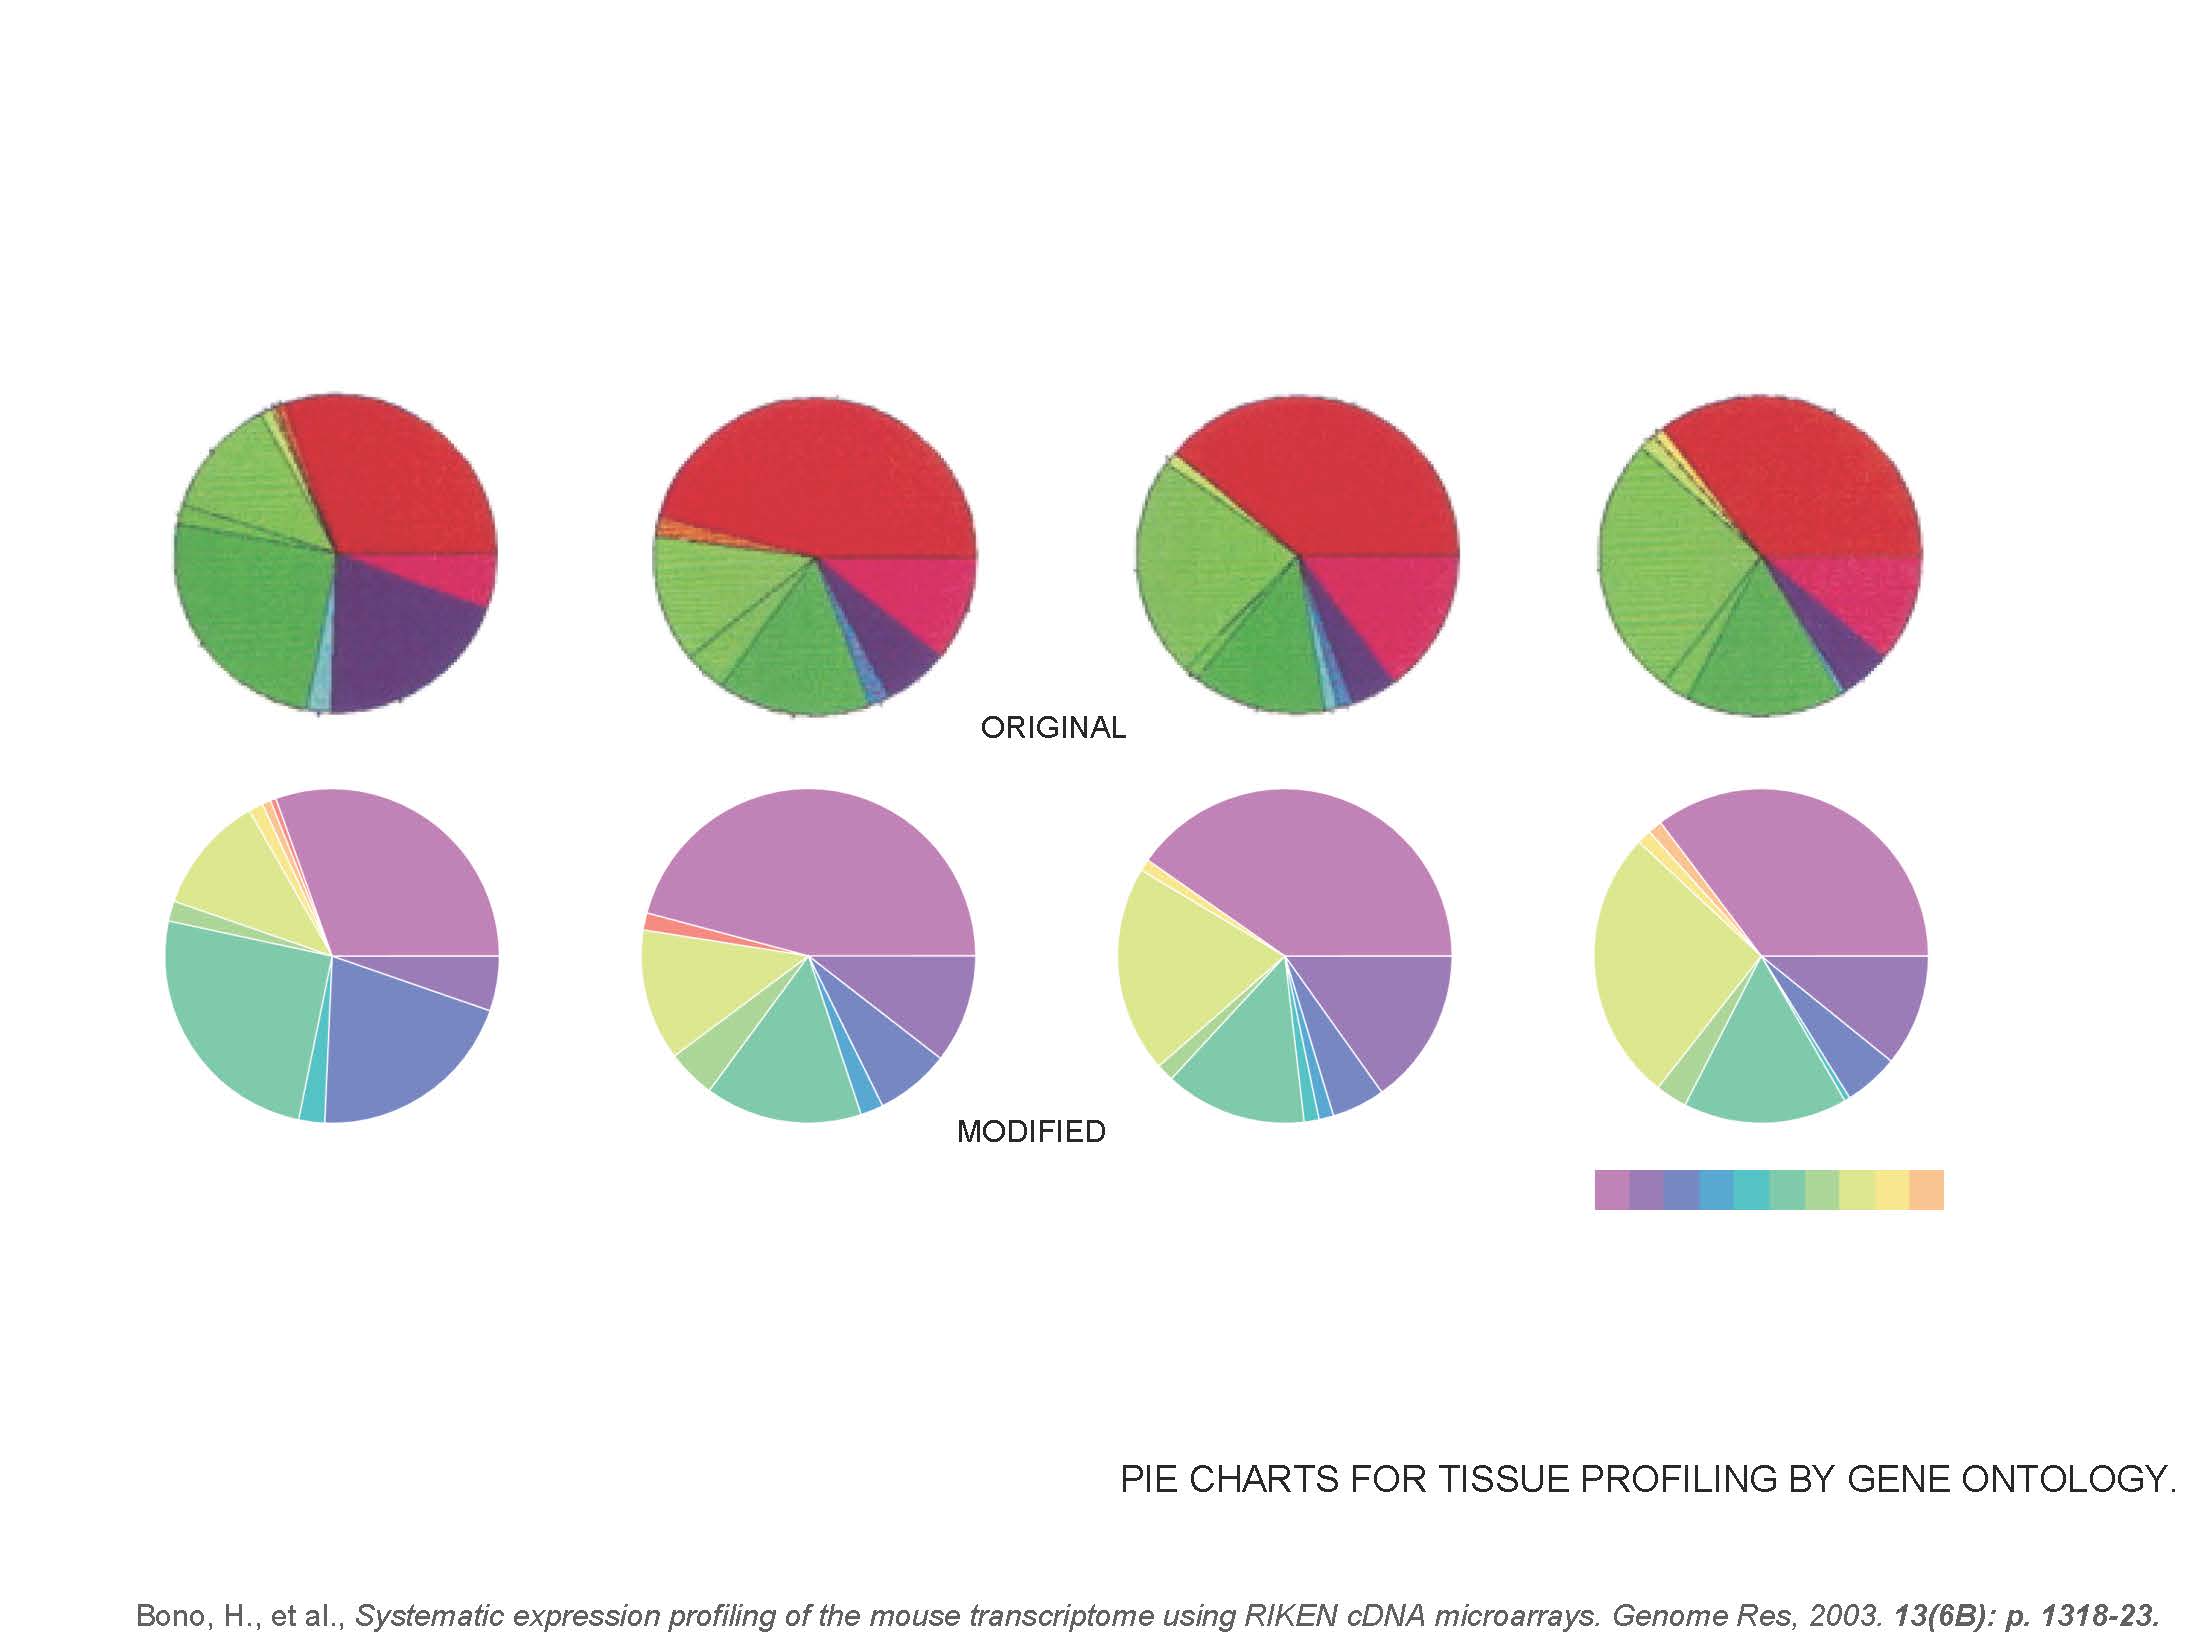
Selecting effective colors for bar plots, pie charts, and heat maps is made more difficult by the fact that the way we select color in software does not reflect how we perceive the color.
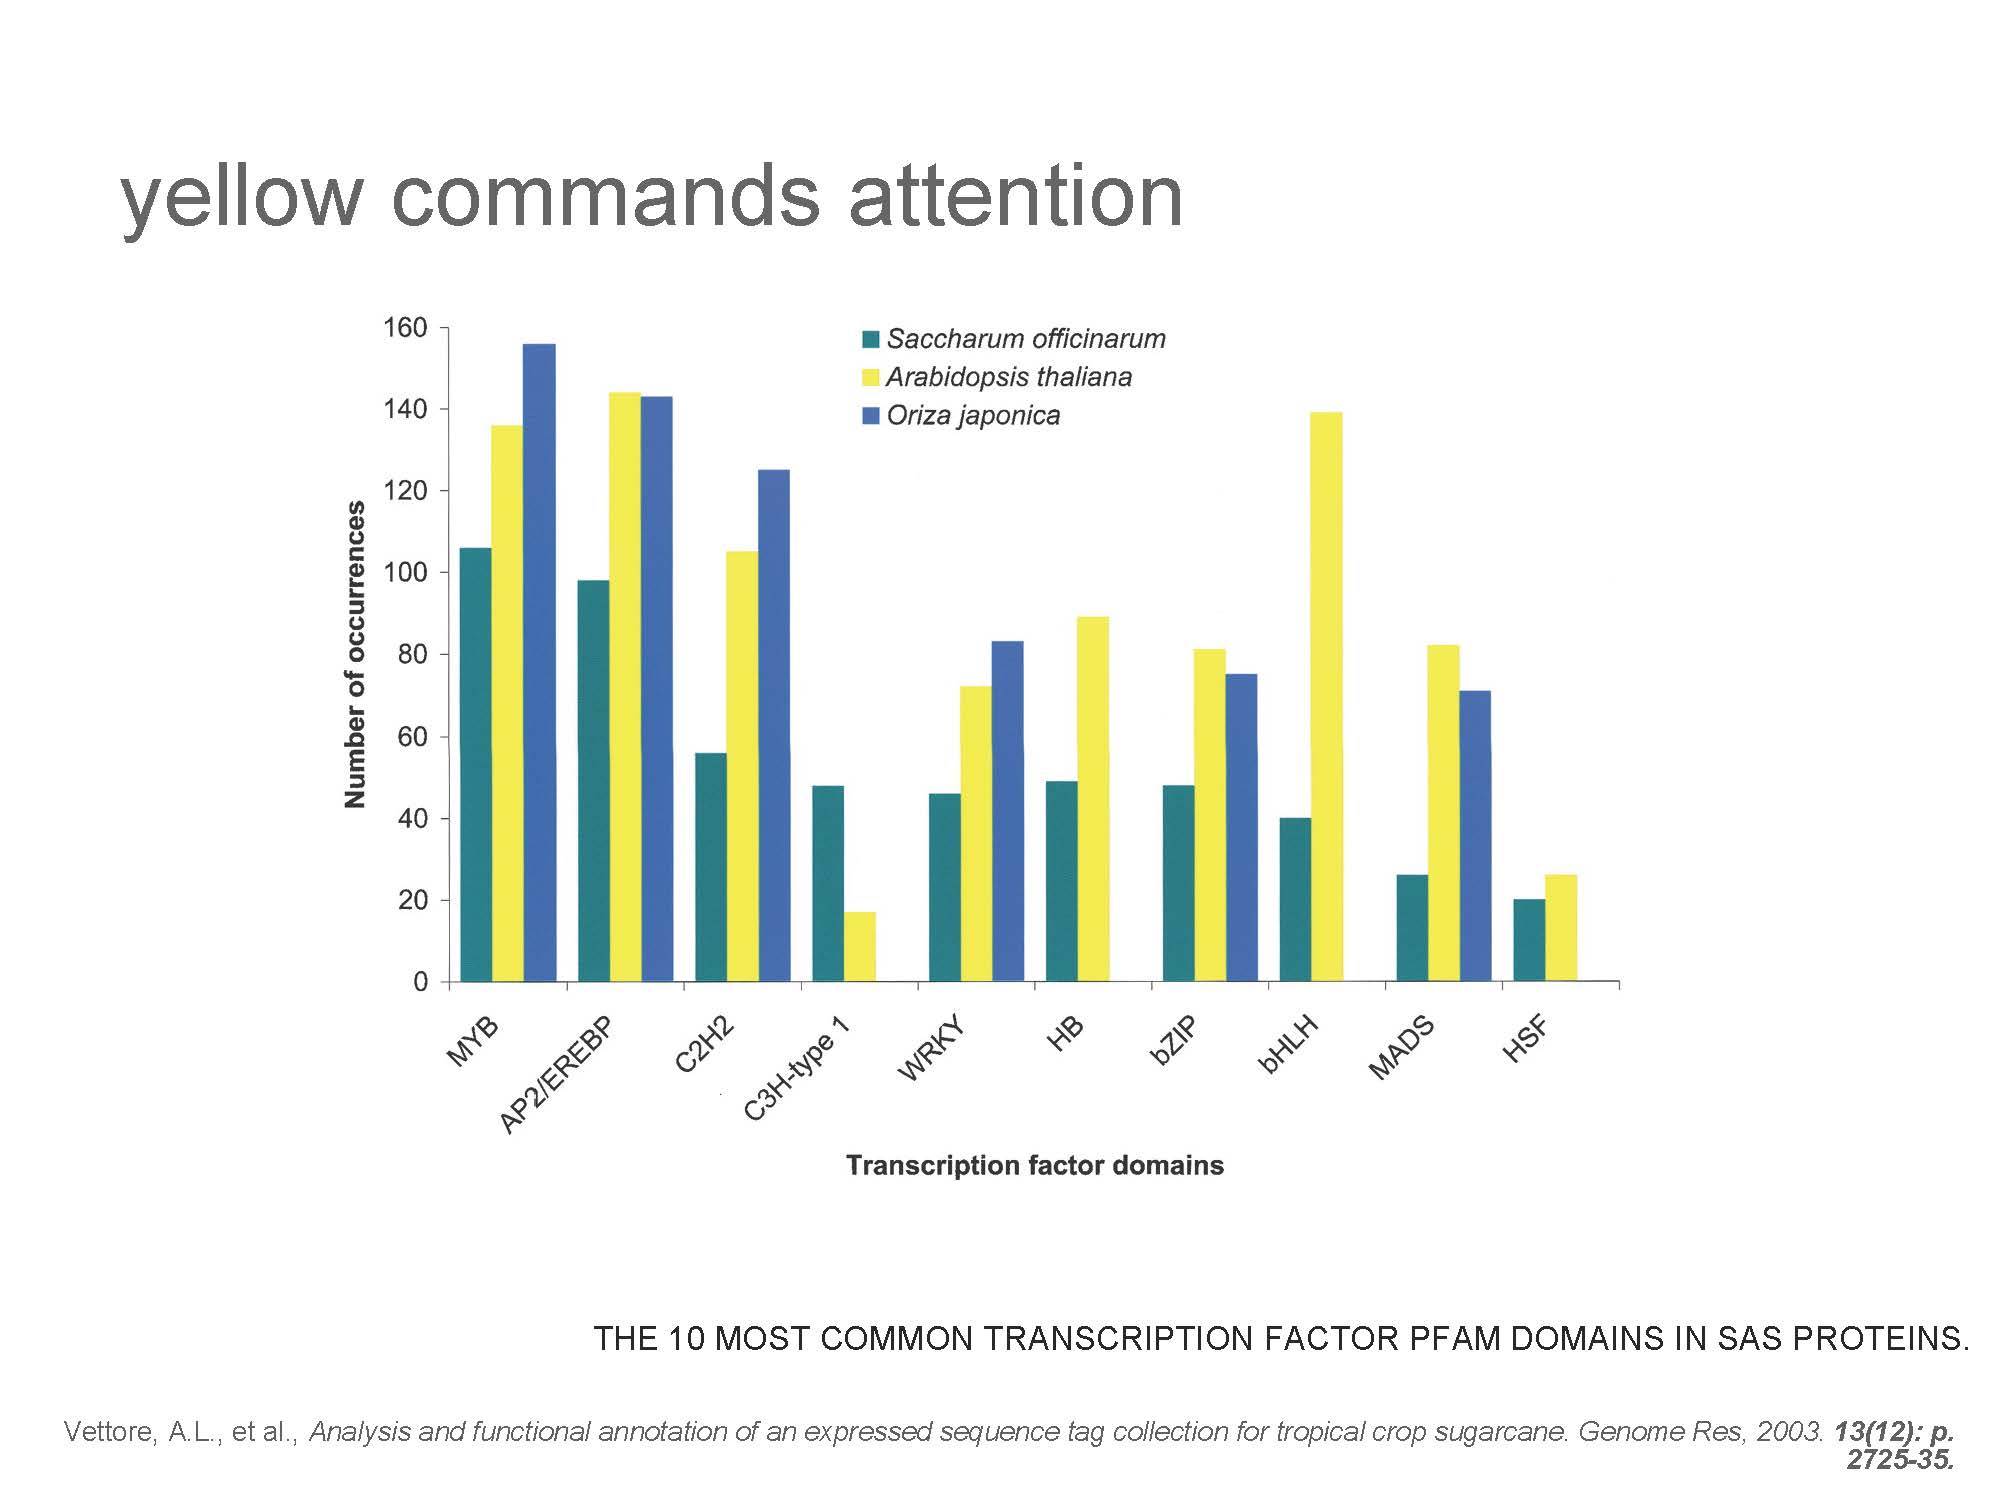
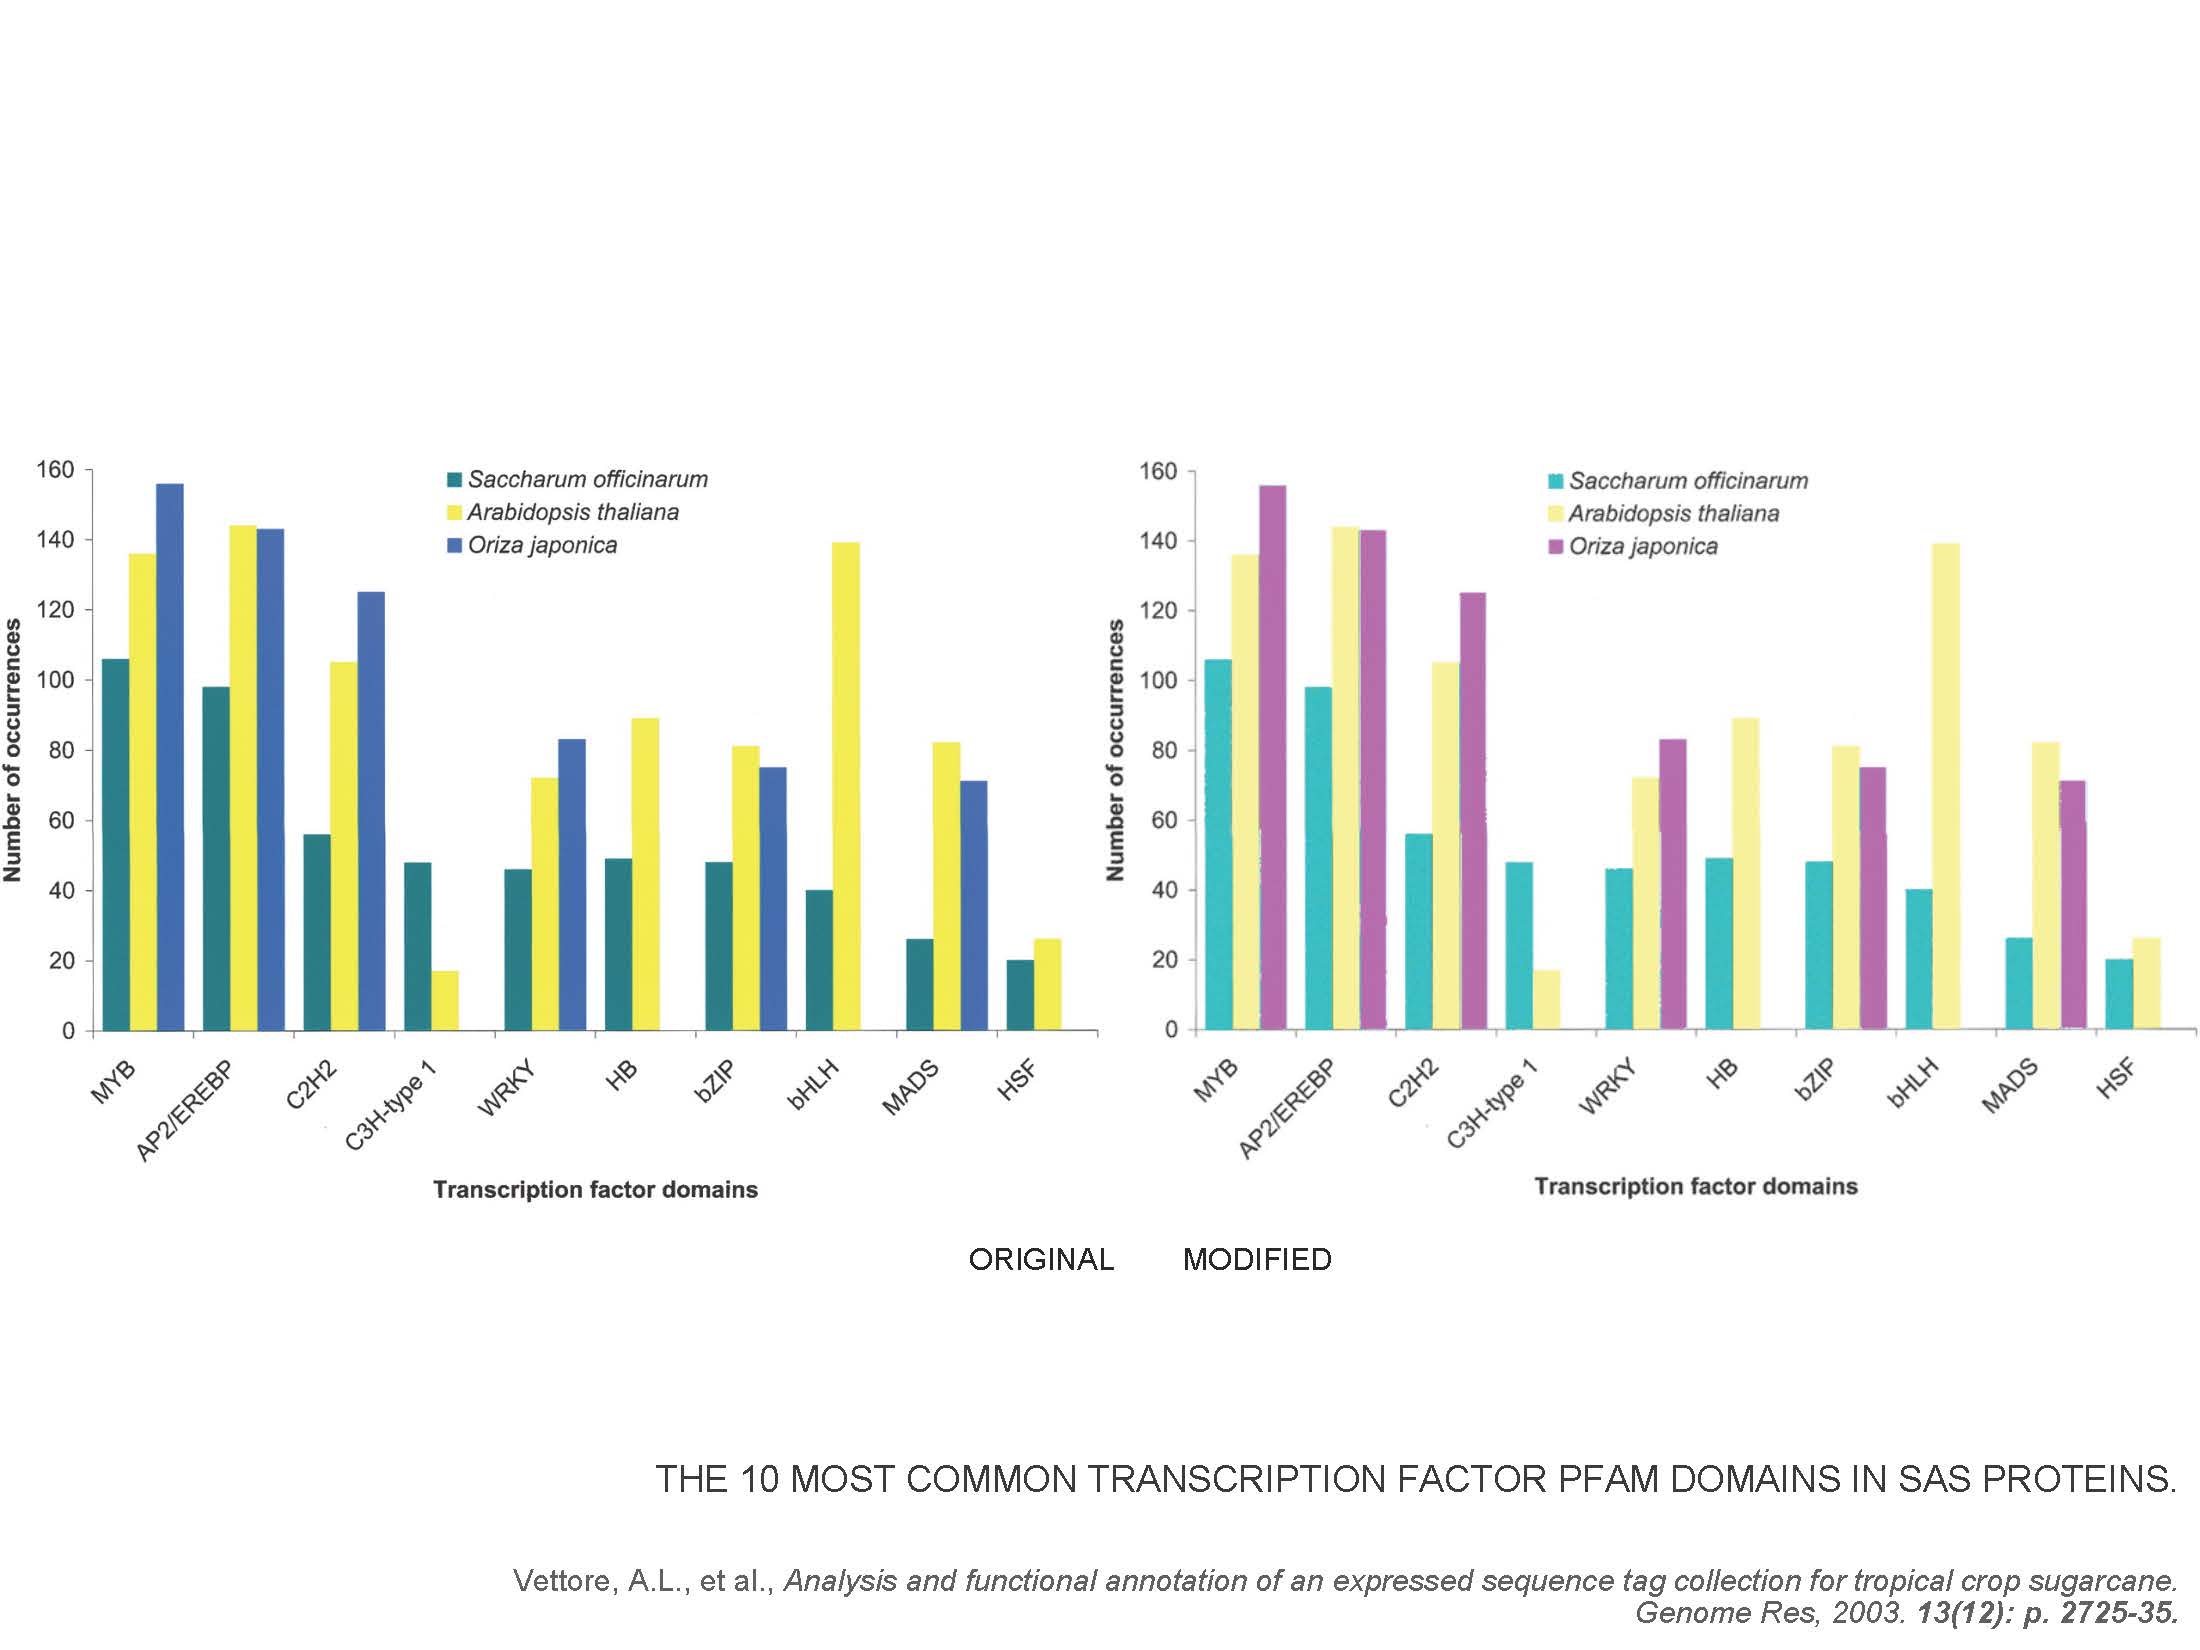
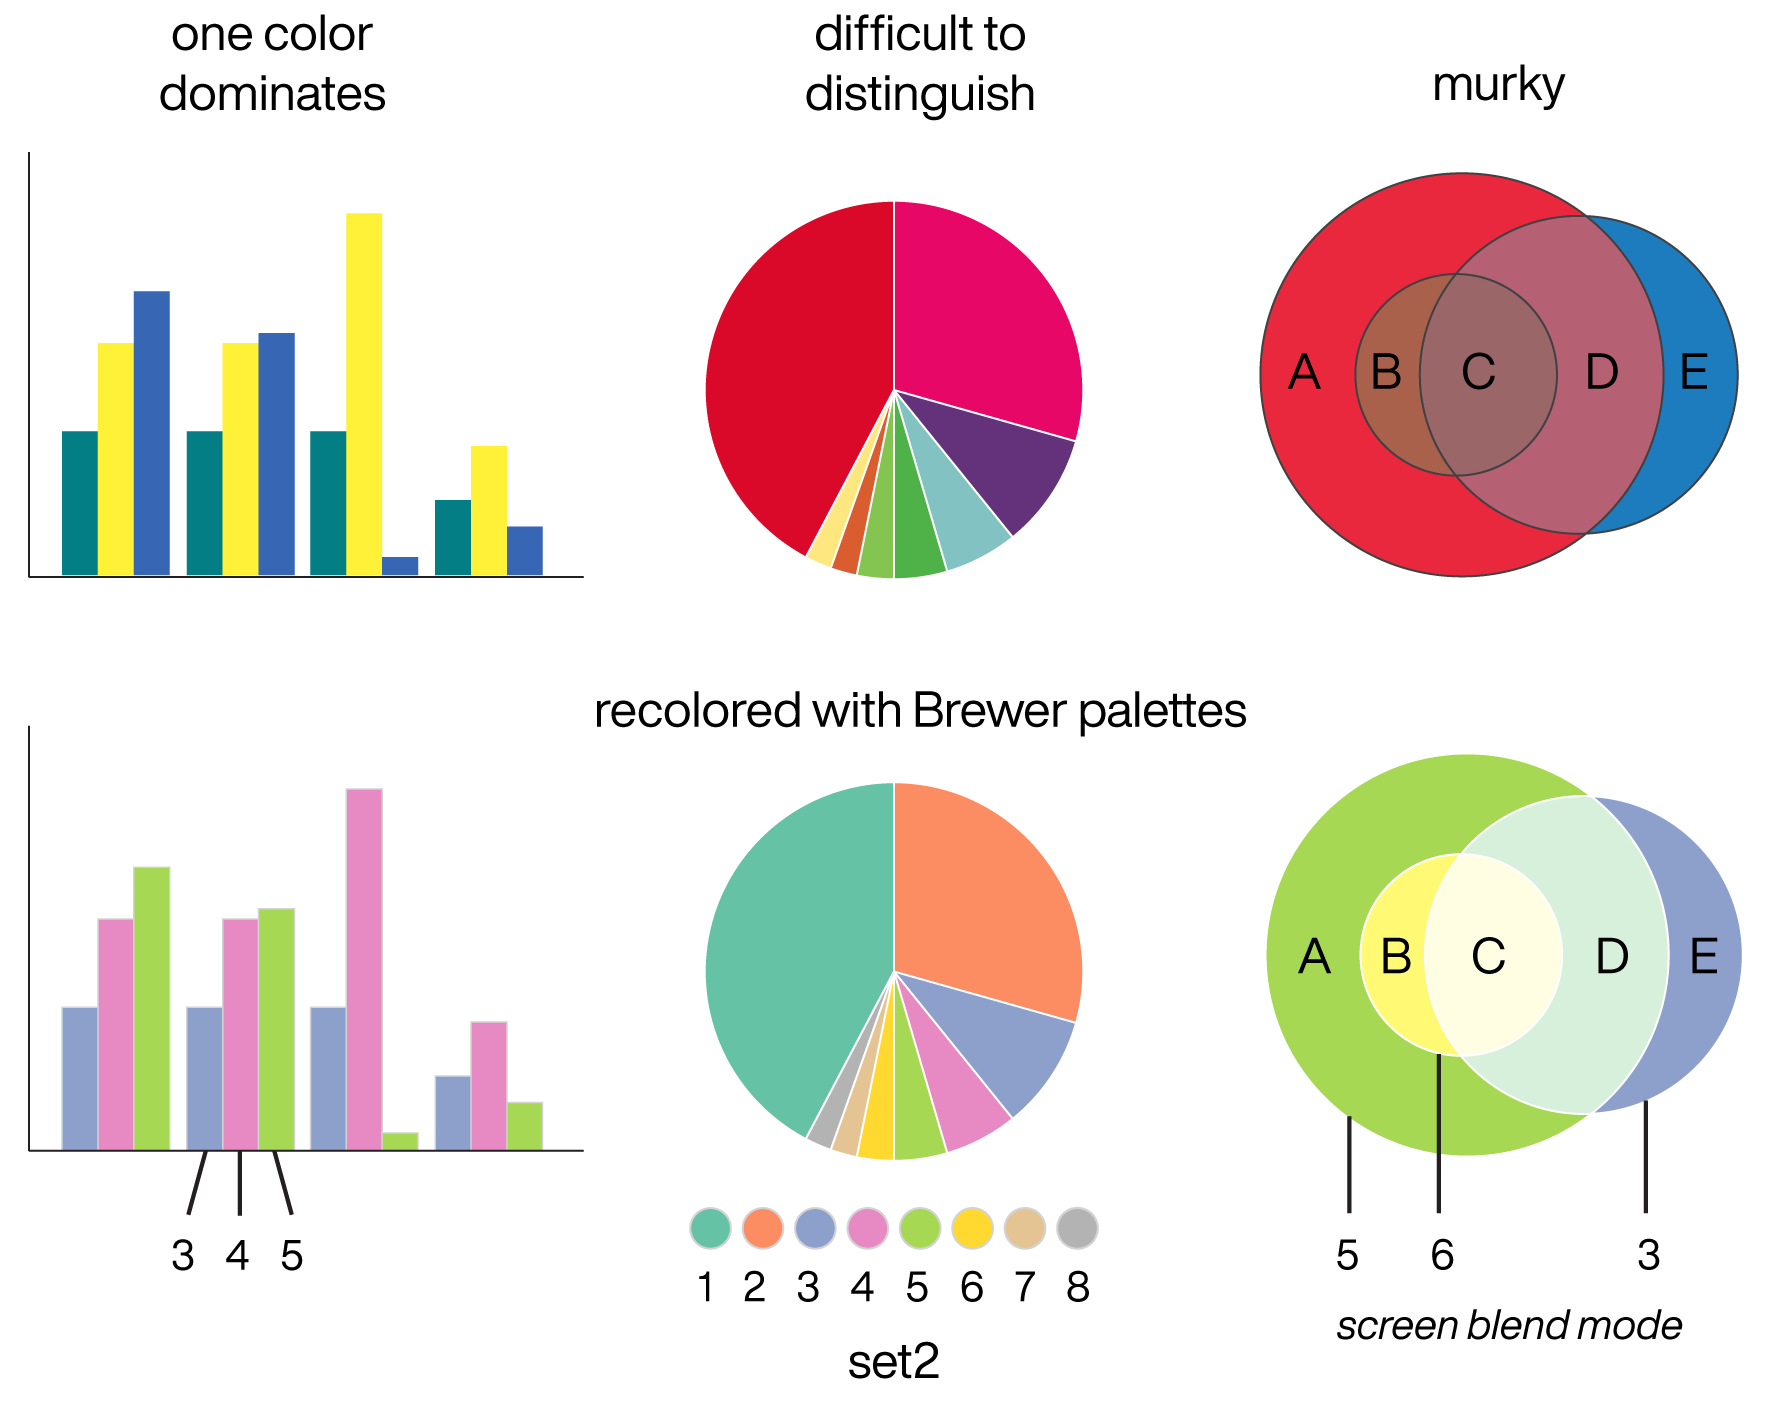
There are many examples of poor color combinations in published figures. For example, if categories are encoded with a combination of bright and dark colors, the bright colors will dominate the reader's attention. On the other hand, if two colors appear similar, the reader will instinctively perceive them as belonging to a group and infer that the underlying variables are related.
Colors with poor contrast (colors with similar perceived brightness) or simultaneous contrast (pure colors) also interfere with interpreting figures.
Most people select colors using RGB sliders, which is just about the worst way to pick a color. Consider the fact that when we look at a color, we cannot easily decompose it into its red, green and blue components. This limits usefulness of RGB for color selection.
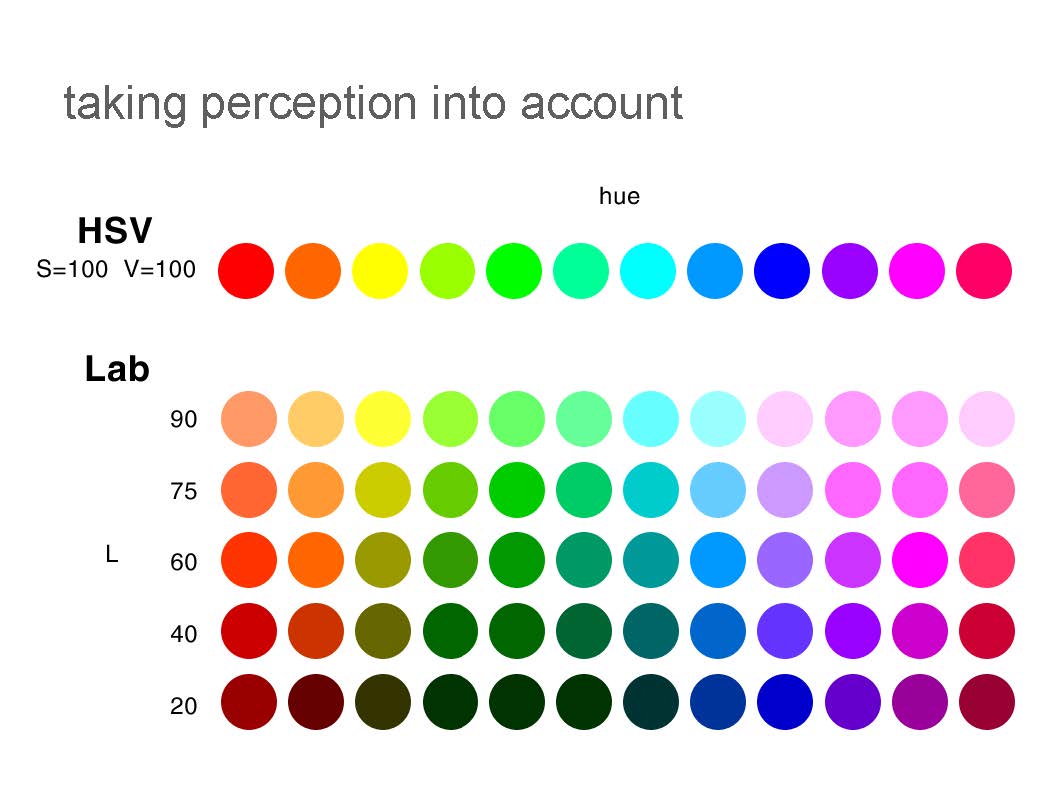
HSV is a better color space, which defines a color based on hue, saturation and value. These are three properties that we intuitively assess when we see a color. We think of a “dark rich blue” and “light faded red”, making HSV a reasonably useful model for color selection. Unfortunately, HSV has a nagging problem — although it is based on intuitive parameters, it is not perceptually uniform.
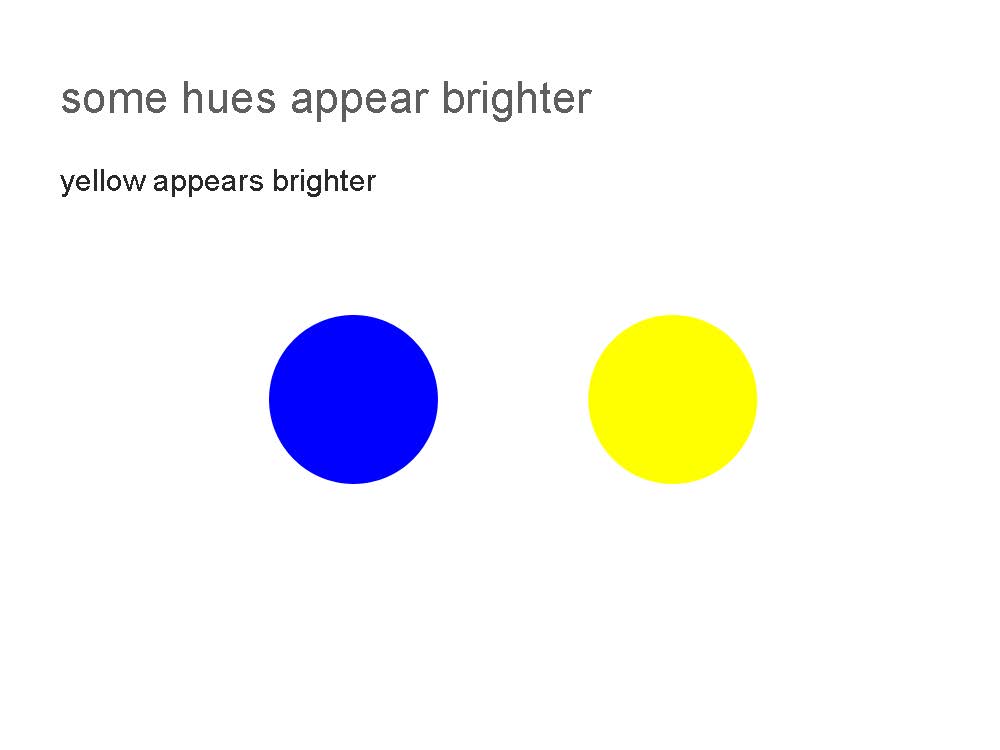
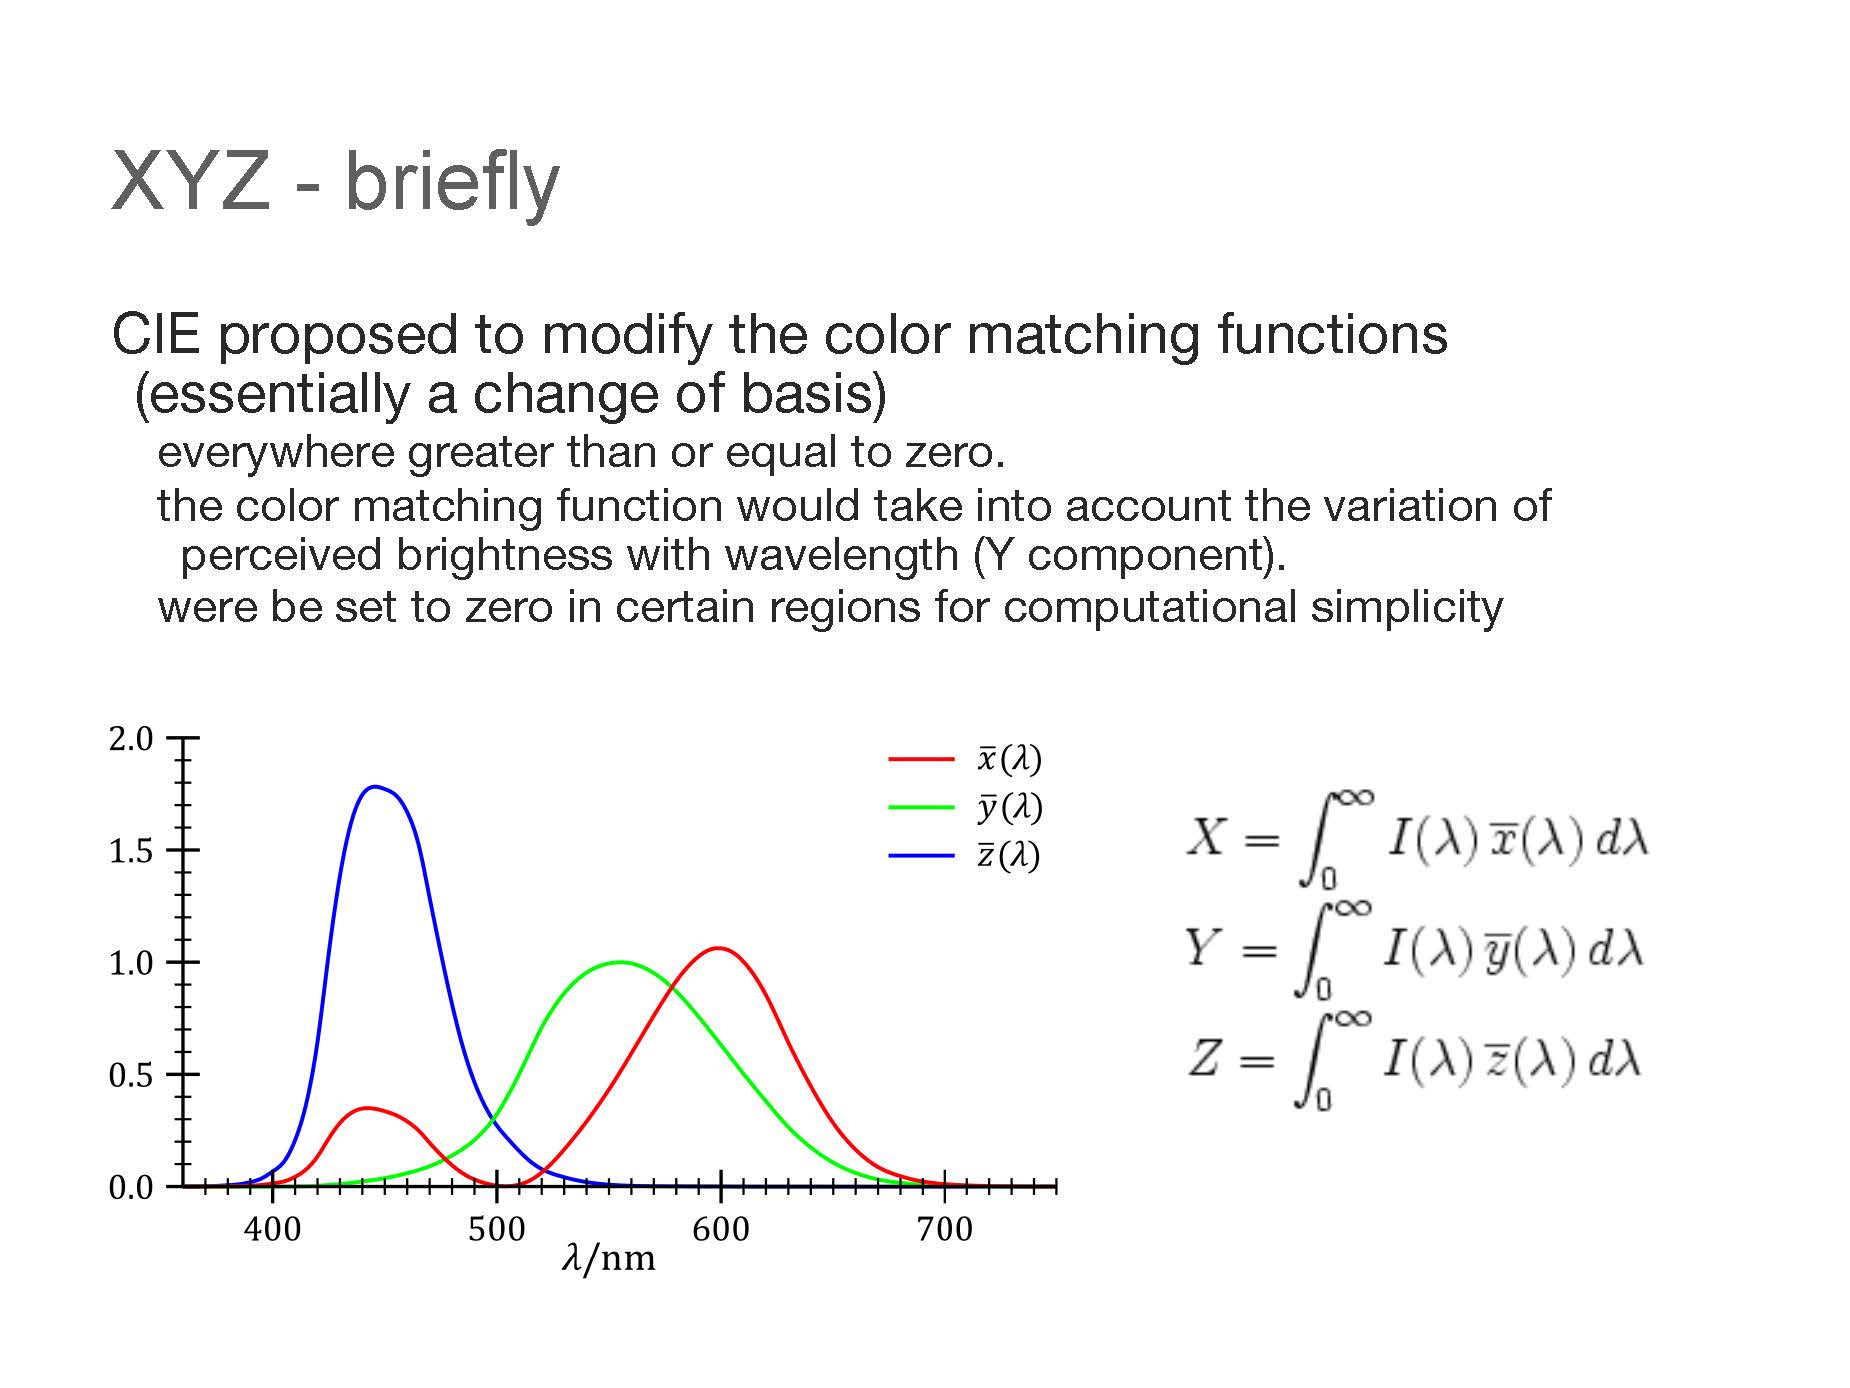
First, colors with the same HSV brightness do not have the same apparent brightness (luminosity). The figure below shows this for blue, orange and yellow. Despite that both blue and yellow have maximum value, blue appears dark (its perceptual luminosity is actually `L=30`) whereas yellow appears bright (`L=98`).
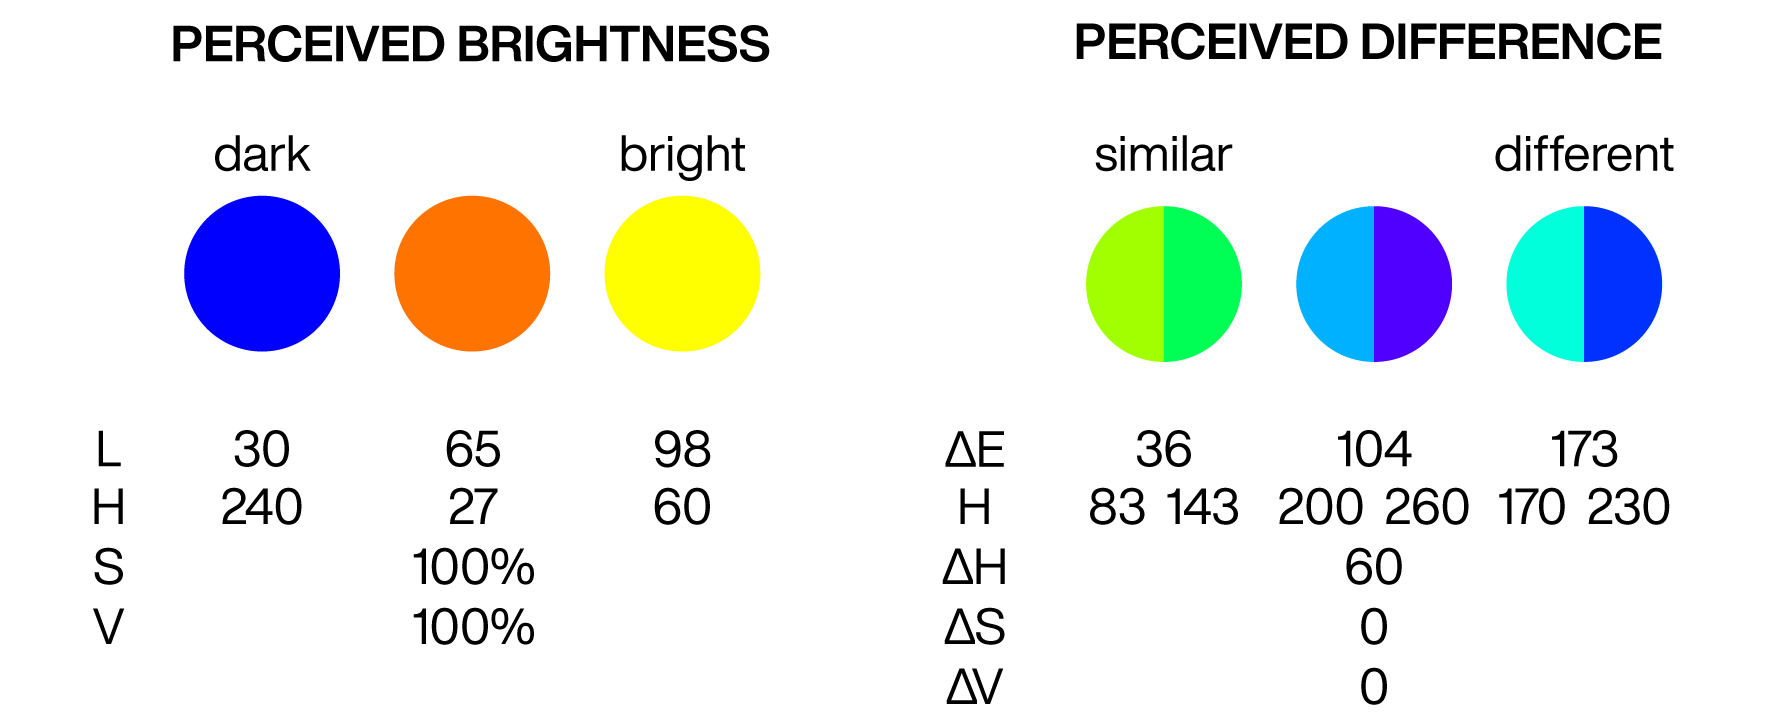
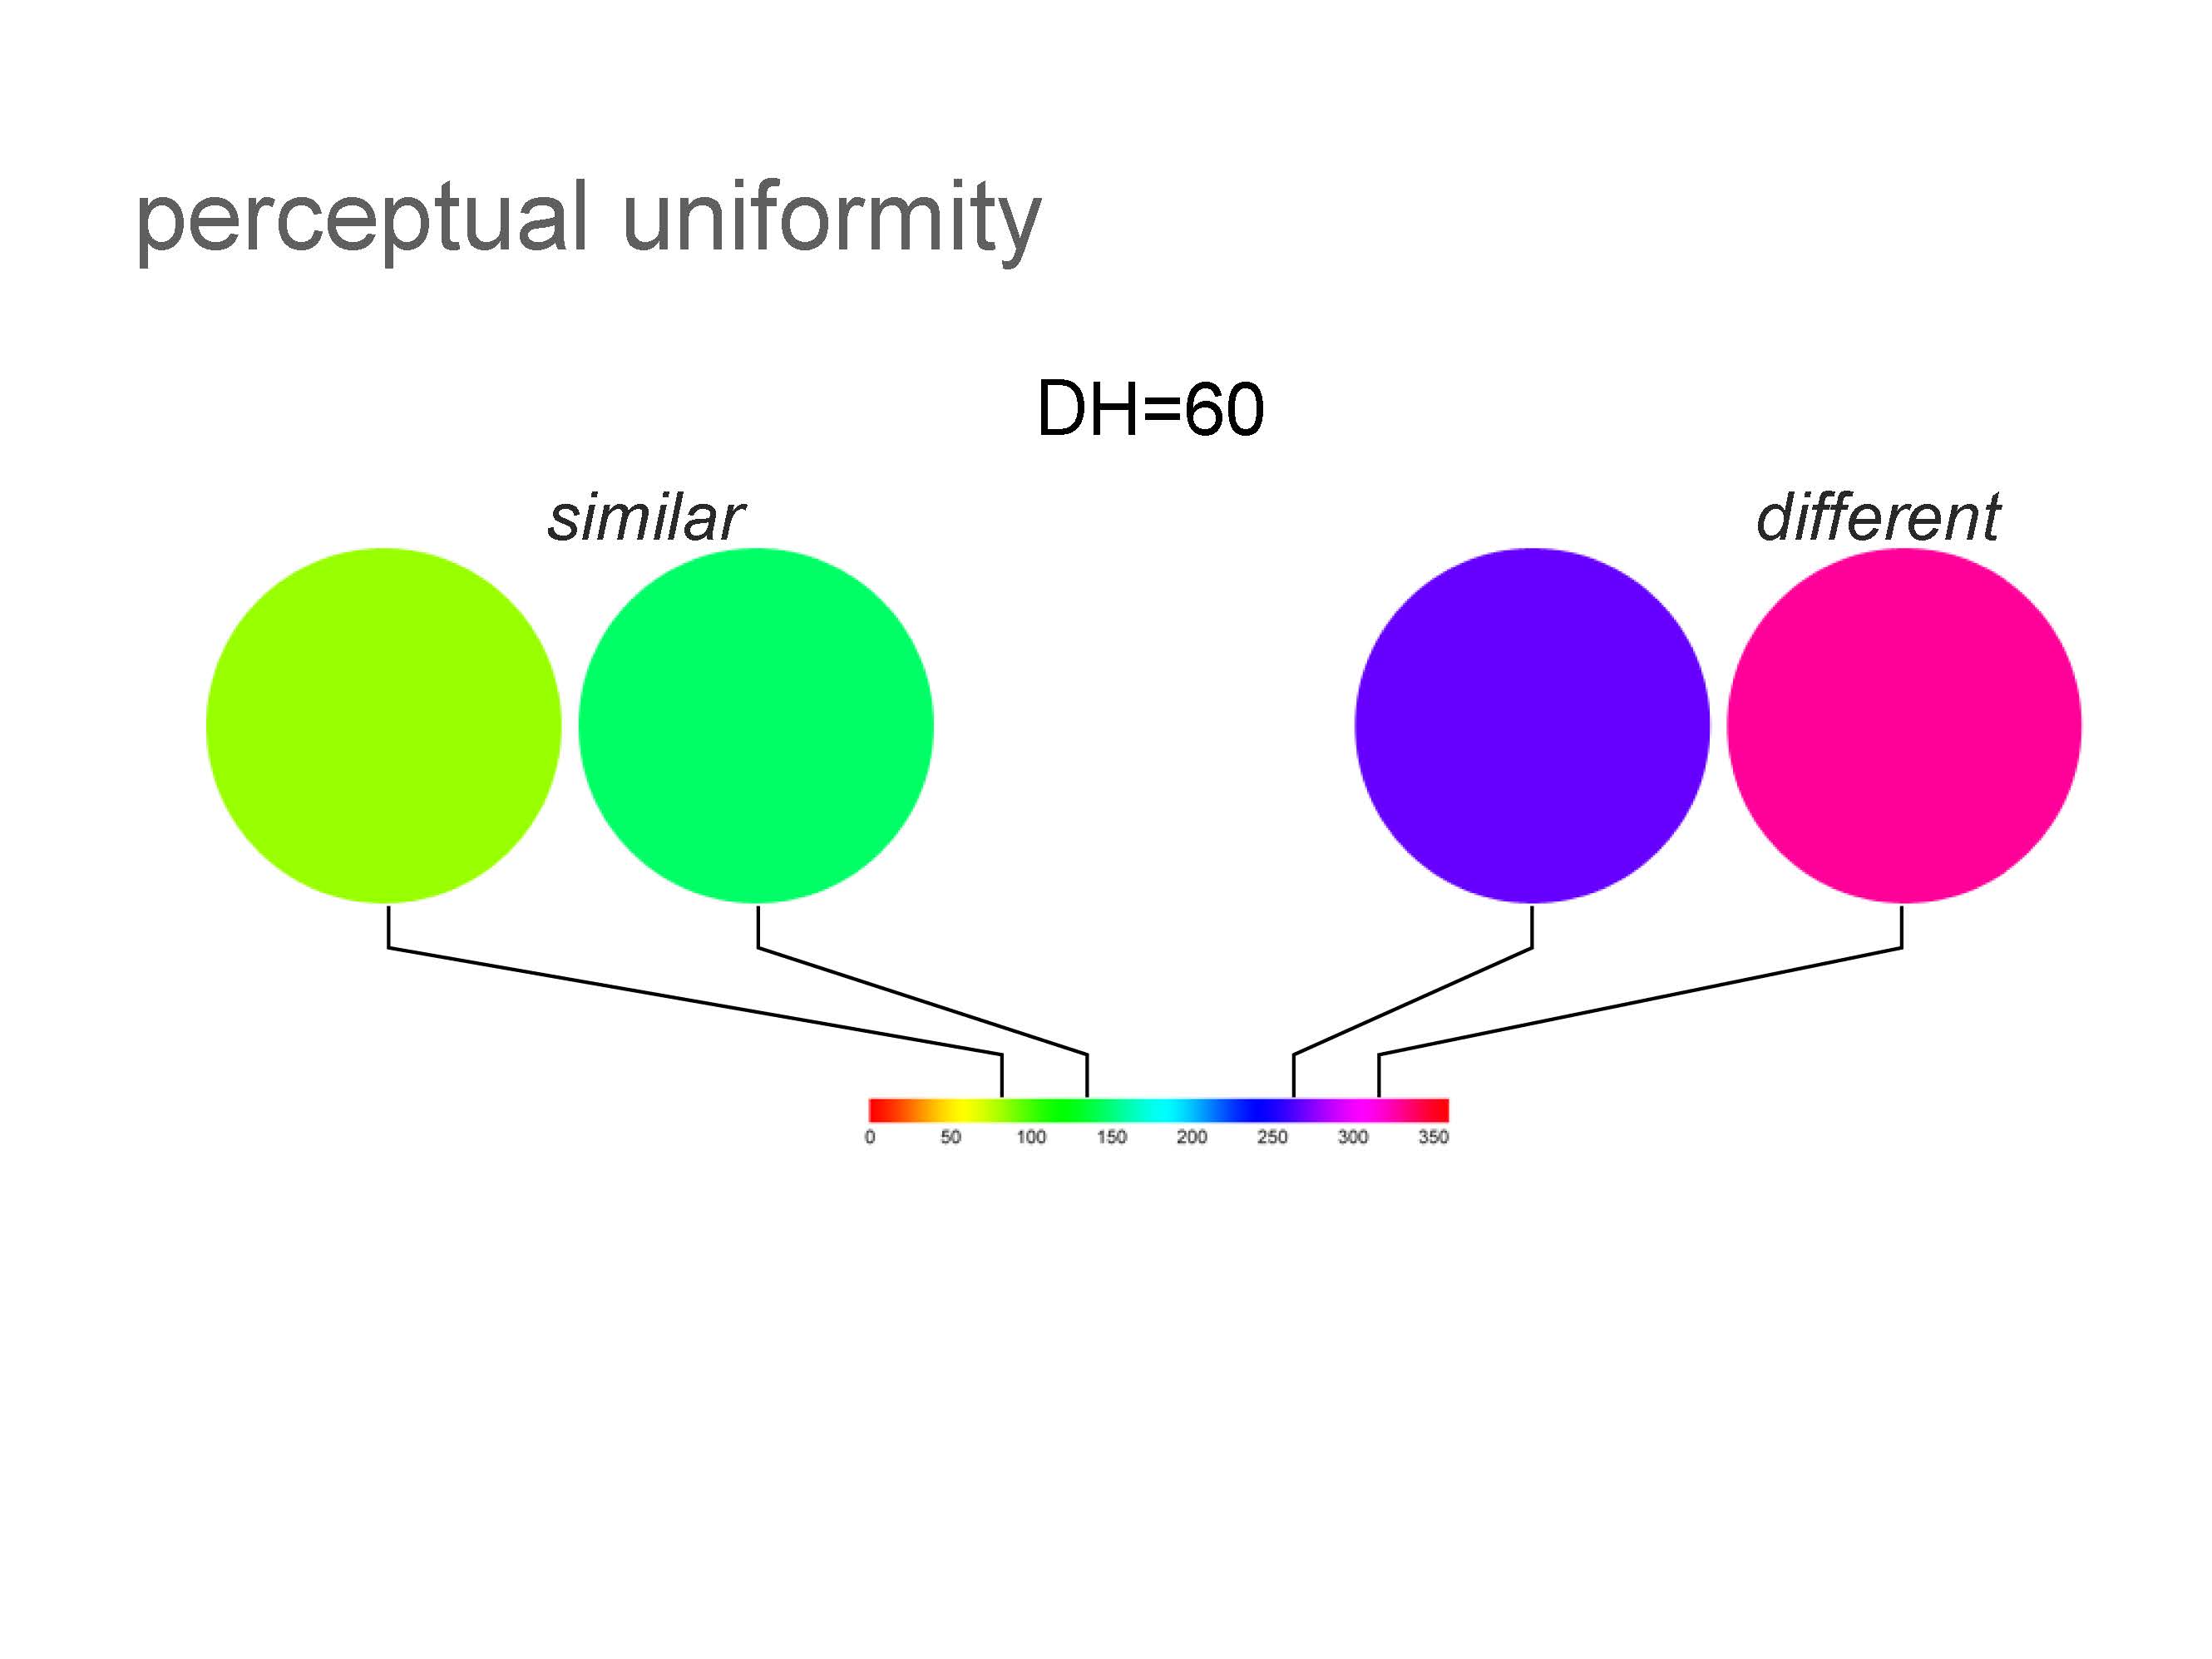
Second, differences between two colors that vary by a fixed HSV distance (e.g. ΔH = 60) can be perceived differently, depending on where the colors sit in HSV space. For example, two greens that have the same `S` and `V` values but vary by ΔH = 60 have a color difference of ΔE = 36 (learn about measuring color differences and ΔE). But if we rotate the hue so that we're now looking at two blues with the same ΔH, the perceived difference is 5-fold larger (ΔE = 173).
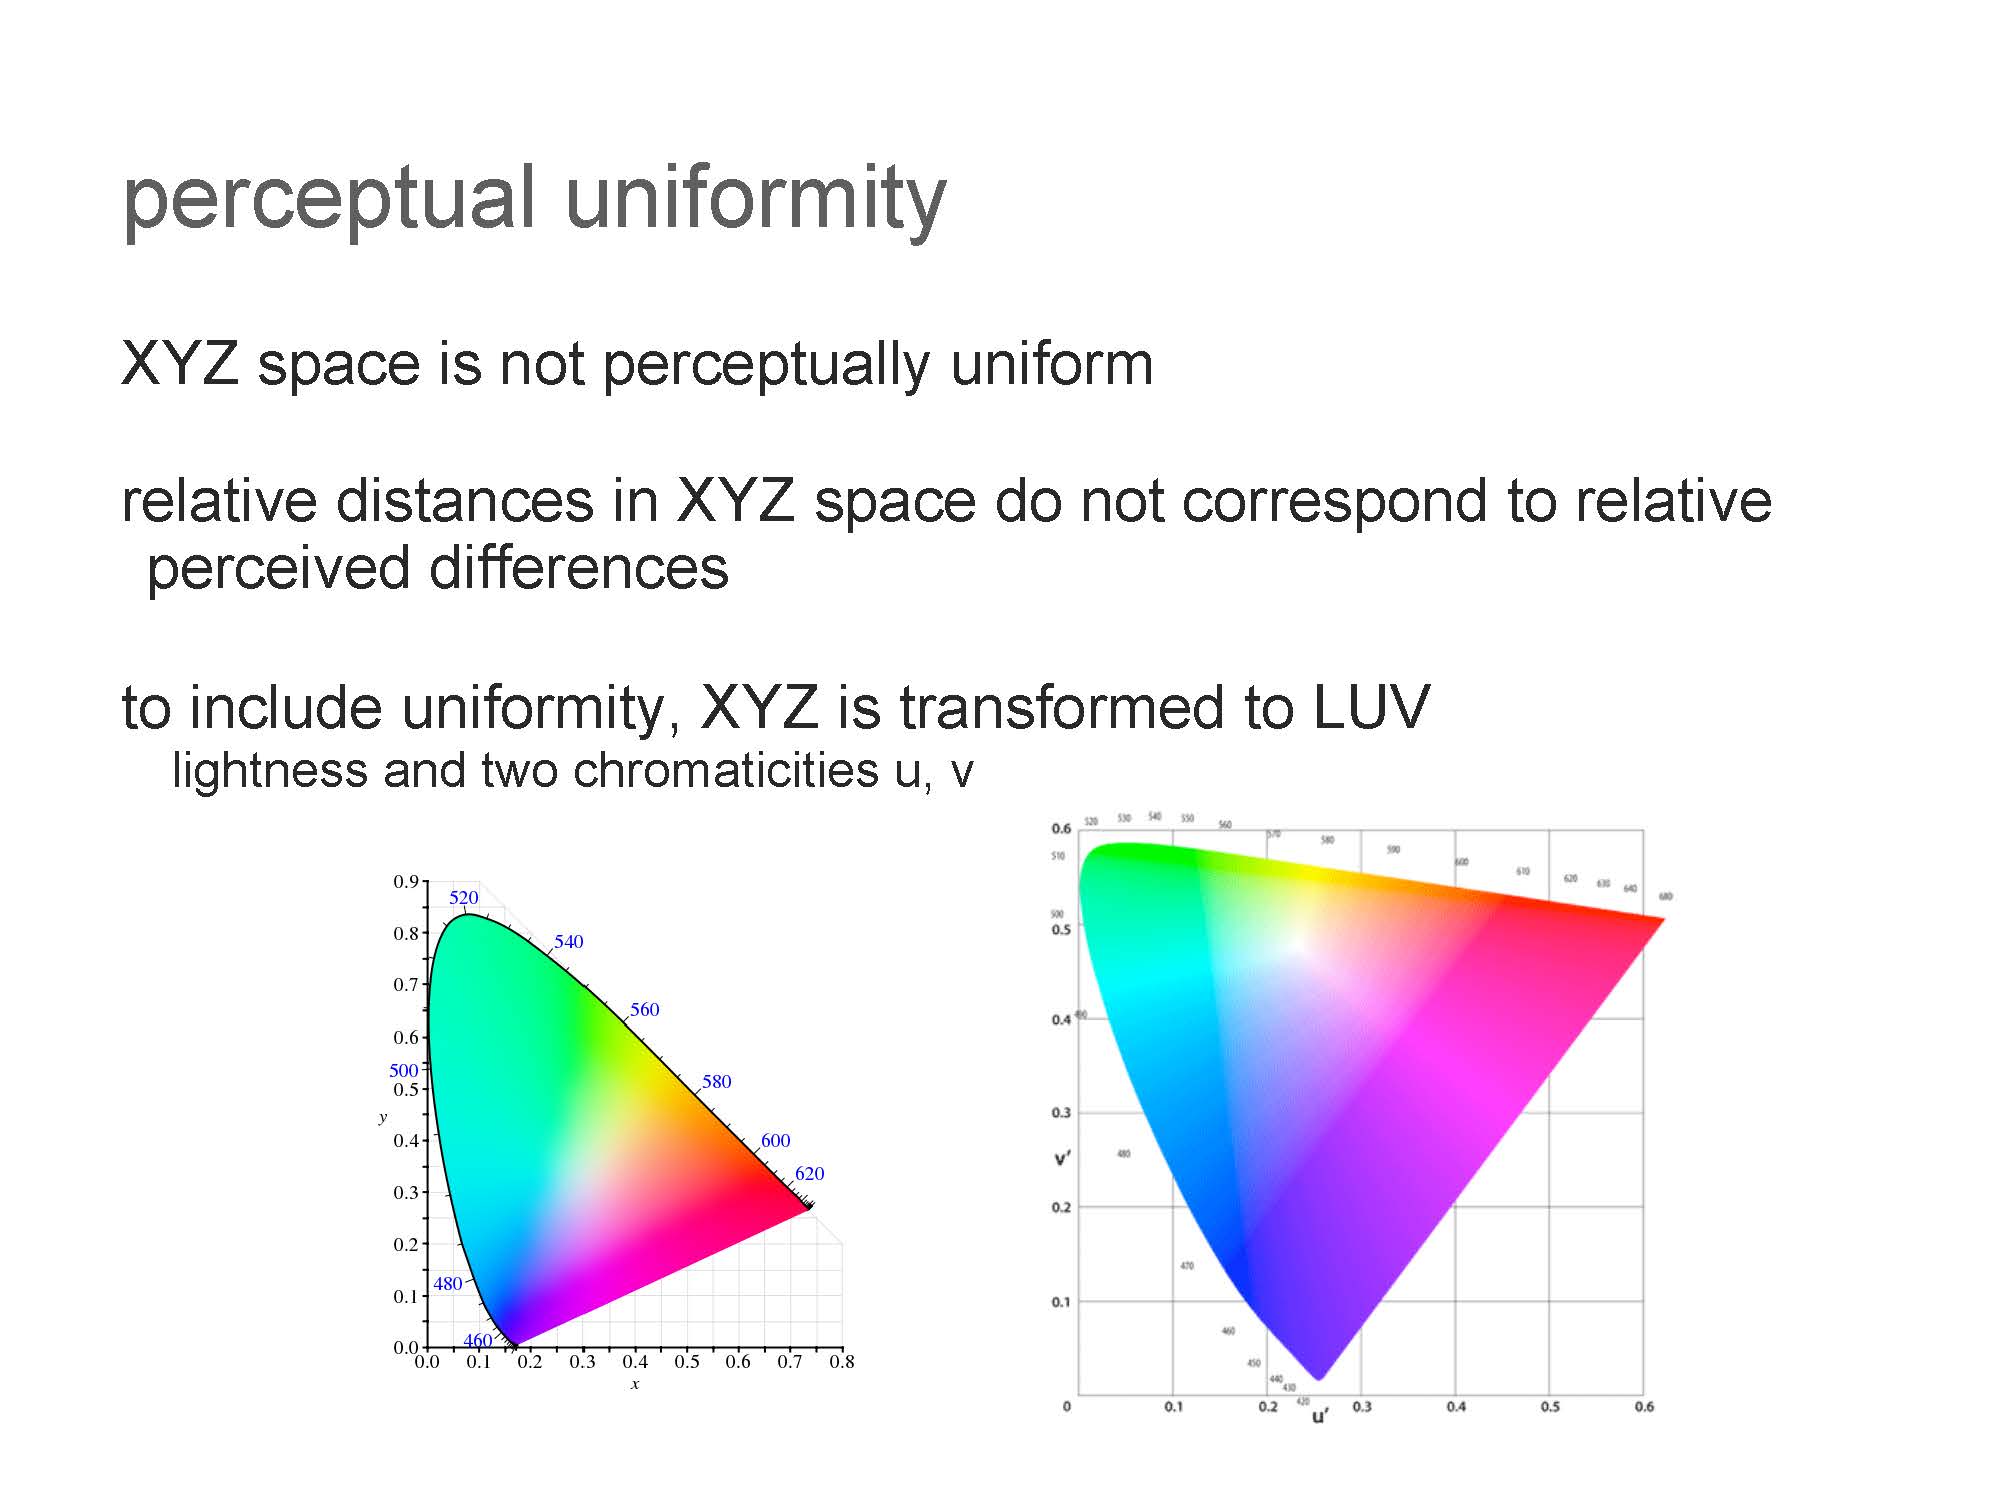
A color space that is perceptually uniform defines colors based on how we perceive them. Distances between colors in the space are proportional to their perceived difference.
Above, we saw that HSV was not perceptually uniform. Moving the hue slider by 60 can have a small or large effect on a color, depending on where the slider is positioned.
Consider the following example. You have a chart that uses two colors, and orange and green. Both were chosen with `S=V=1`. You now need to select a second color for each that is brighter. You cannot directly use HSV because both orange and green colors are already at full value. How do you intuitively increase brightness?
The reason why you cannot in do this in HSV is because `V` does not directly correspond to the color's perceived brightness. You are stuck fiddling with the saturation and value to try to select a brighter pairing.
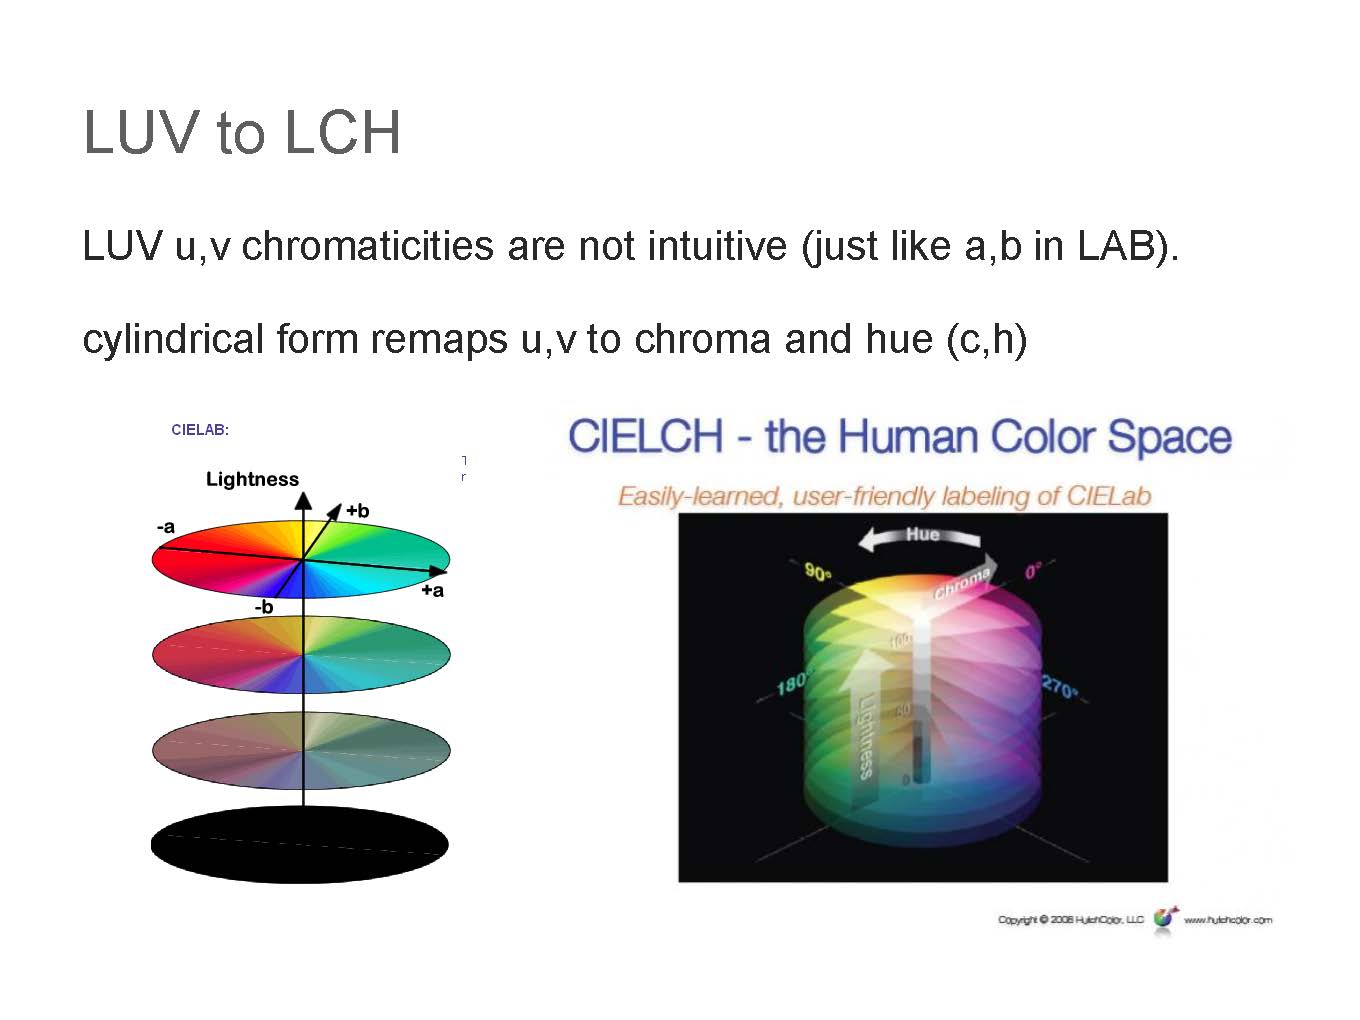
What would be useful here is a color space which uses the intuitive parameters of HSV, but is perceptually based. In other words, instead of value, the space would define a color based on its perceived brightness. Luckily, this space exists — LCH, which defines color based on its luminance (perceived brightness), chroma (purity) and hue. Unfortunately, design and presentation software do not have LCH sliders and we cannot easily take advantage of this color space.
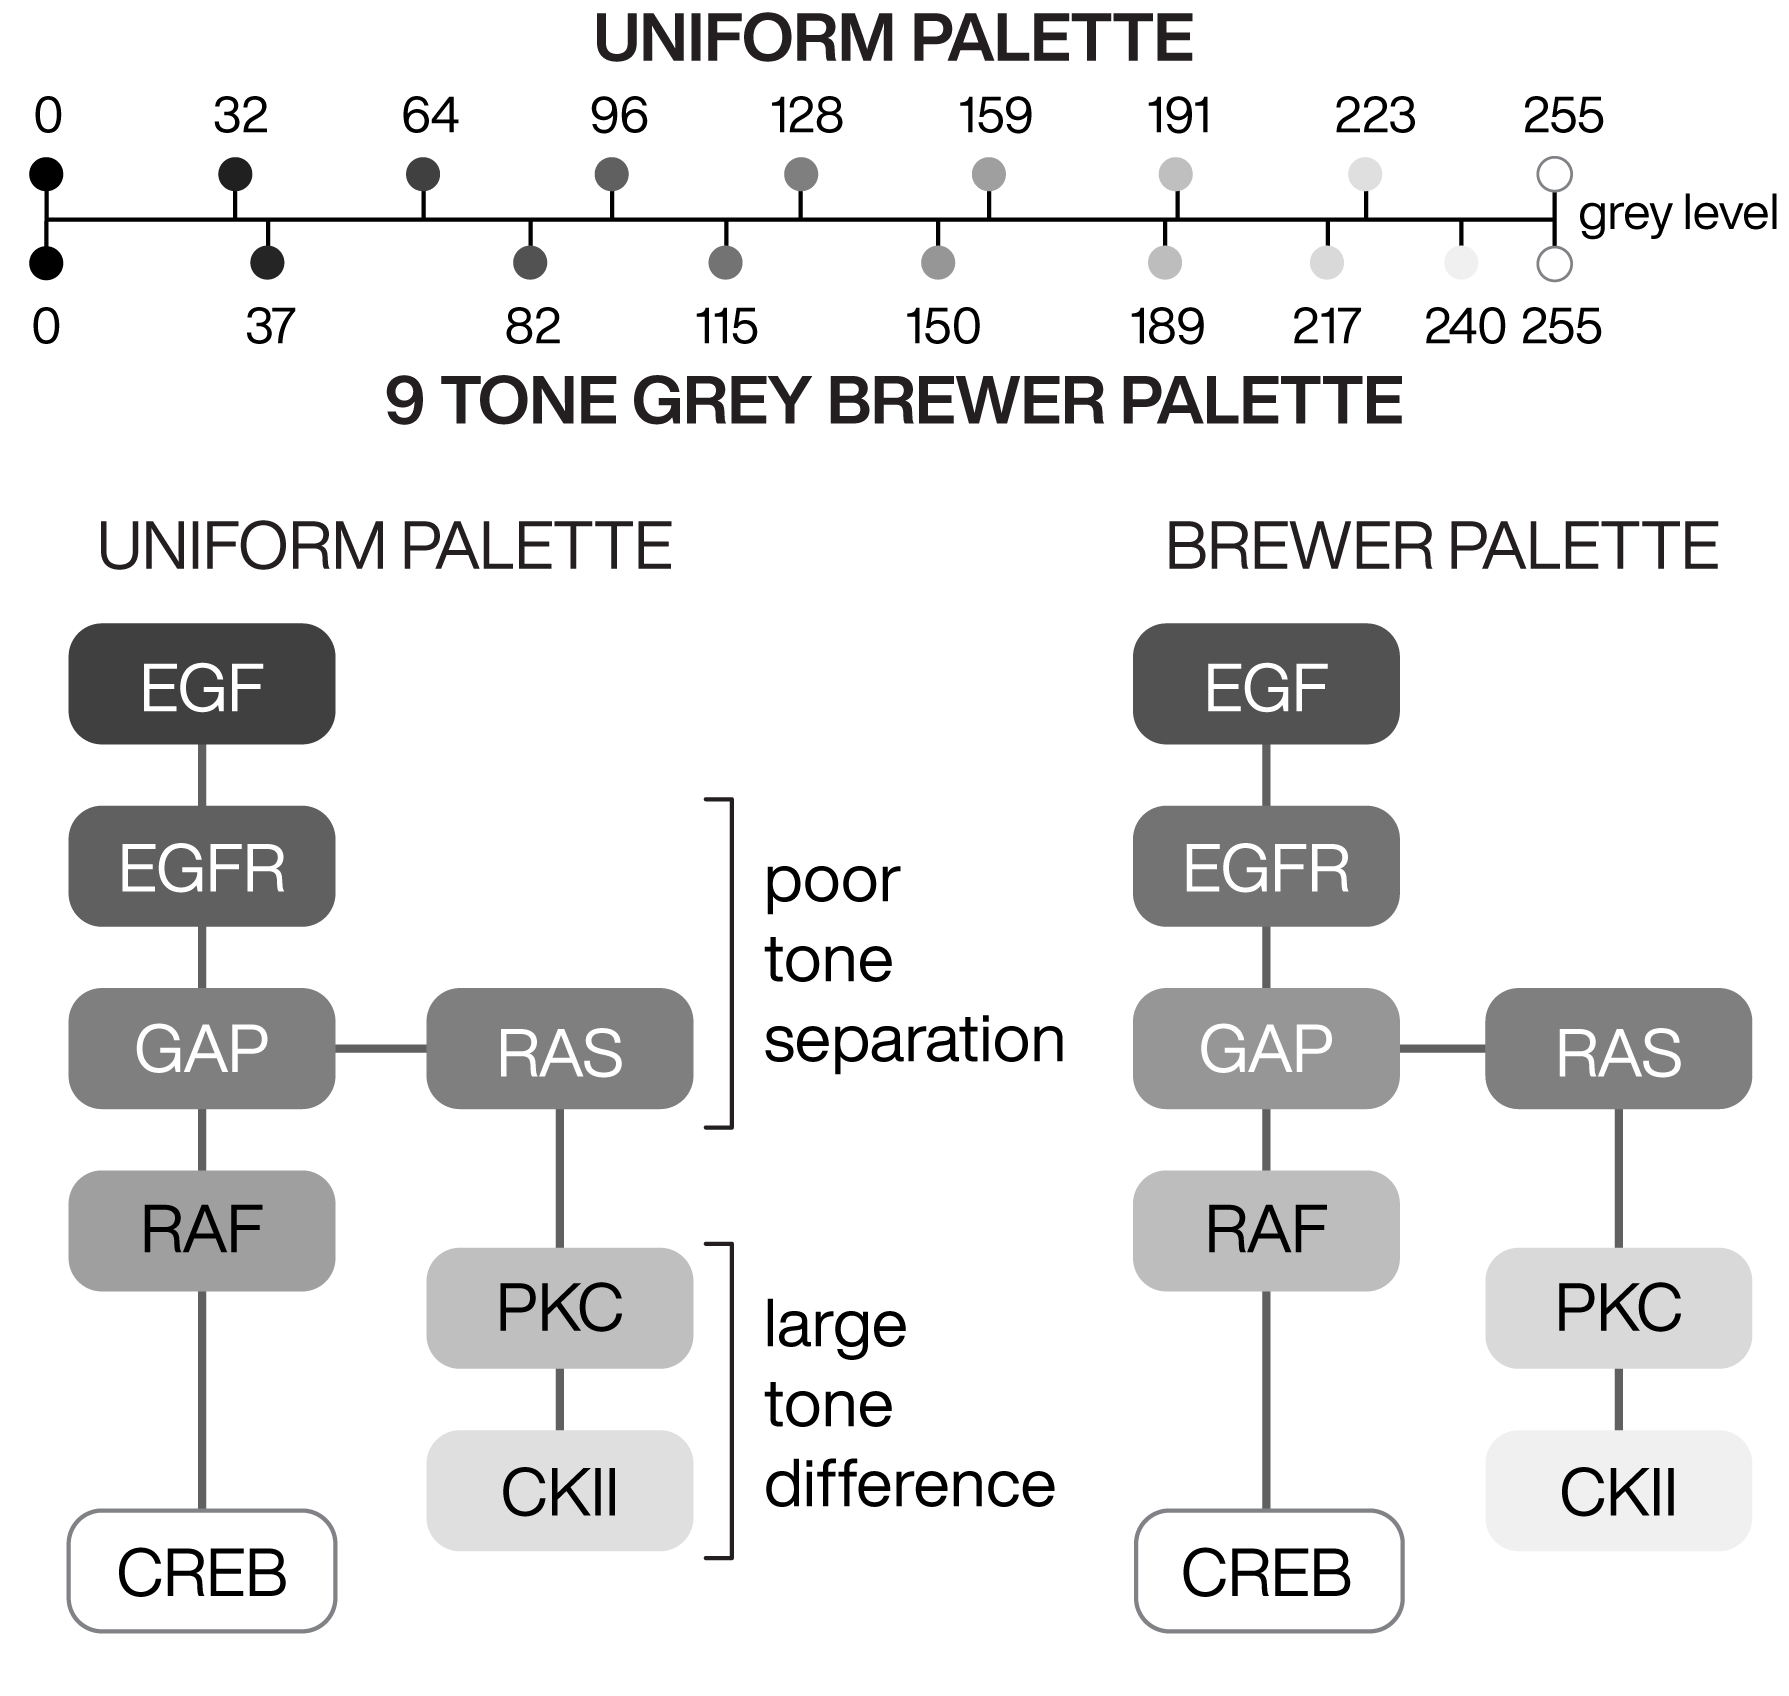
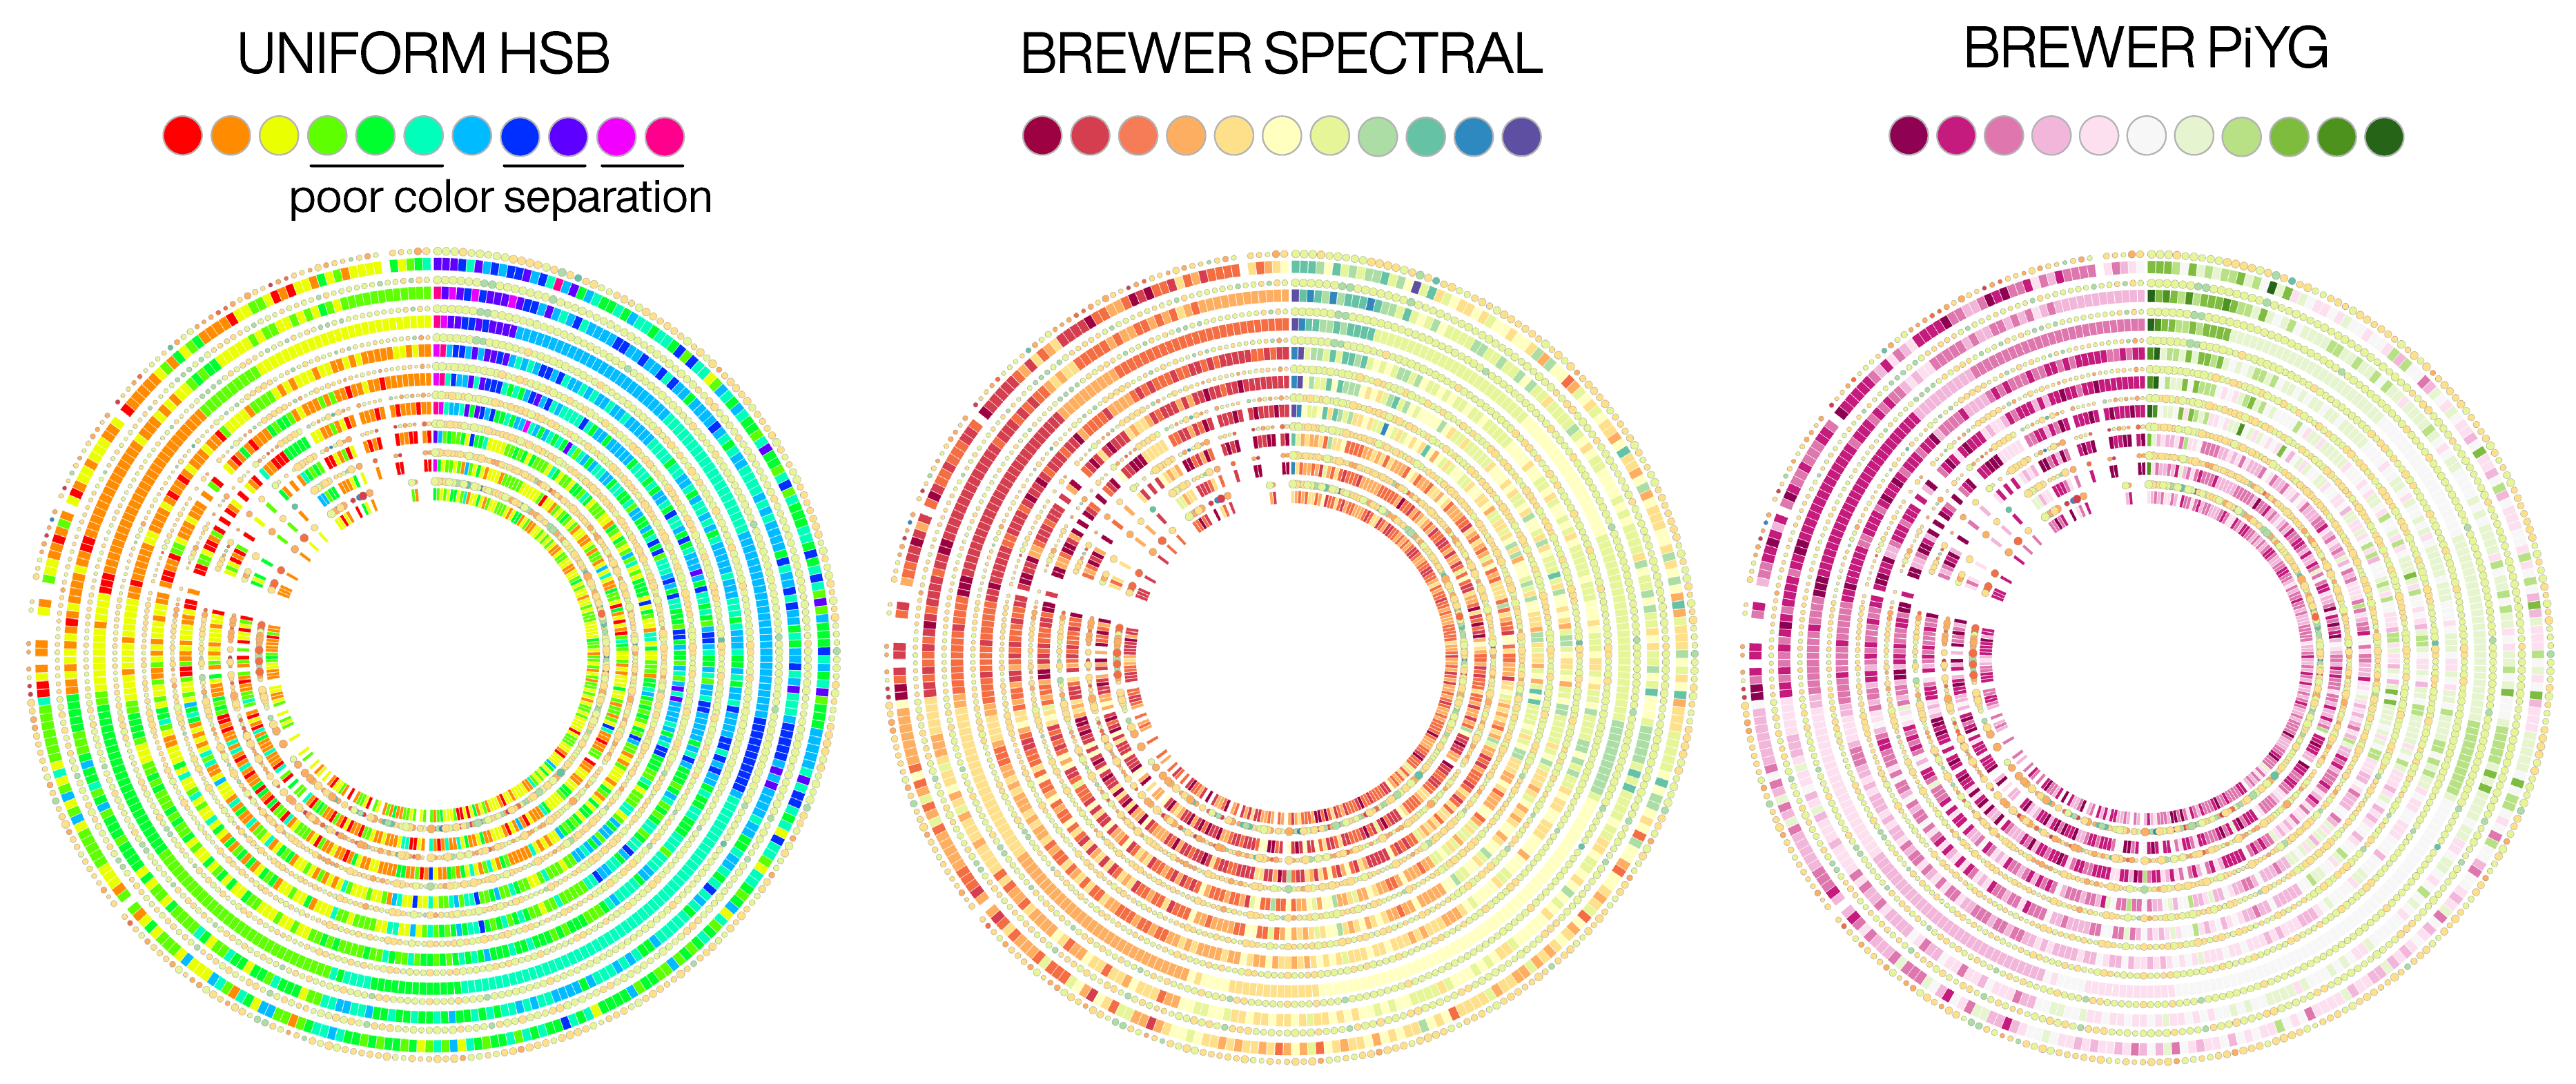
This is where the Brewer palettes come in. The figure below shows exactly how the 9-tone Brewer grey palette compares to one in which the greys are uniformly sampled in HSV space. Note how smoothly (i.e. uniformly) the greys appear to transition from dark to light in the pathway on the bottom right.
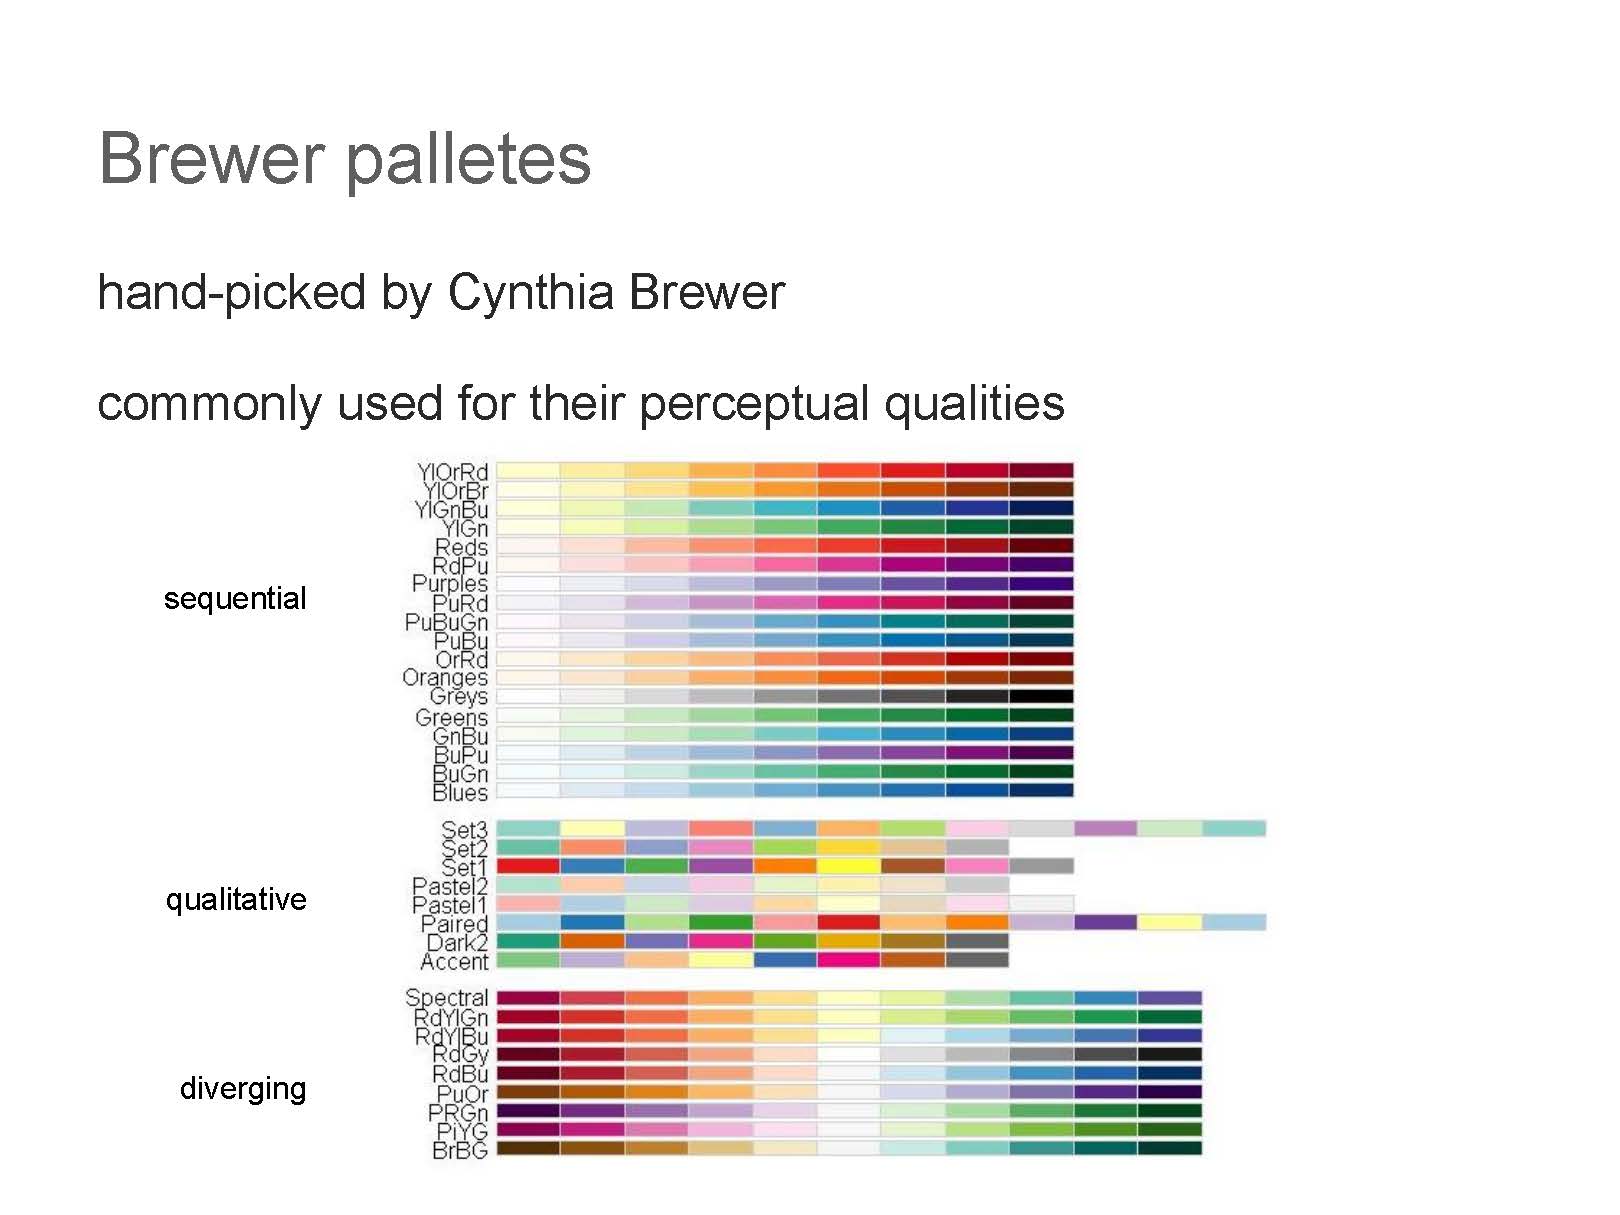
Brewer palettes were selected for their perceptual properties. These palettes were created by Cynthia Brewer for the purpose in cartography, but have found use in other fields.
There are three types of Brewer palettes: qualitative (colors do not have a perceived order), sequential (colors have a perceived order and perceived difference between successive colors is more-or-less uniform) and diverging (two back-to-back sequential palettes starting from a common color).
I have prepared Brewer palette swatches in .ase or .ai format. For programming, use the plain-text version.
You can import Brewer palettes into Adobe applications such as Illustrator, Photoshop and InDesign using either the .ase or .ai swatch files.
In Illustrator, load the swatches from the swatch window menu. The swatch window can be accessed using Window > Swatches.
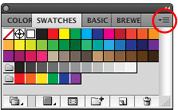
Select Open swatch library
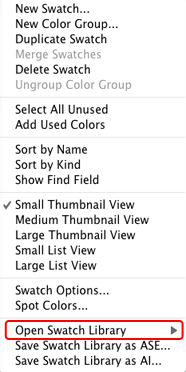
then choose Other library...

and load either the .ase or .ai file — both contain the same content.
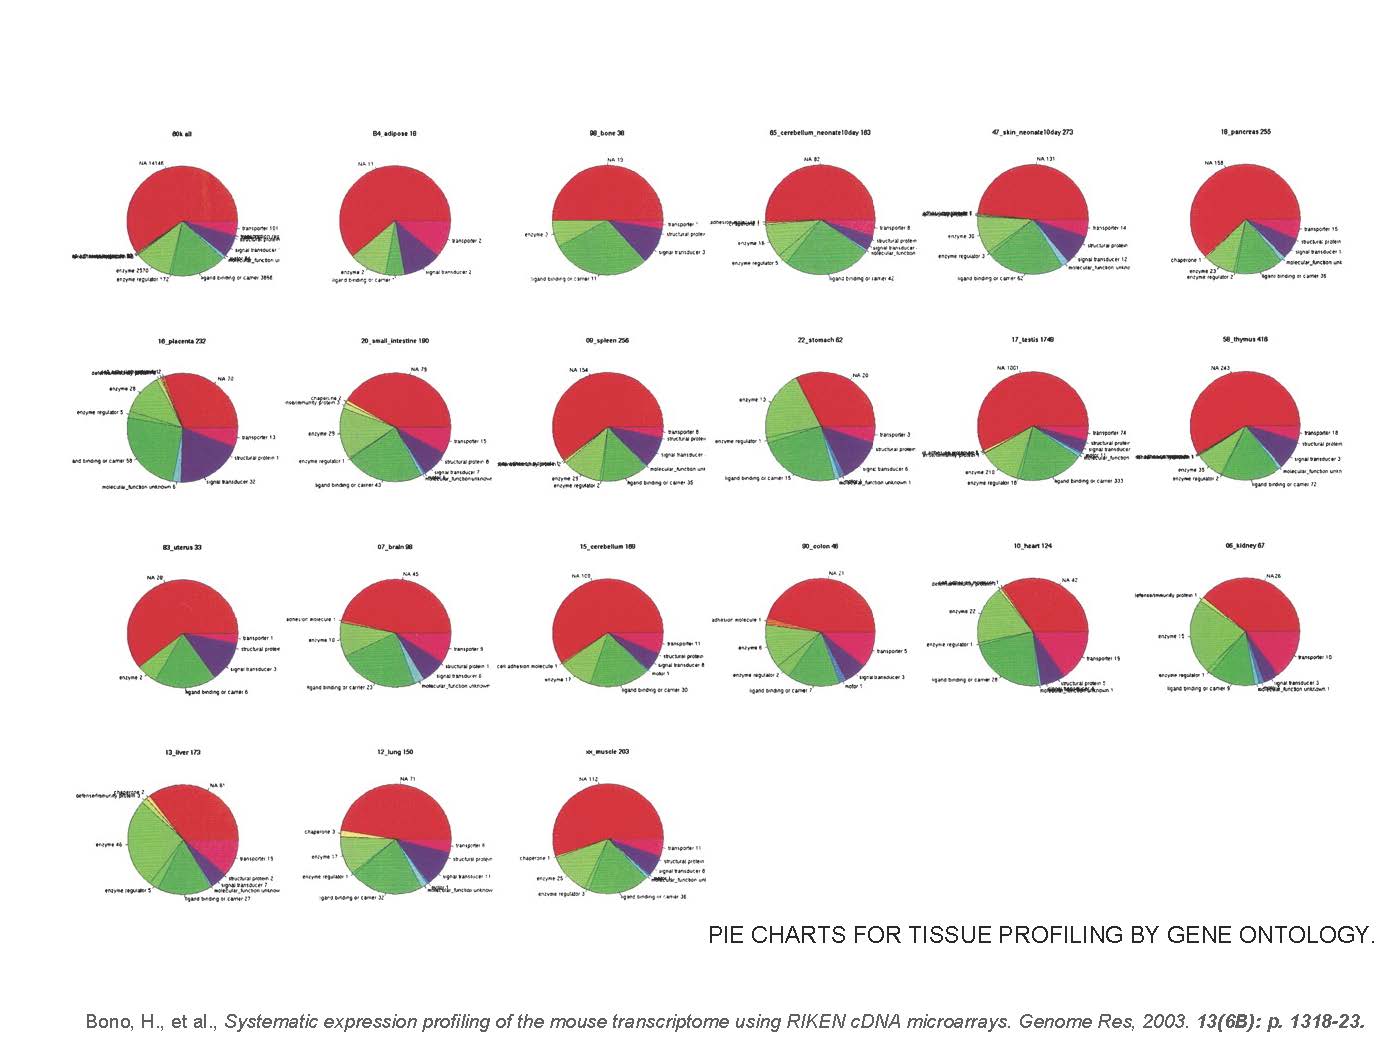
Qualitative palettes are excellent for bar plots and pie charts, where colors correspond to categories.
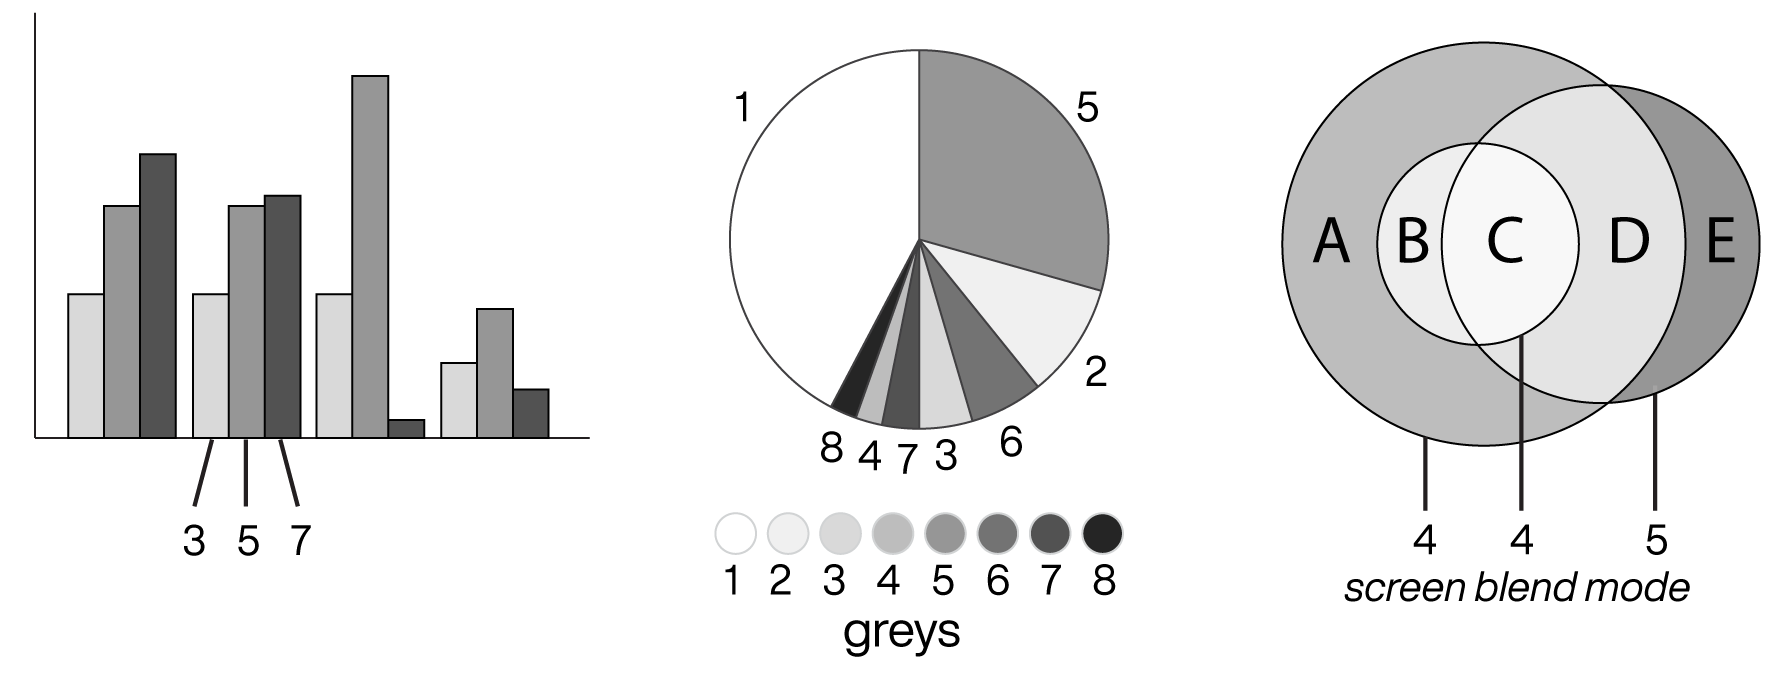
Grayscale Brewer palettes are available and are perfect for achieving good tone separation in black-and-white figures.
Sequential and diverging palettes are useful for heatmaps.
Some Brewer palettes are safe for color blindness — the pink-yellow-green (PiYG) is one. For others, see colorbrewer.
I have designed 15-color palettes for color blindess for each of the three common types of color blindness.
Why Should Engineers and Scientists Be Worried About Color? by Bernice E. Rogowitz and Lloyd A. Treinish (IBM Thomas J. Watson Research Center, Yorktown Heights, NY).
Perception in Visualization by Christopher G. Healey (Department of Computer Science, North Carolina State University) (source).
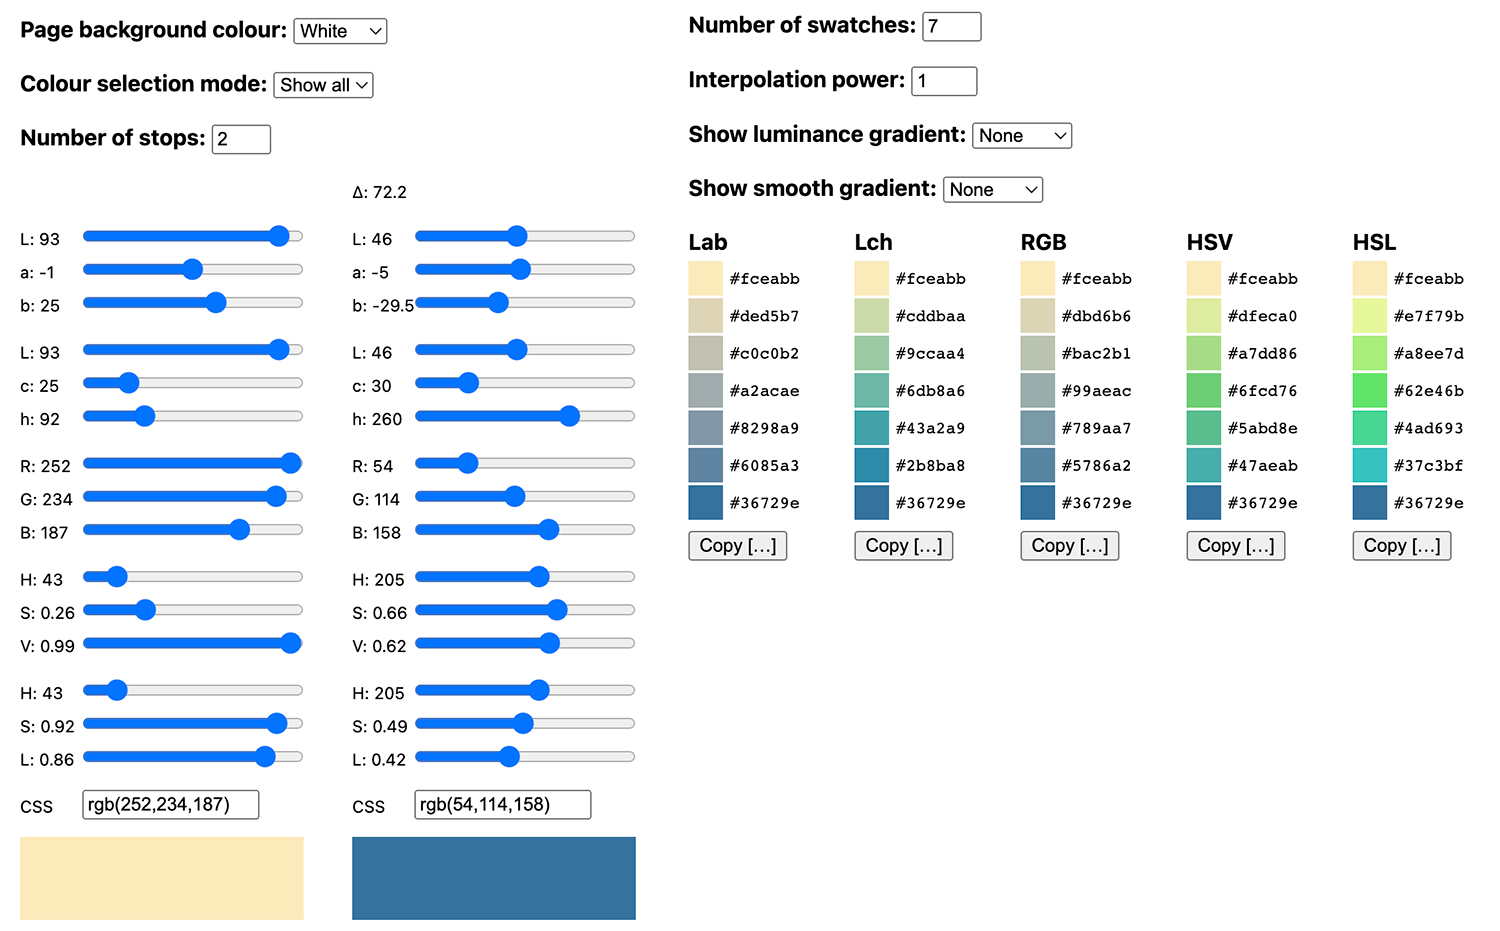
LCH and LAB colour and gradient picker is a great tool by David Johnstone. It's a great way to generate color ramps—go ahead, go crazy!—and compare how the ramps look in different color spaces. Shame on you, HSV!
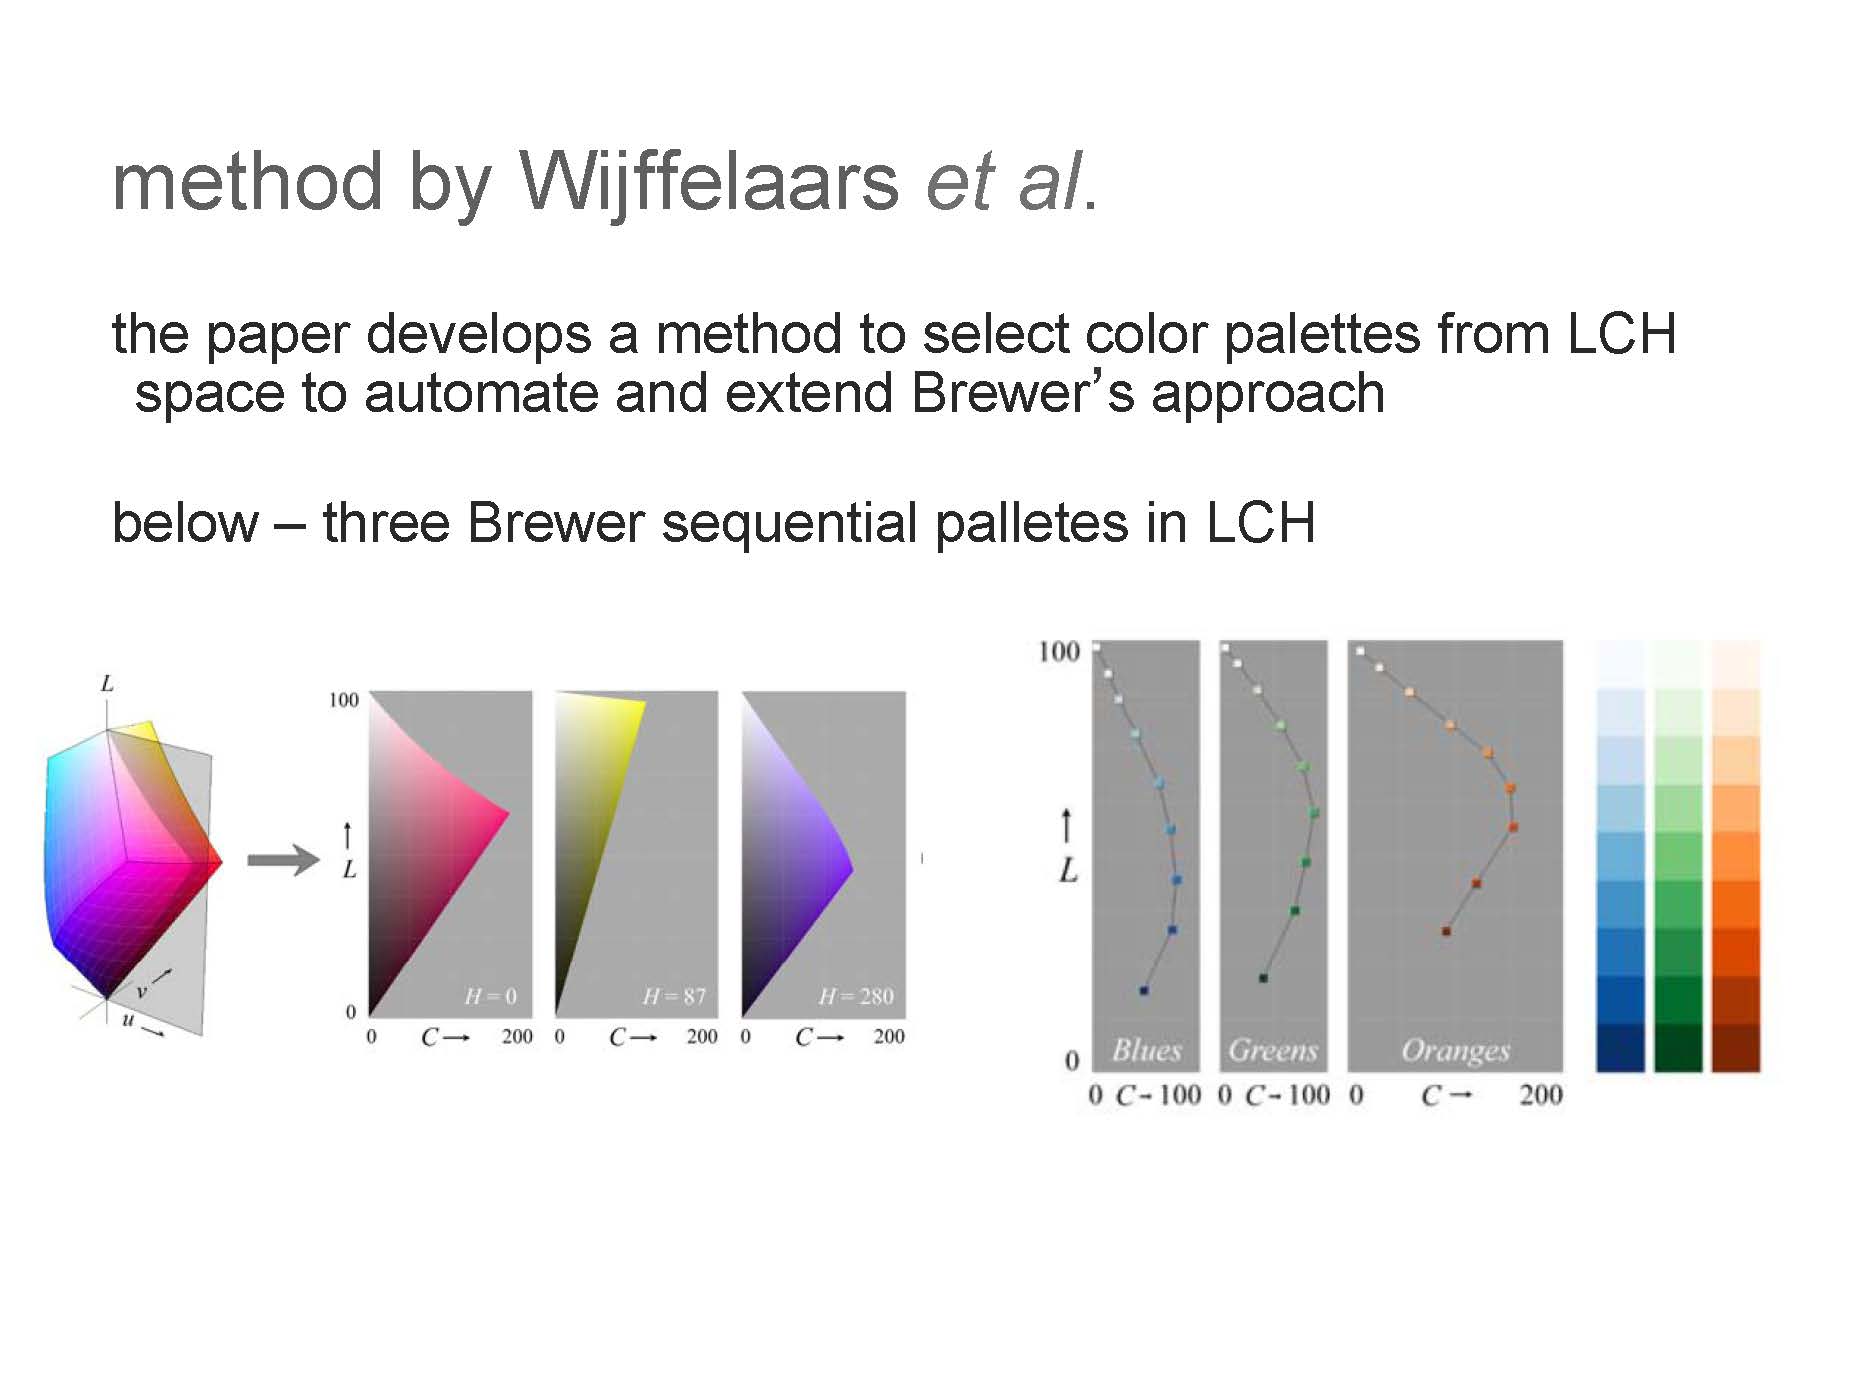
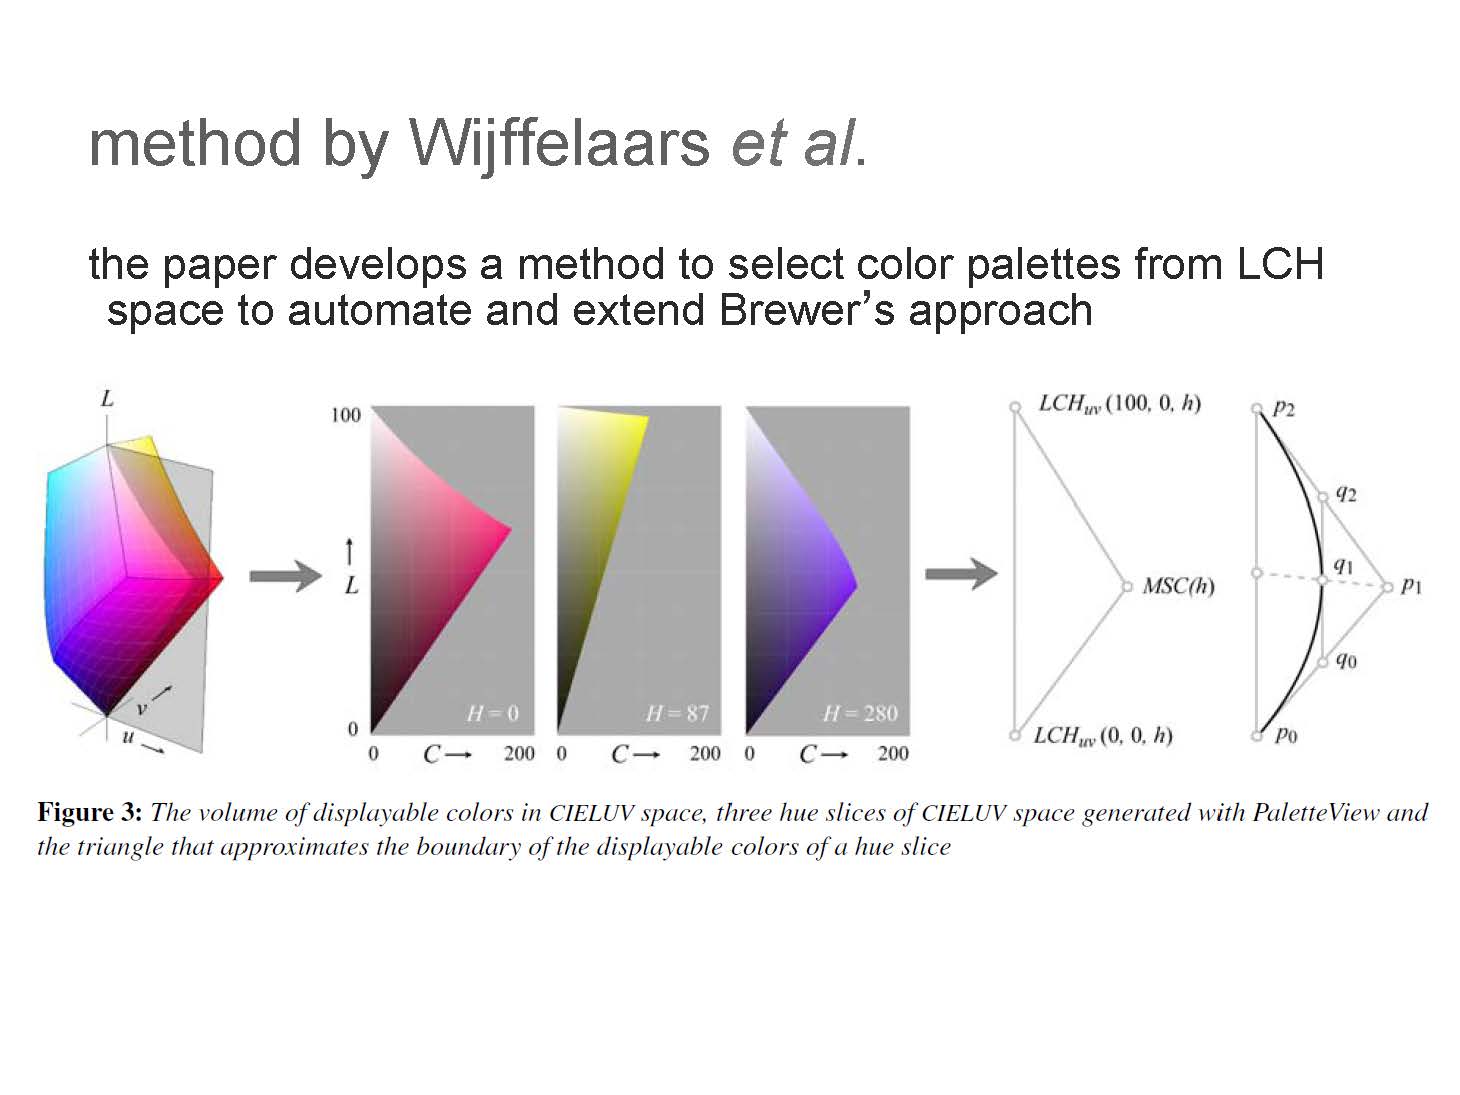
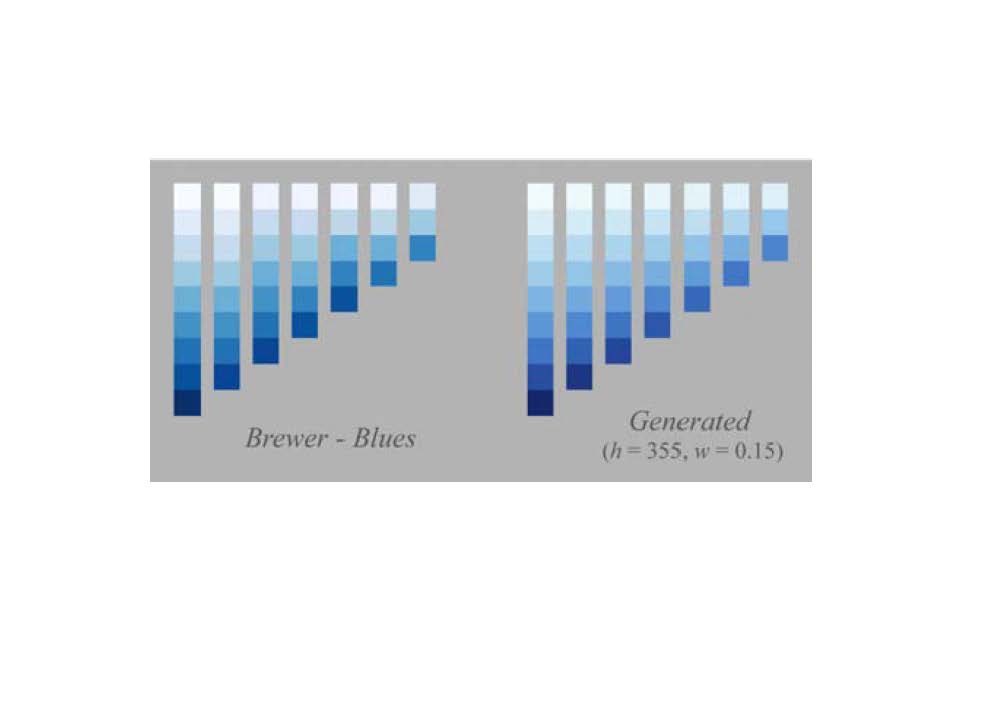
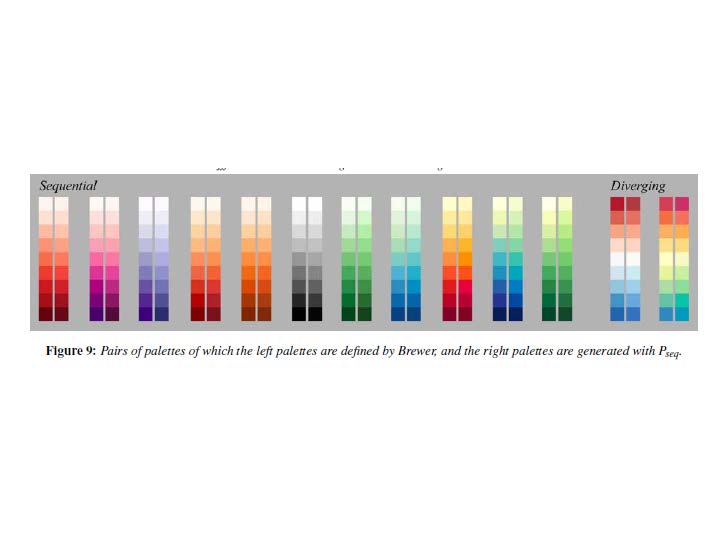
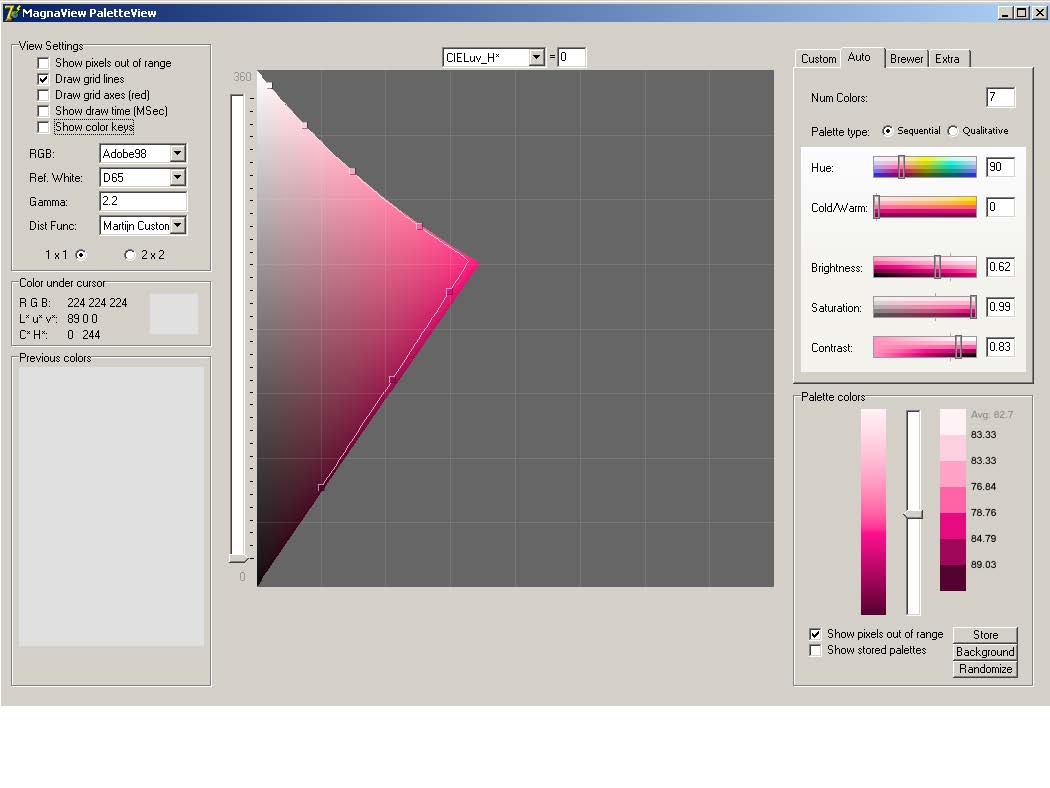
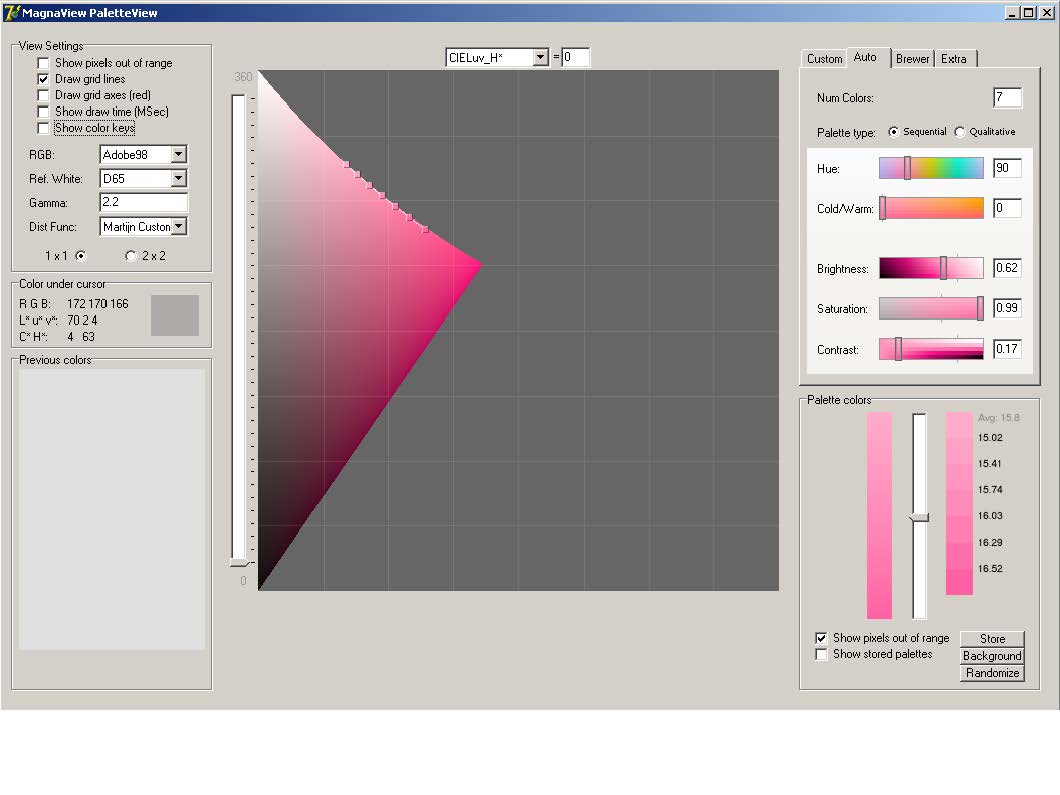
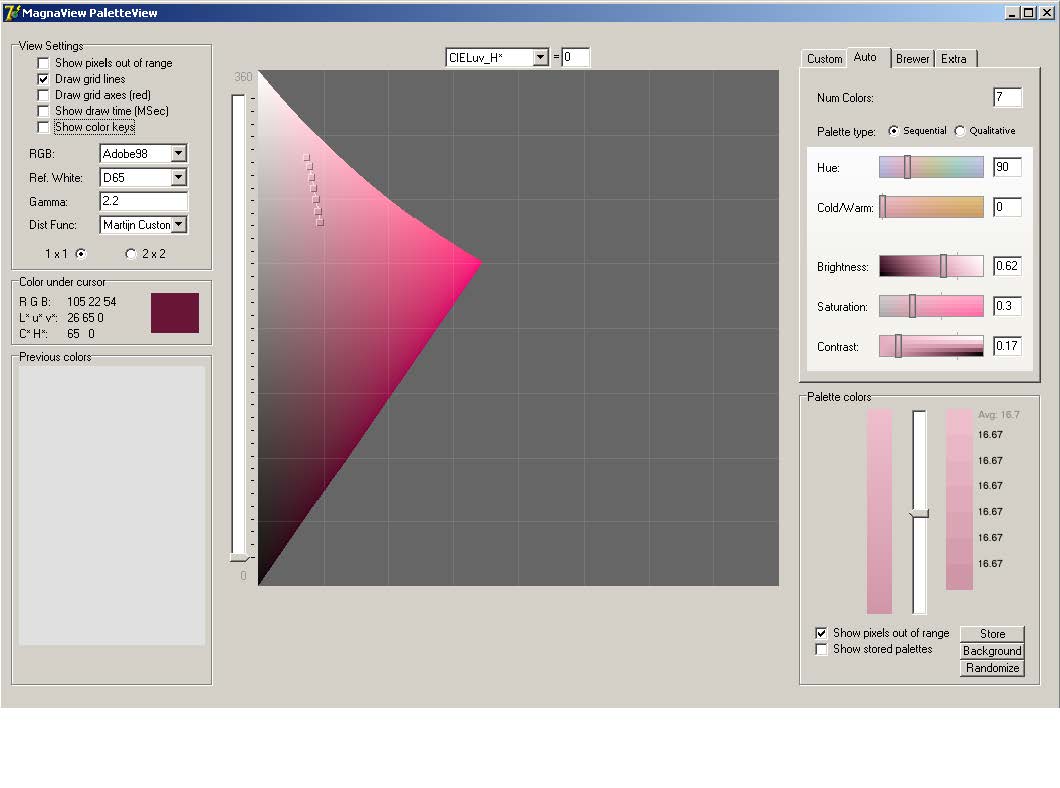
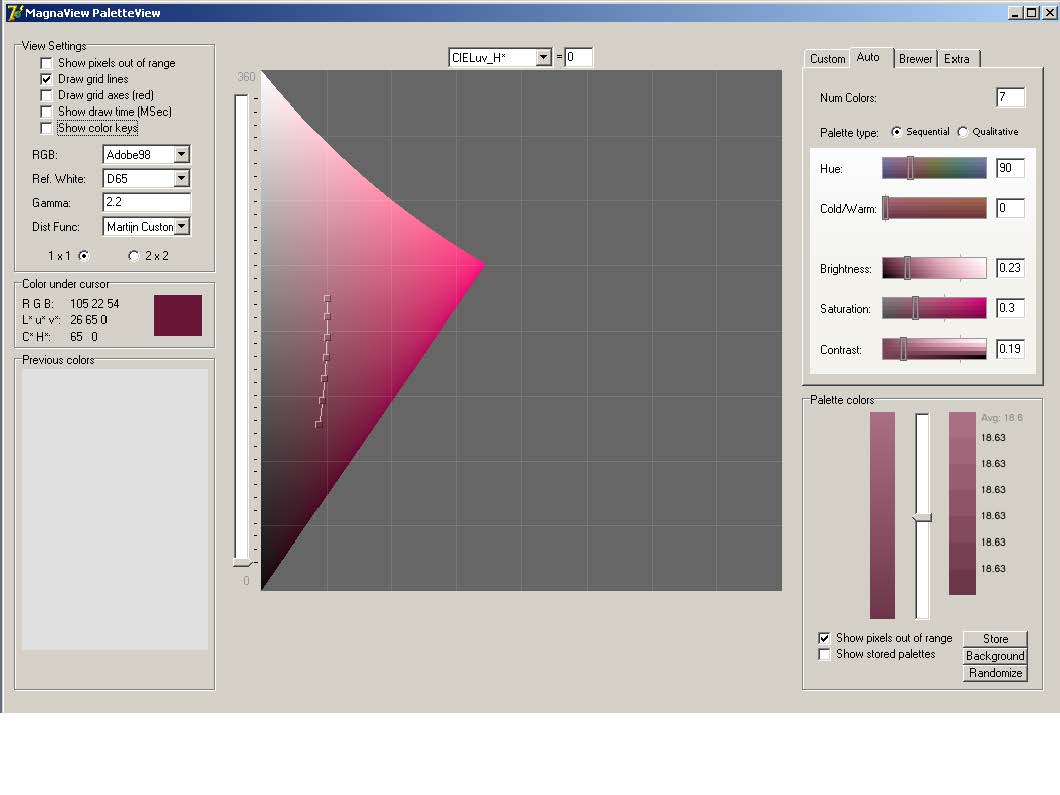
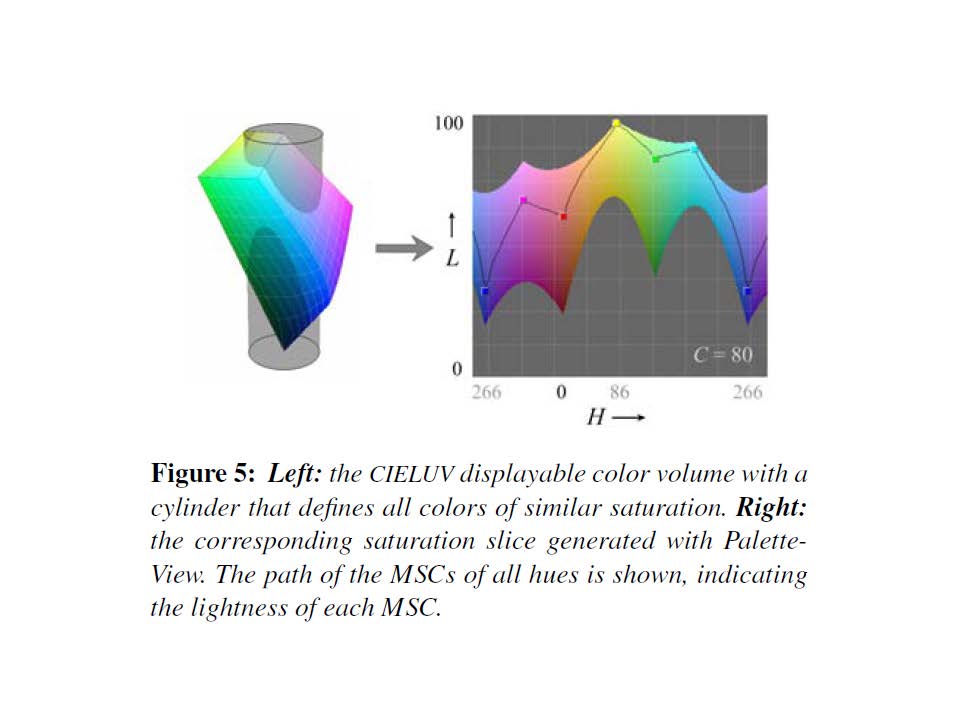
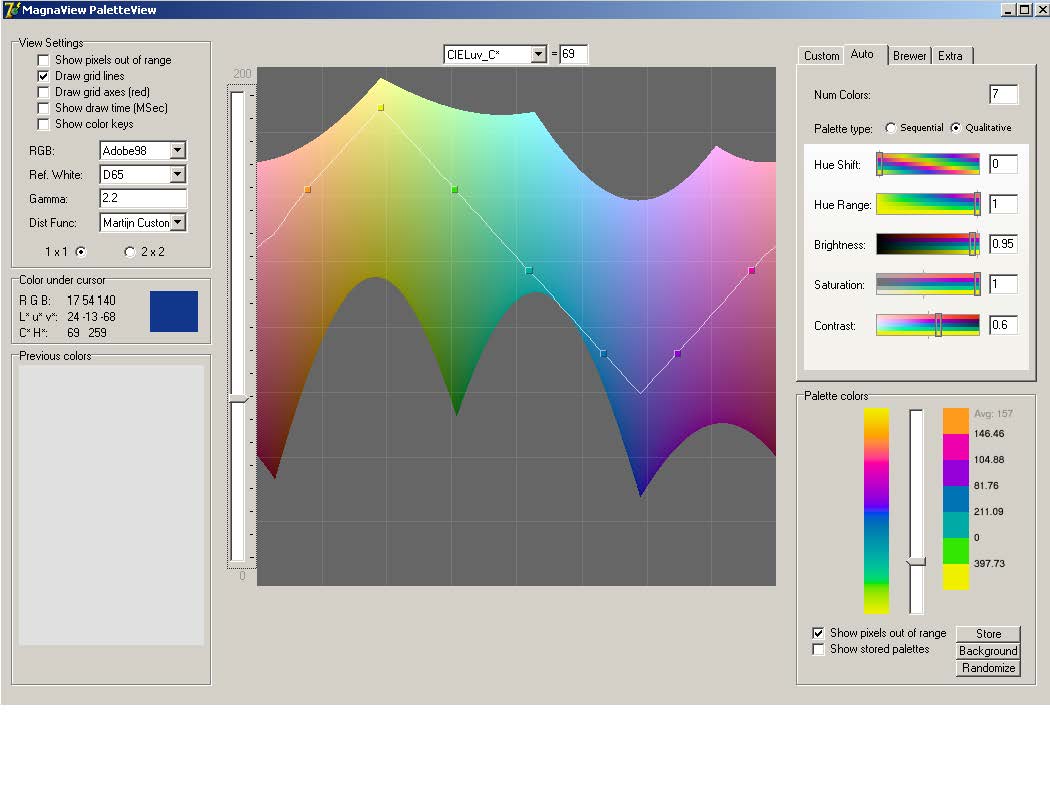
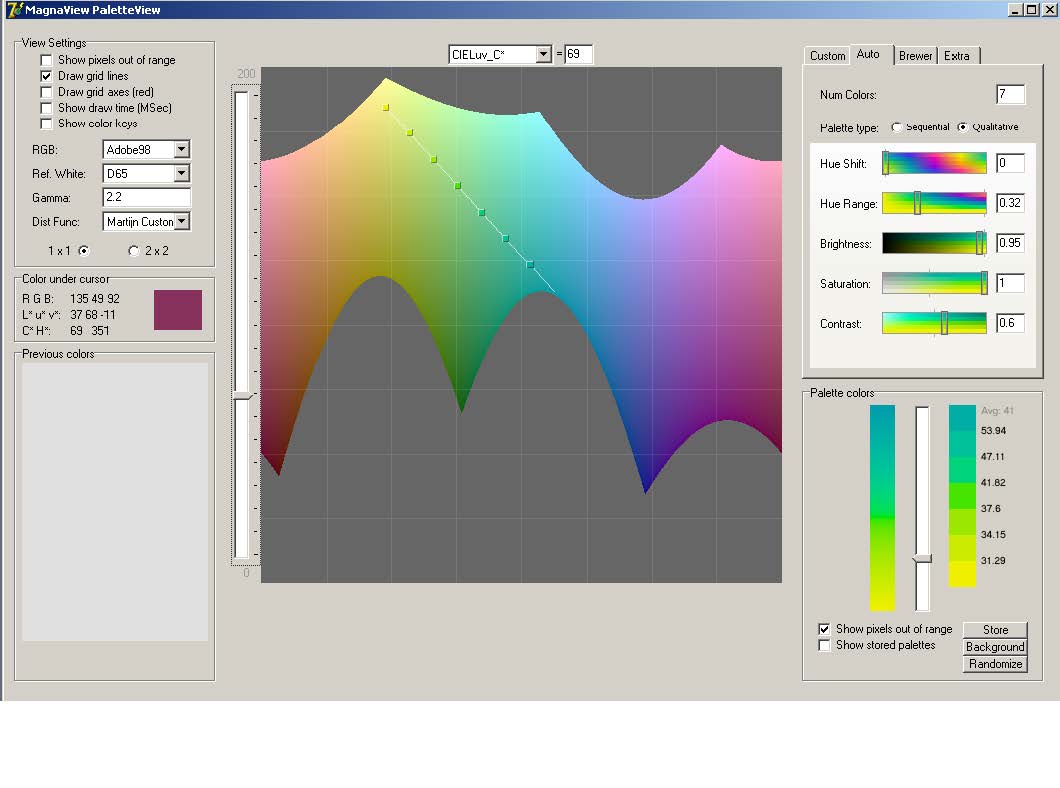
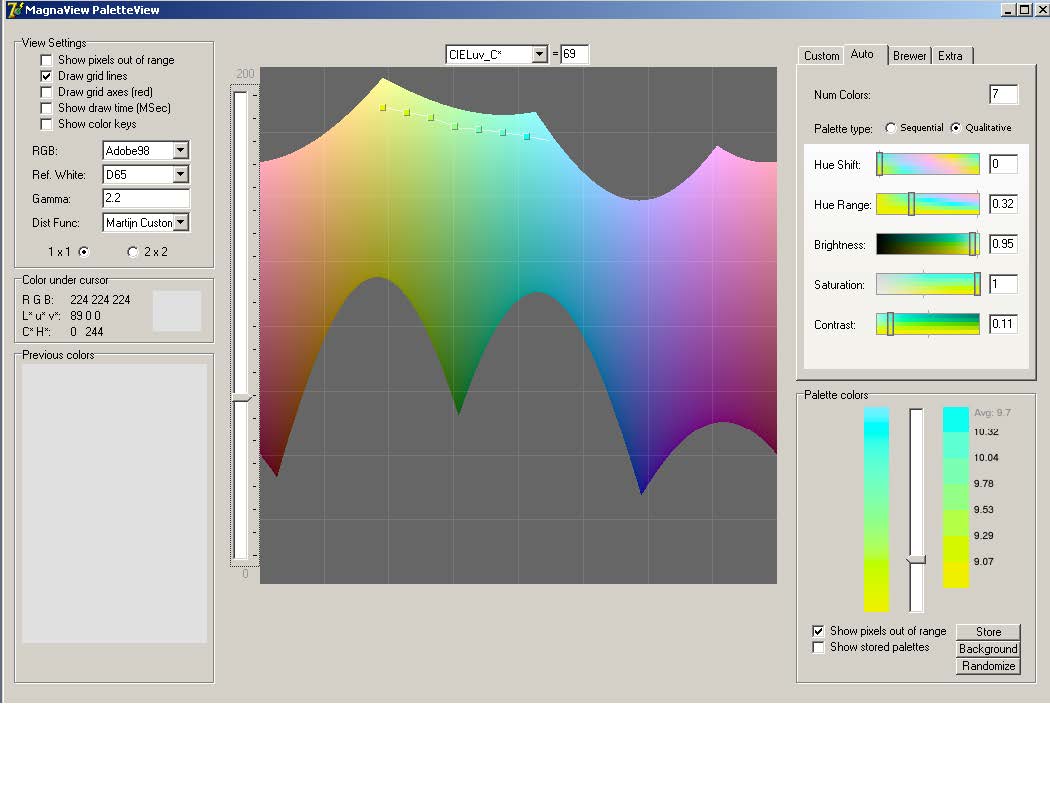
PaletteView is an exceptional tool by Magnaview to create continuous Brewer palettes. This tool is described in [1] and operationalizes Cyntha Brewer's color selection method into an algorithm that selects customizable color palettes from LCH space.
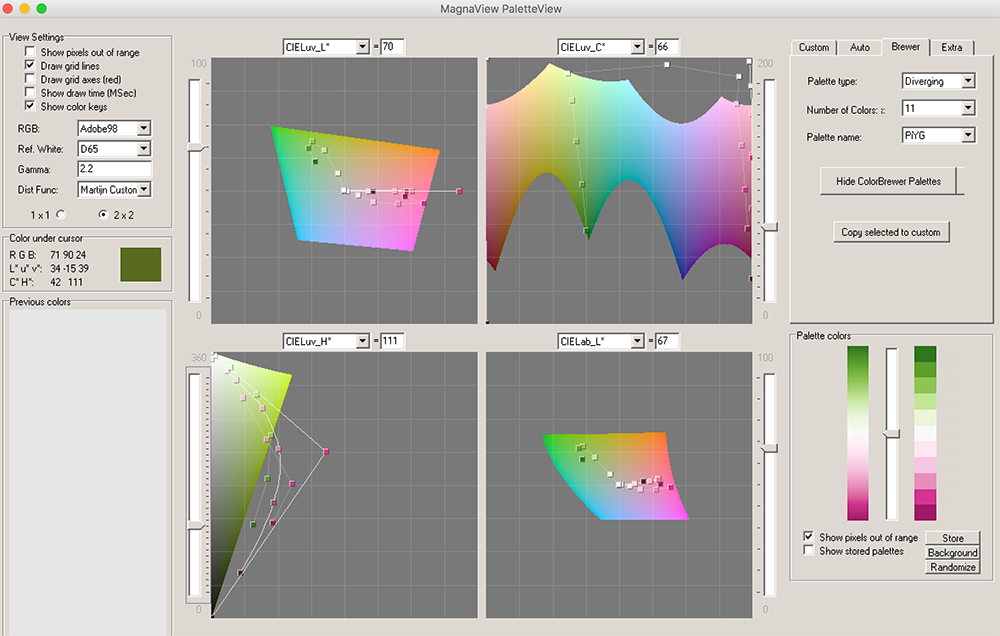
PaletteView itself is an old application. Recently, its methods have been implemented online as gencolormap v2.1 by Martin Lambers [2].
[1] 2008 Generating Color Palettes using Intuitive Parameters Computer Graphics Forum 27:743-750 (source).
[2]