
design + visualization
VIZBI 2013 Keynote
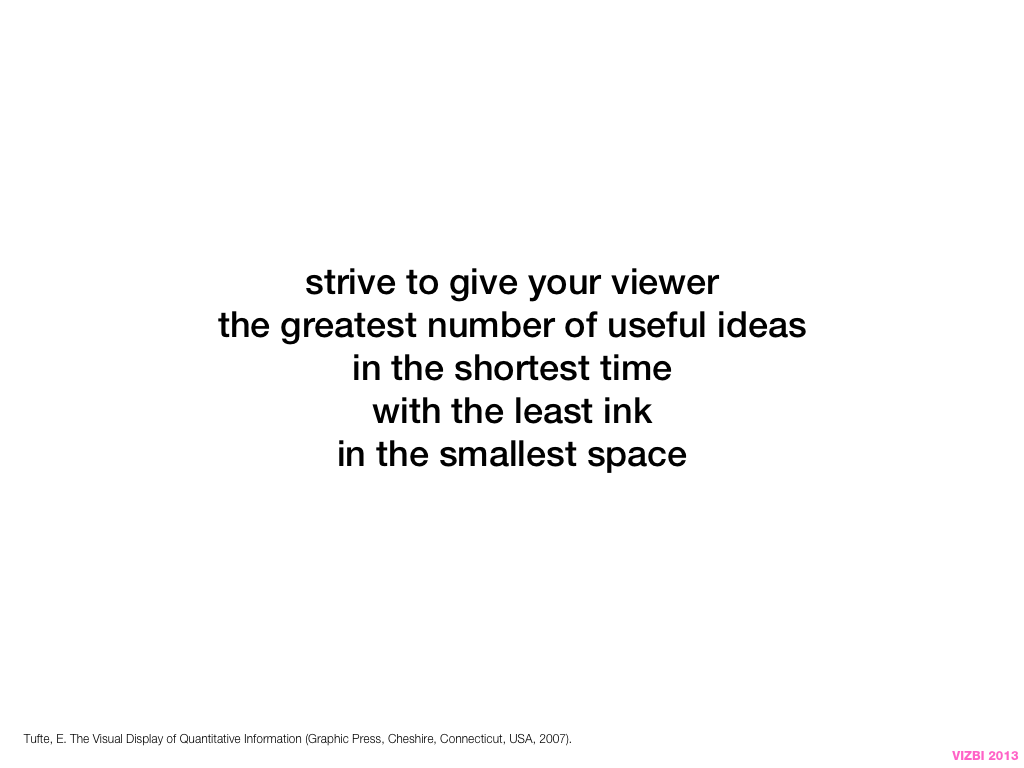
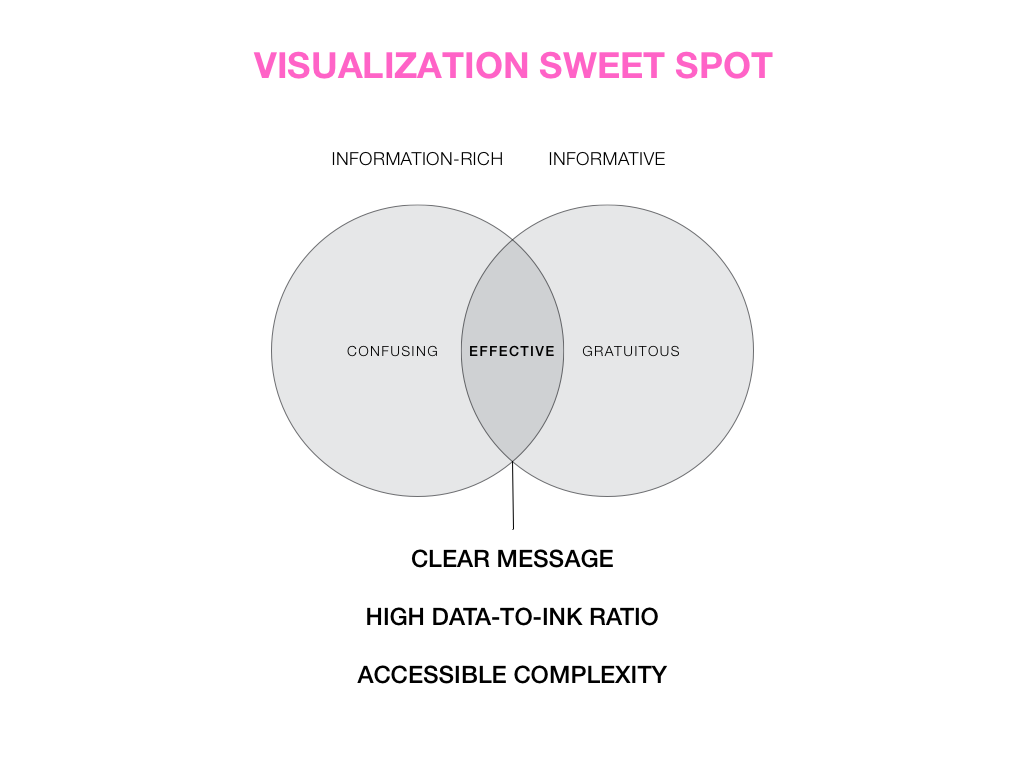
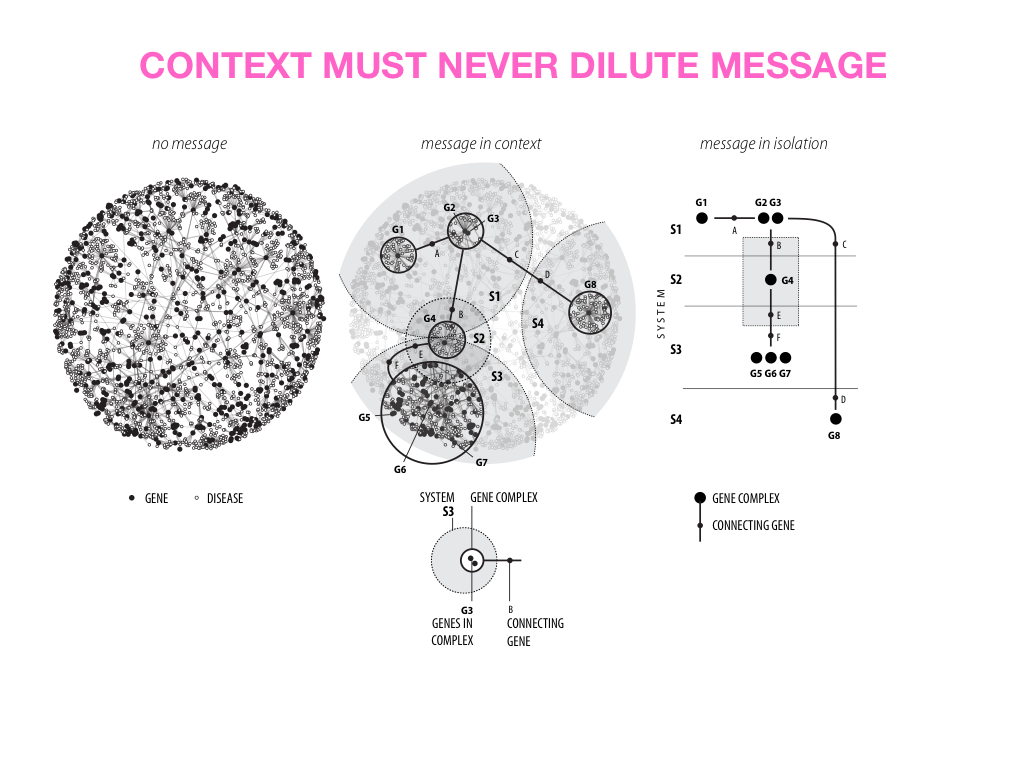
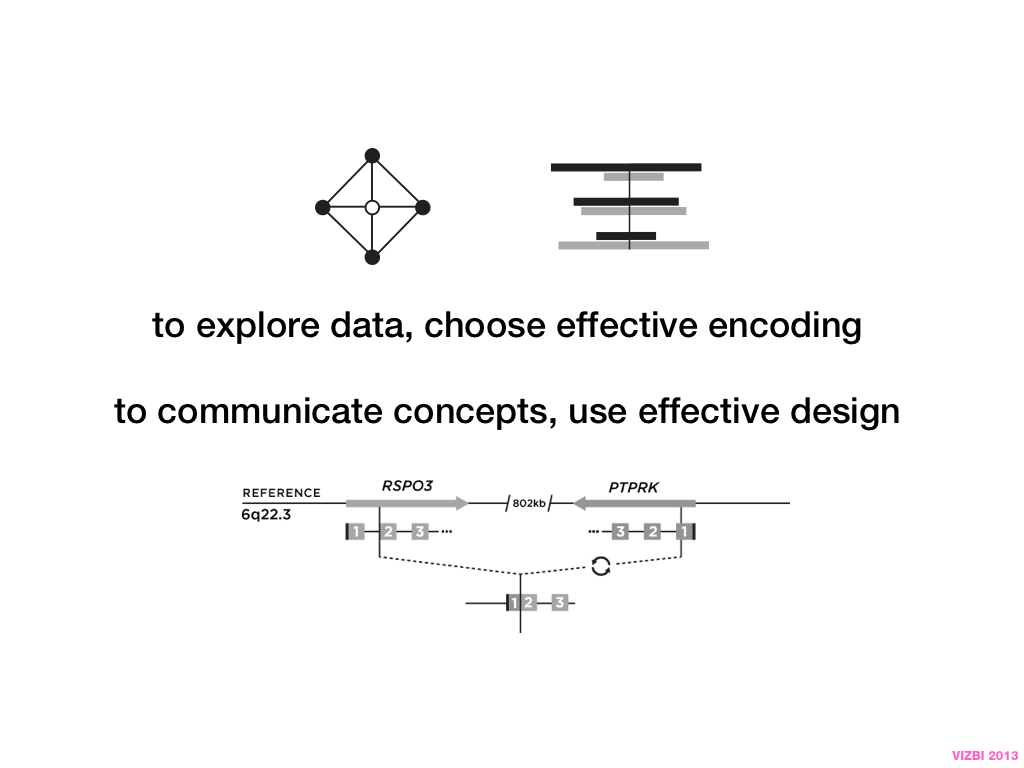
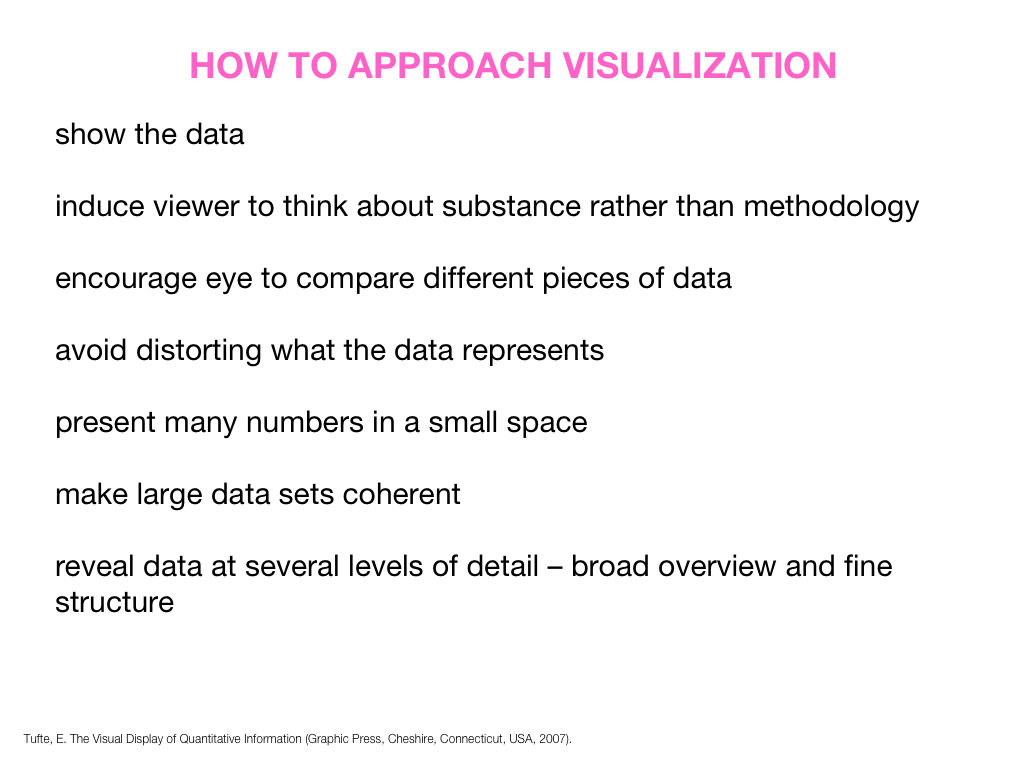
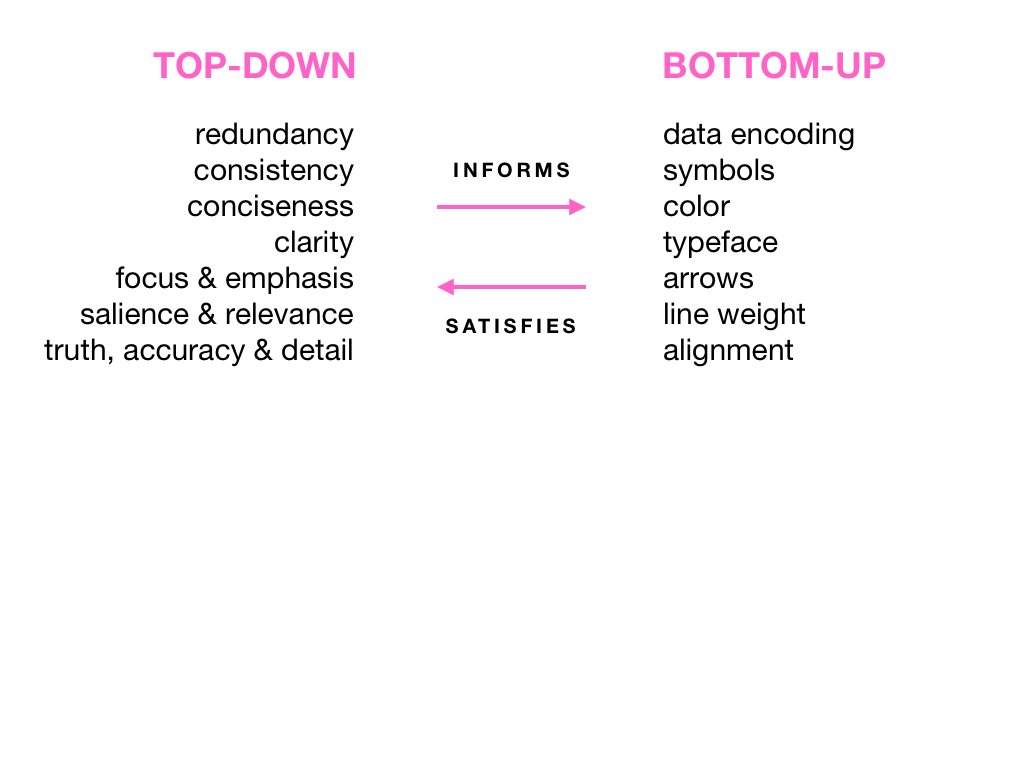
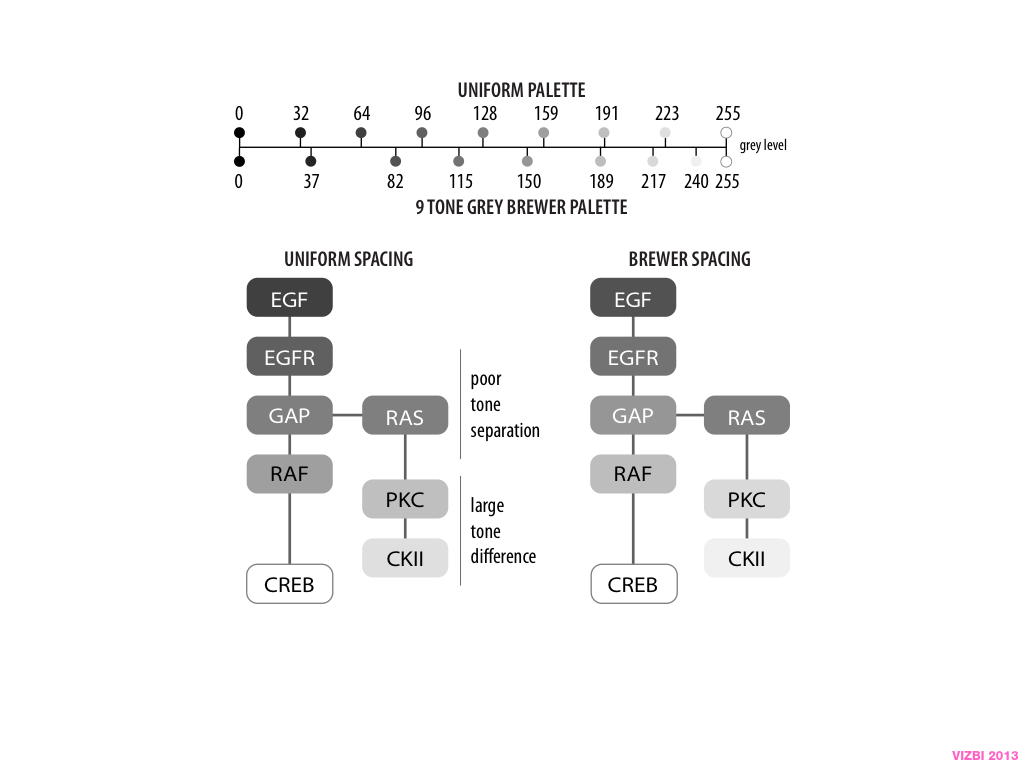
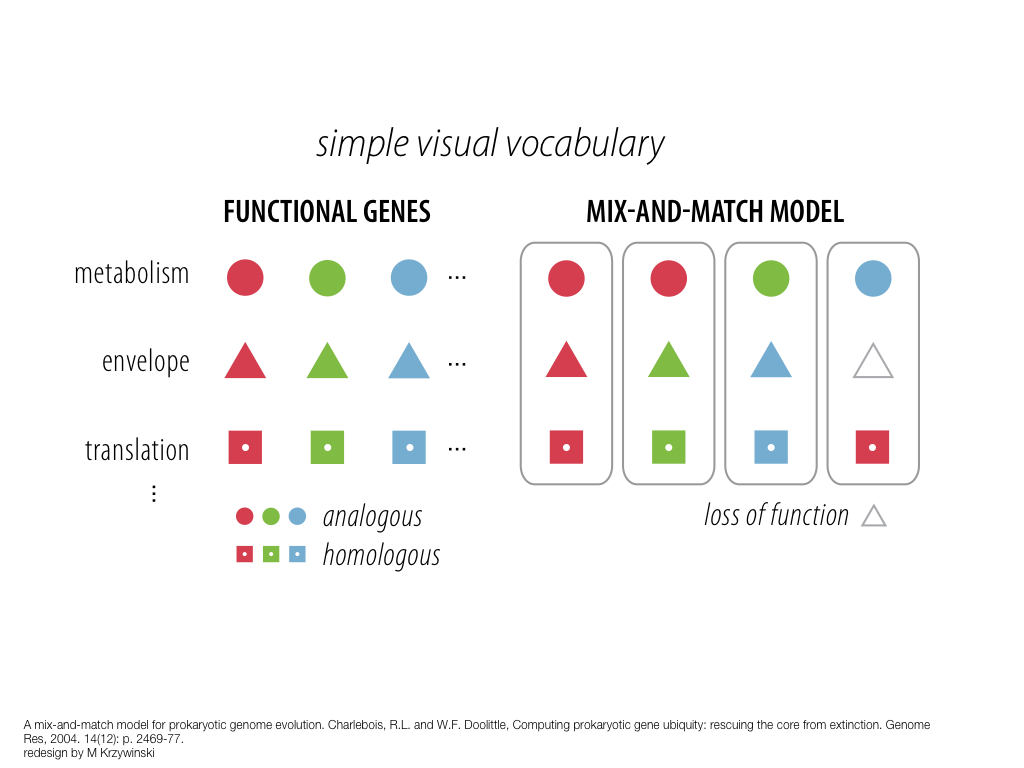
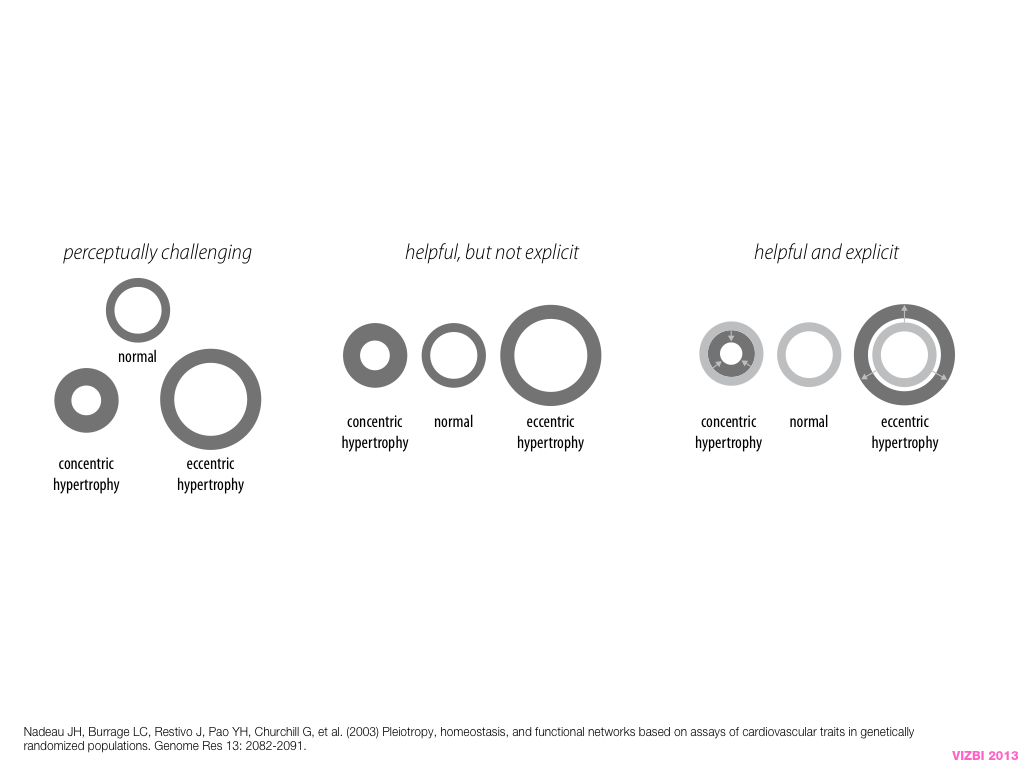
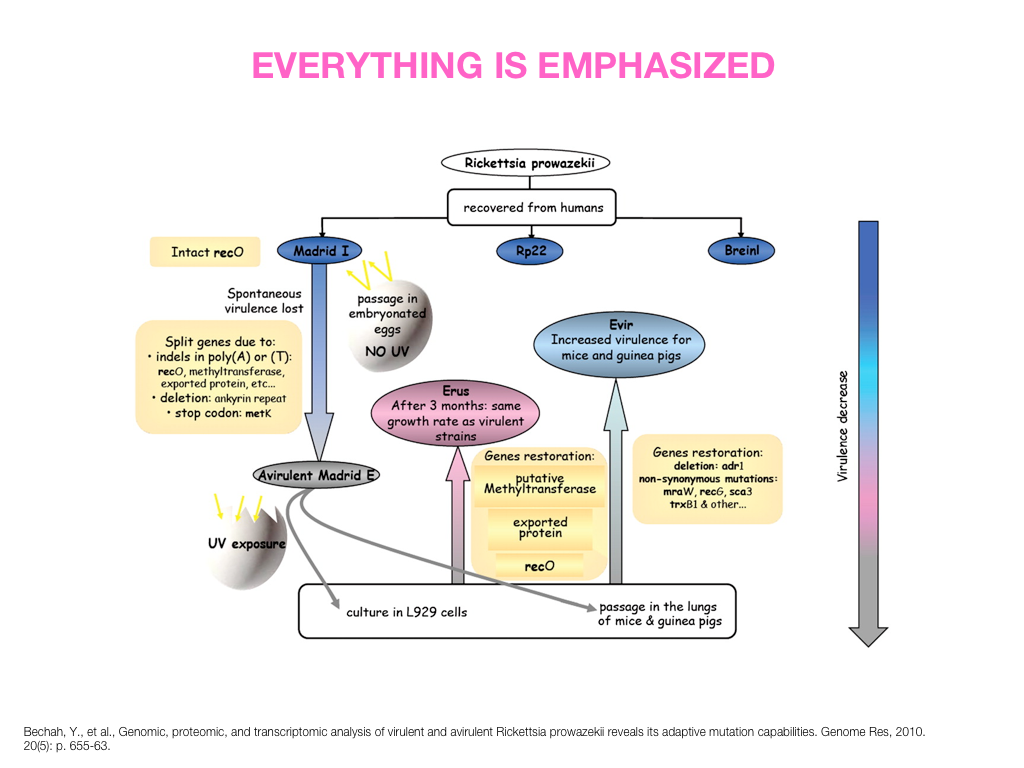
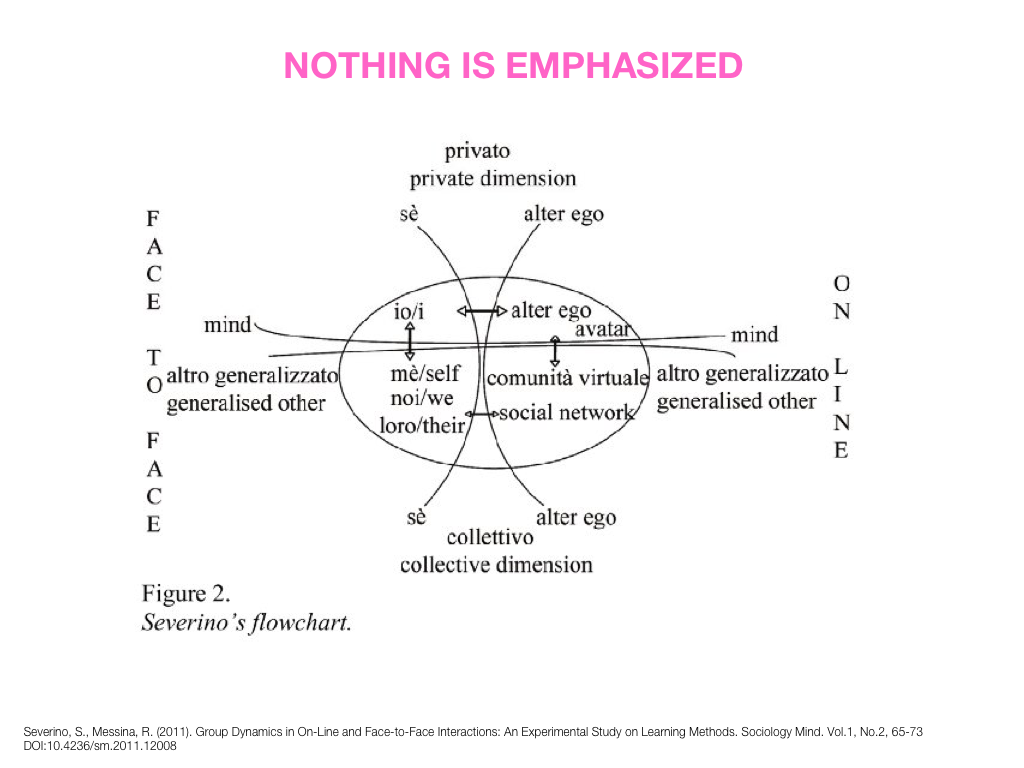
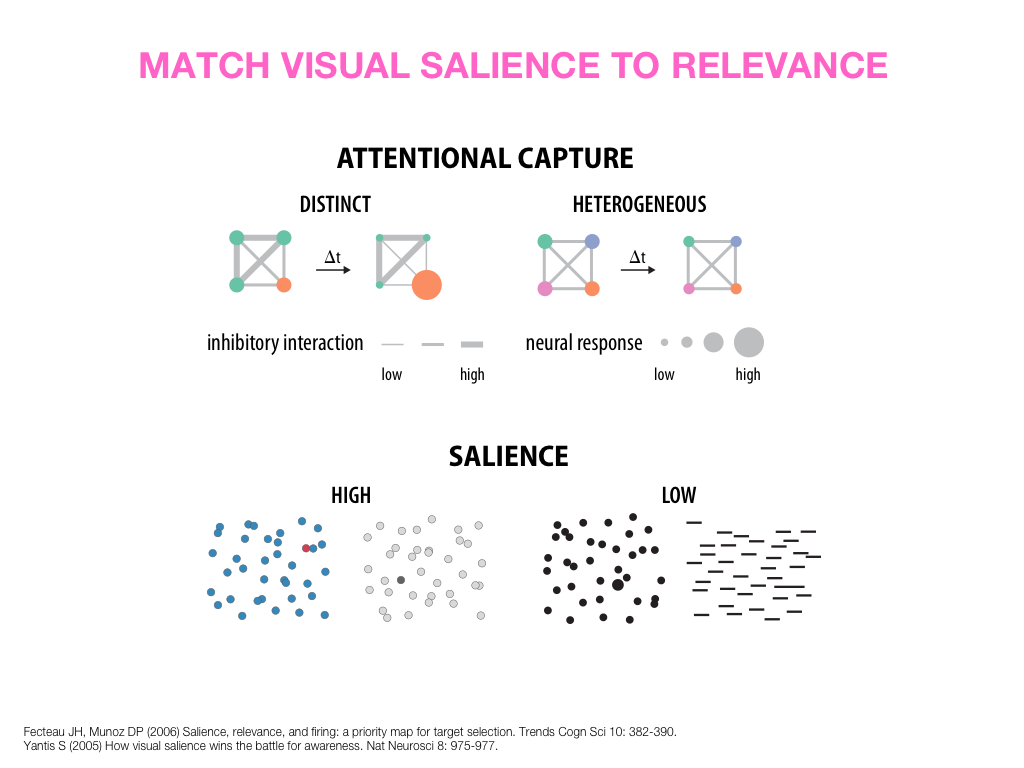
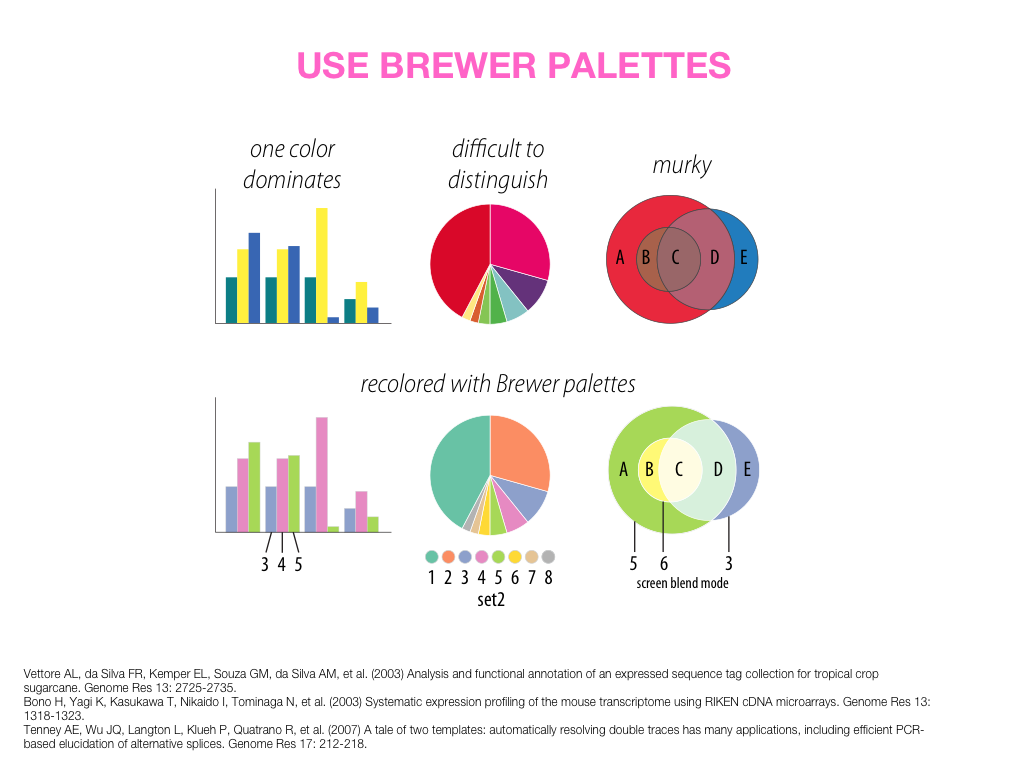
Visual Design Principles—Communicating Effectively
This talk happened on Thursday, Mar 21st 2013 at VIZBI 2013 at the Broad Institute in Boston.
How often people speak of art and science as though they were two entirely different things, with no interconnection. An artist is emotional, they think, and uses only his intuition; he sees all at once and has no need of reason. A scientist is cold, they think, and uses only his reason; he argues carefully step by step, and needs no imagination. That is all wrong. The true artist is quite rational as well as imaginative and knows what he is doing; if he does not, his art suffers. The true scientist is quite imaginative as well as rational, and sometimes leaps to solutions where reason can follow only slowly; if he does not, his science suffers. —Isaac Asimov (The Roving Mind)
For more visualization and design resources, see my VIZBI 2012 tutorials, Nature Methods Points of View column, and rant about colors.
presentation video
The video will be posted at vizbi.org.
presentation slides
Slides are available as PDF and keynote (zipped).


A poet is, after all, a sort of scientist, but engaged in a qualitative science in which nothing is measurable. He lives with data that cannot be numbered, and his experiments can be done only once. The information in a poem is, by definition, not reproducible. He becomes an equivalent of scientist, in the act of examining and sorting the things popping in [to his head], finding the marks of remote similarity, points of distant relationship, tiny irregularities that indicate that this one is really the same as that one over there only more important. Gauging the fit, he can meticulously place pieces of the universe together, in geometric configurations that are as beautiful and balanced as crystals. —Lewis Thomas (The Medusa and the Snail: More Notes of a Biology Watcher)
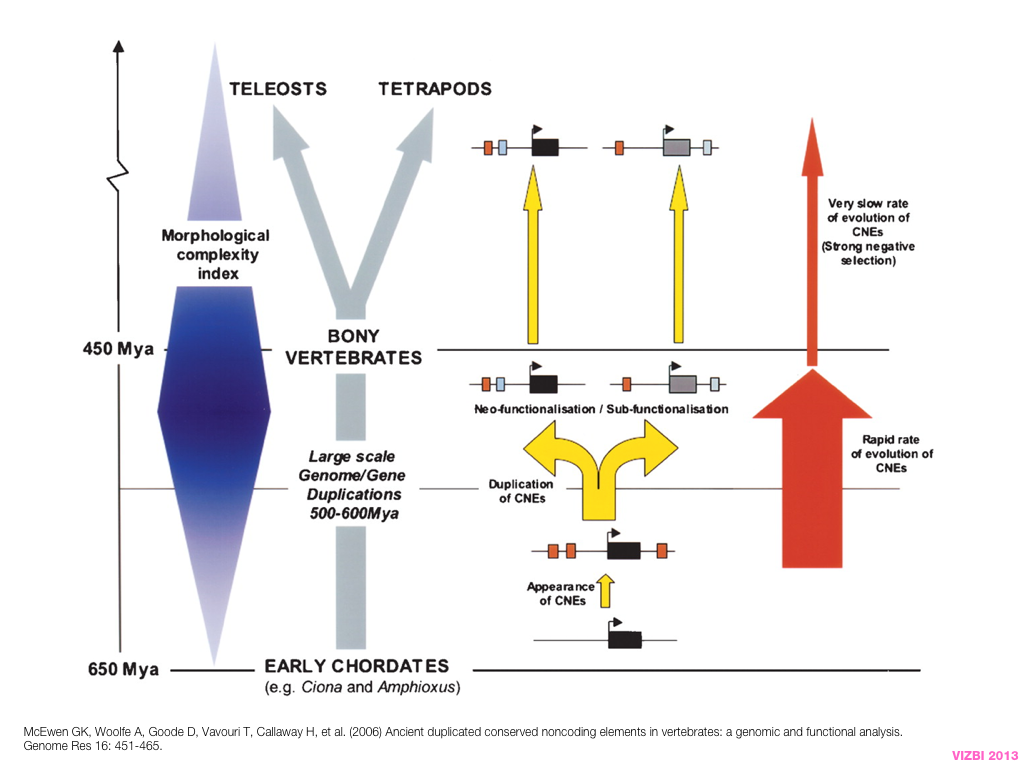
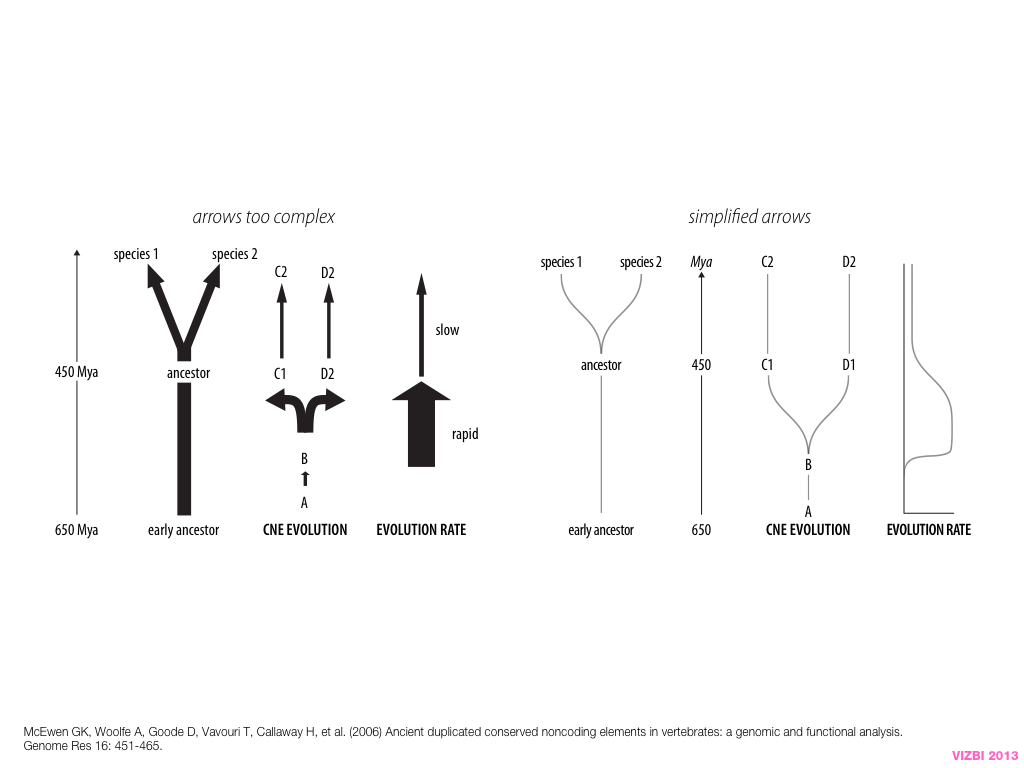
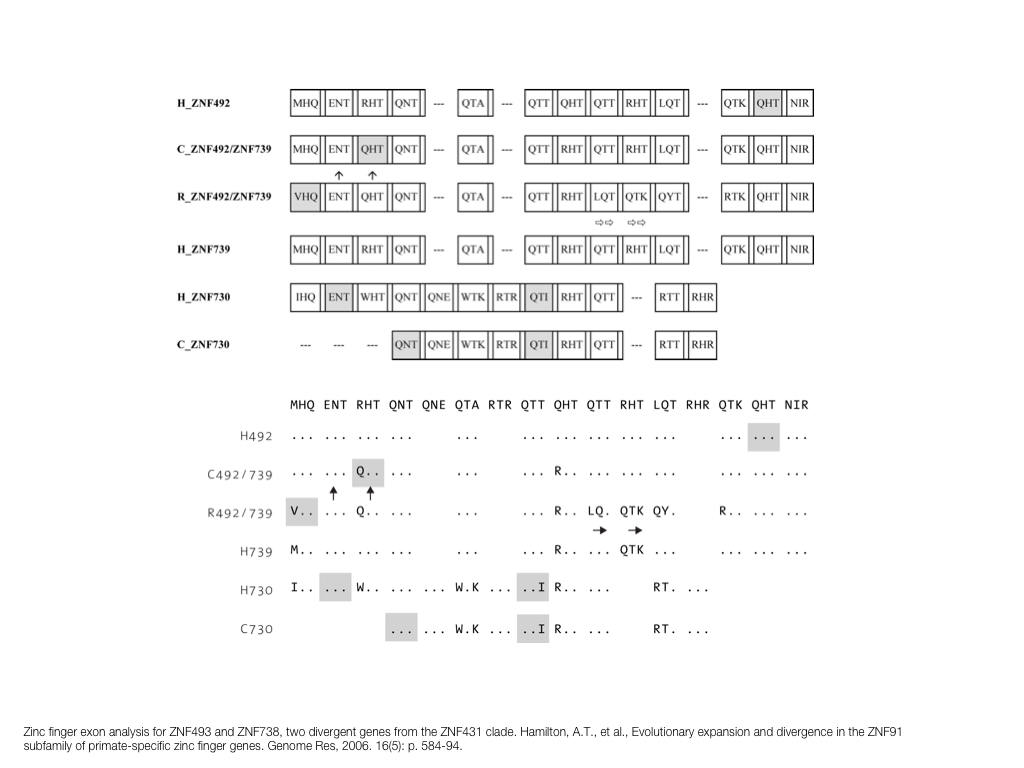
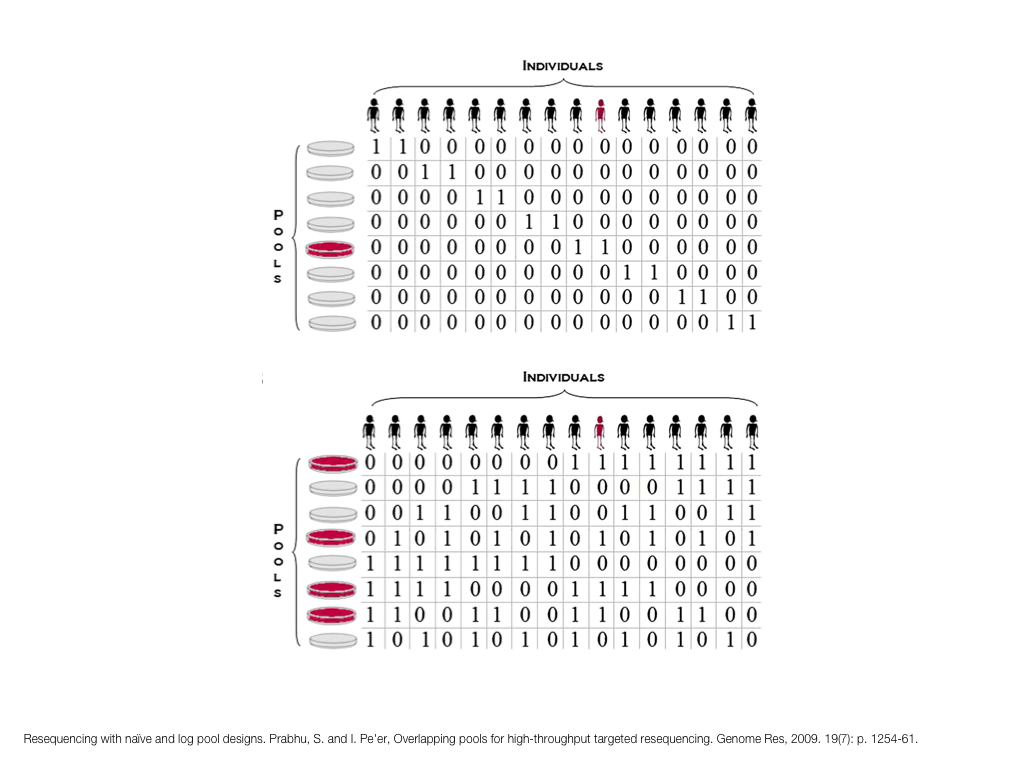
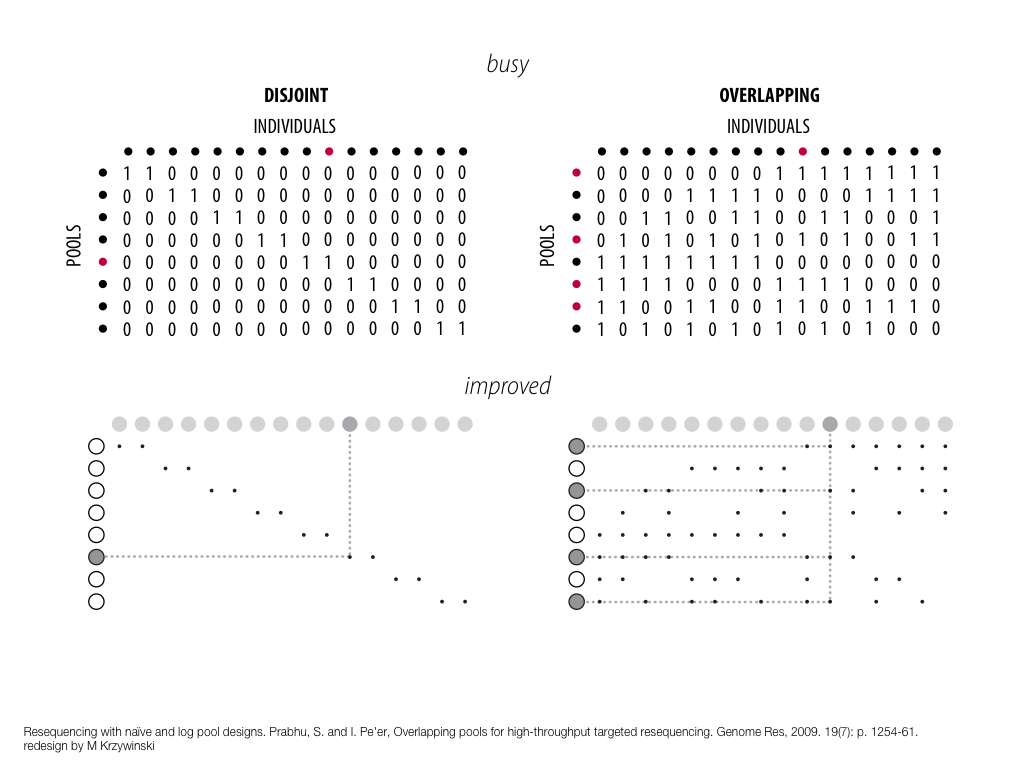
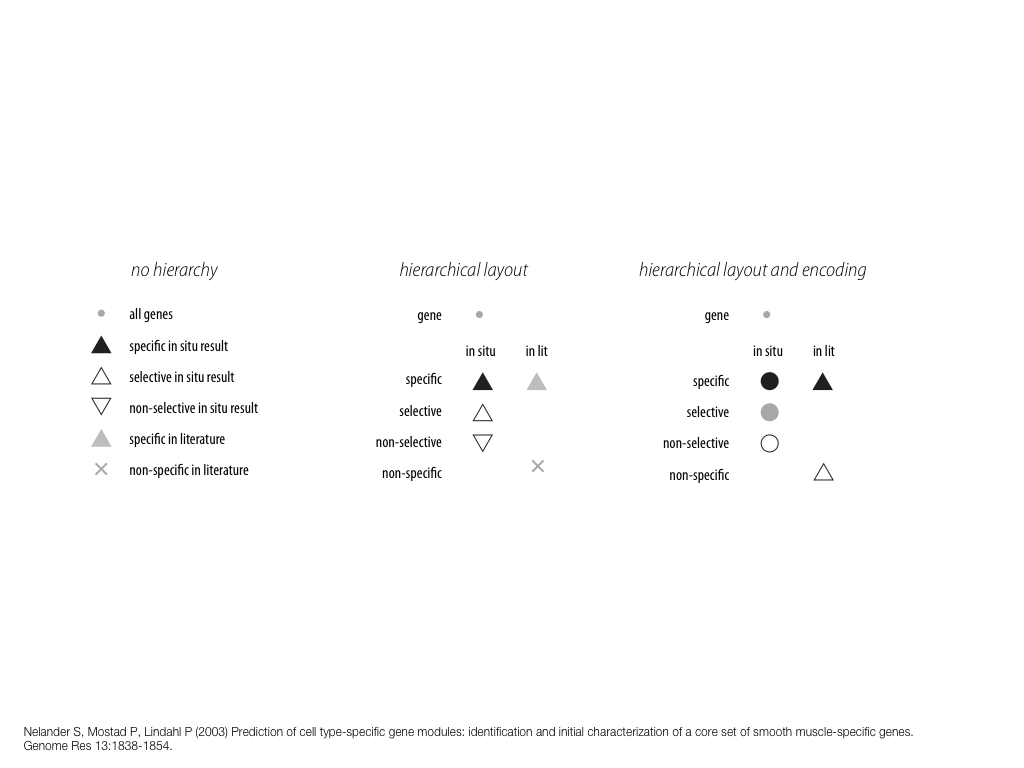
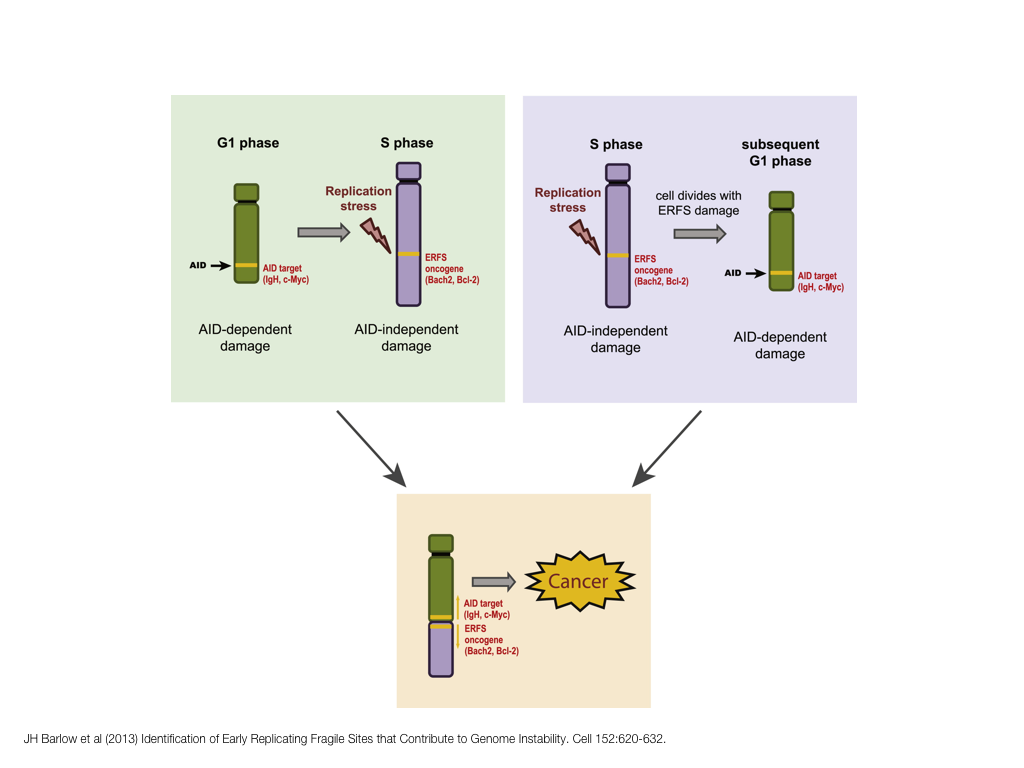
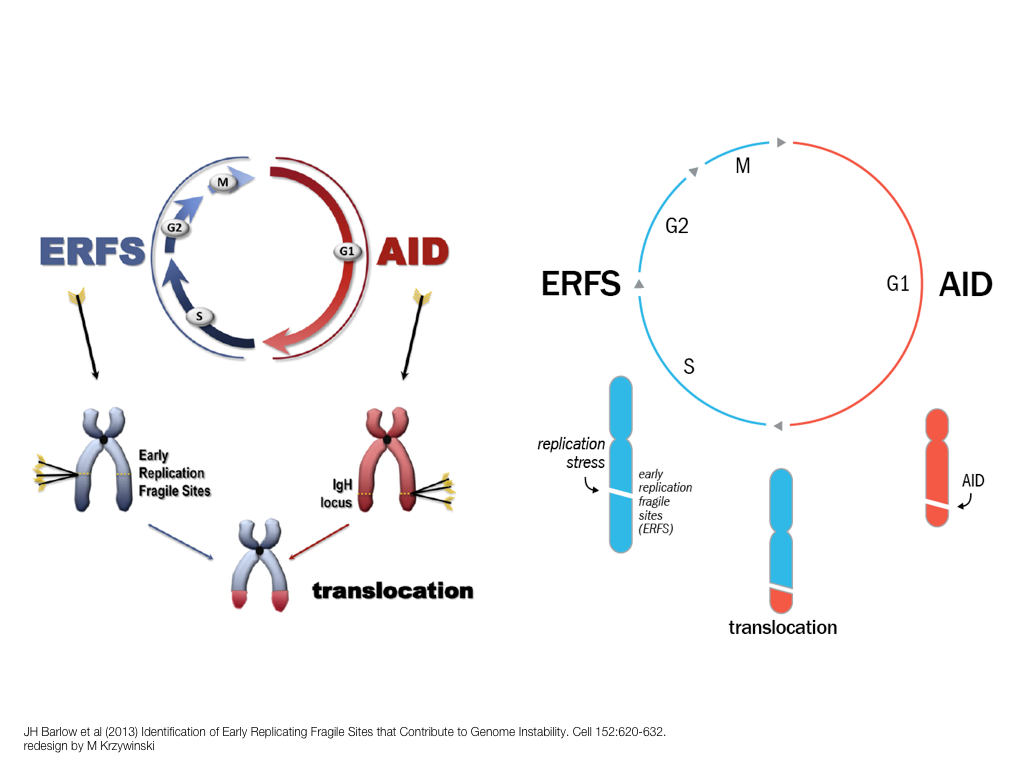
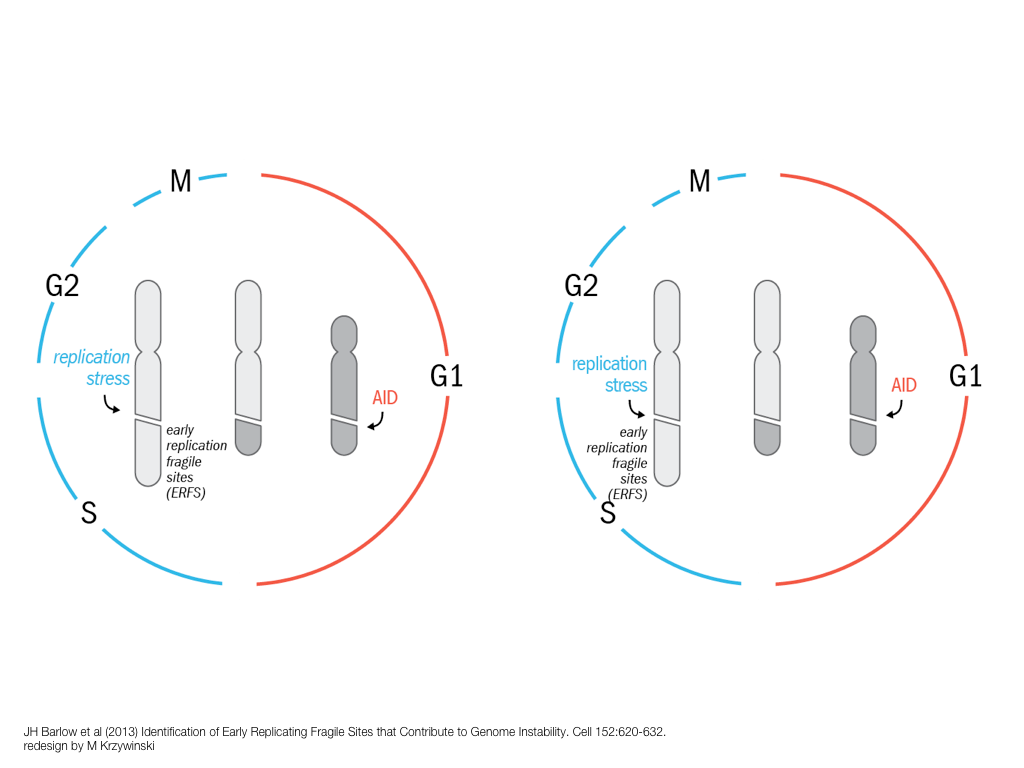
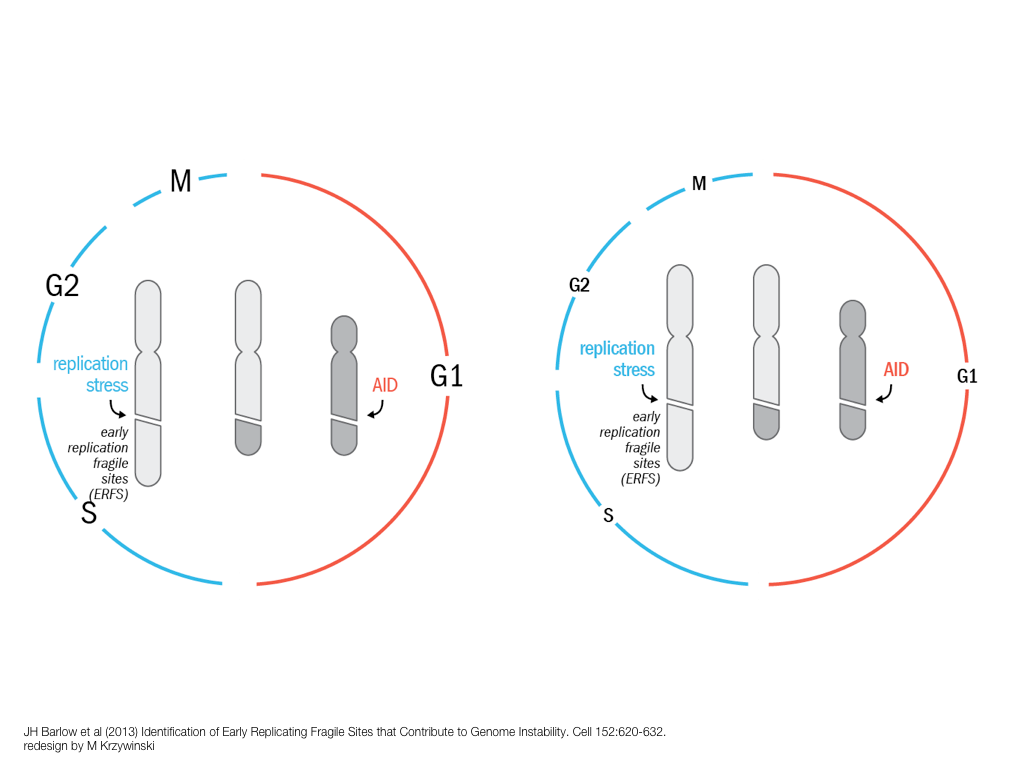
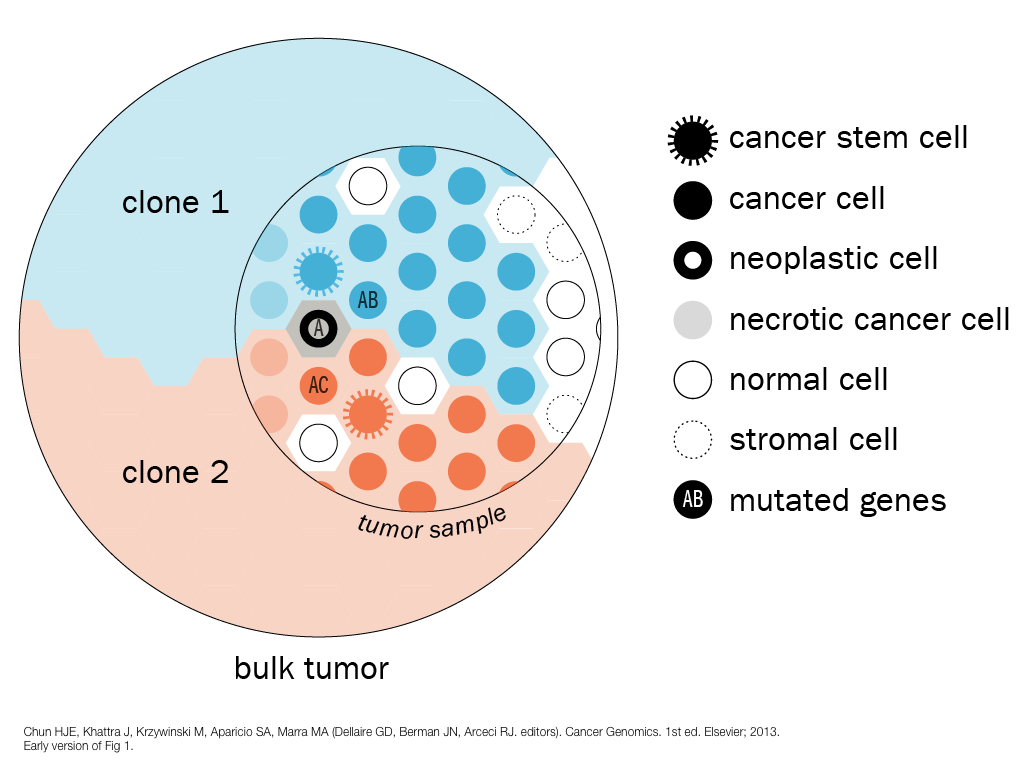
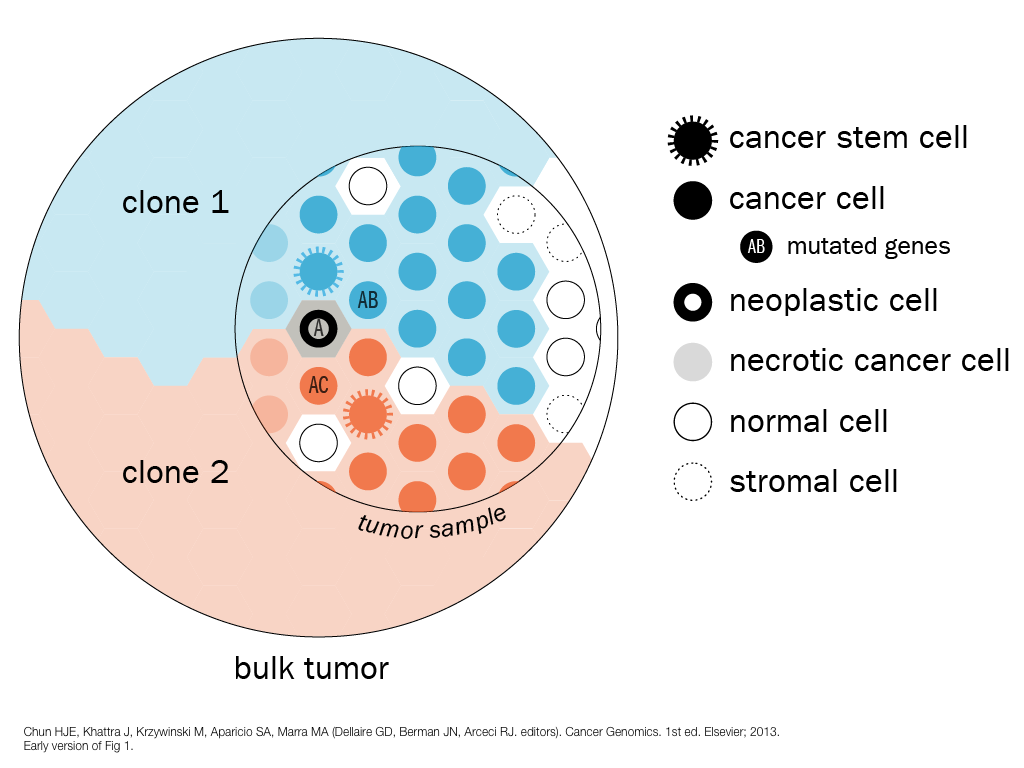
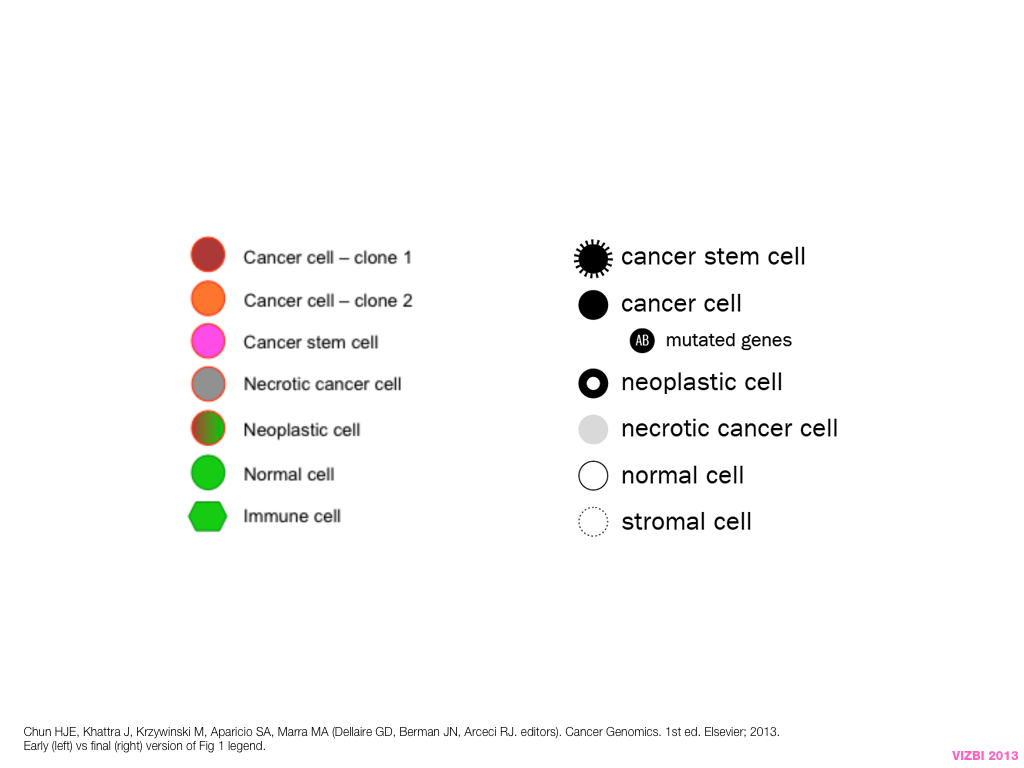
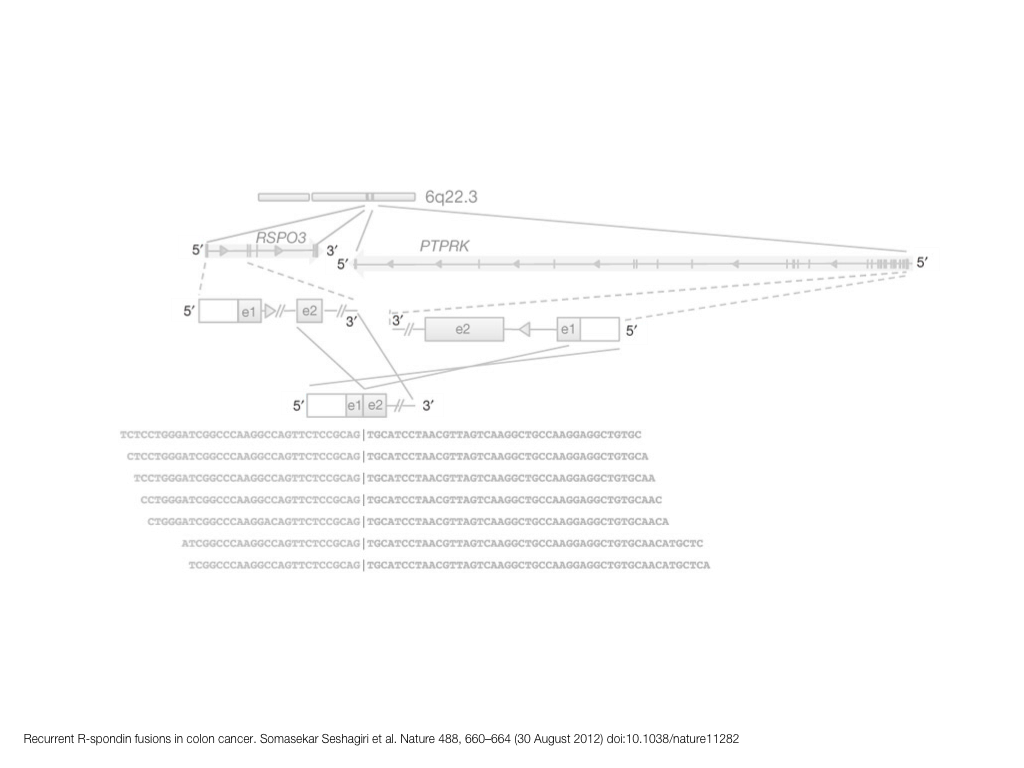
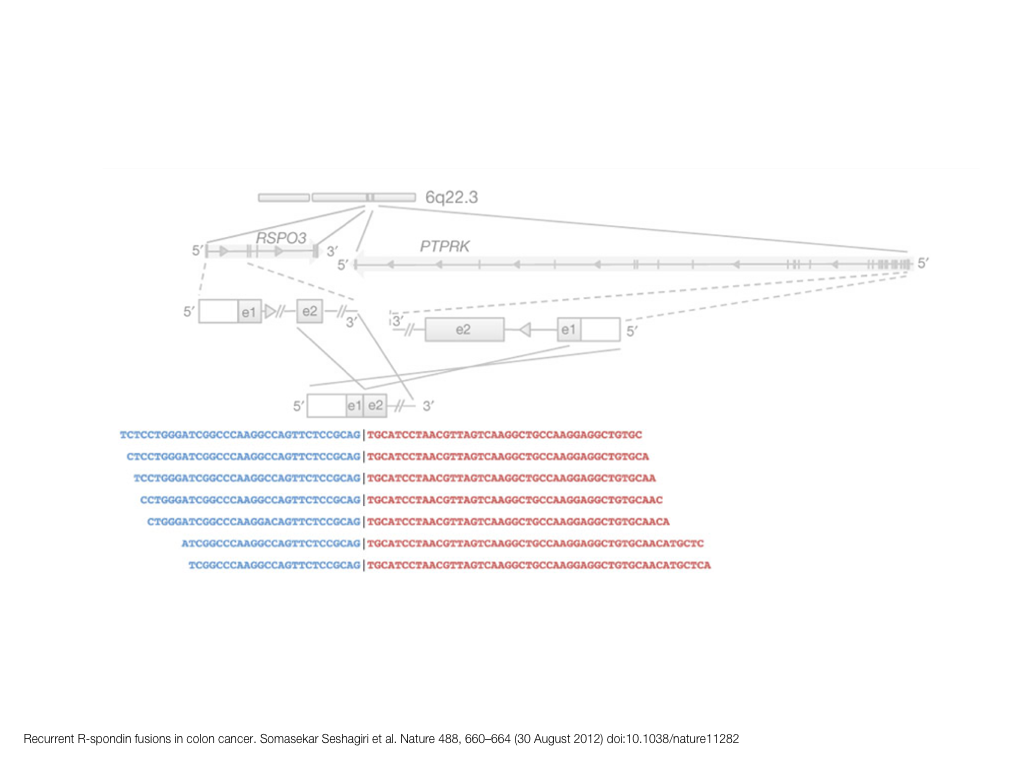
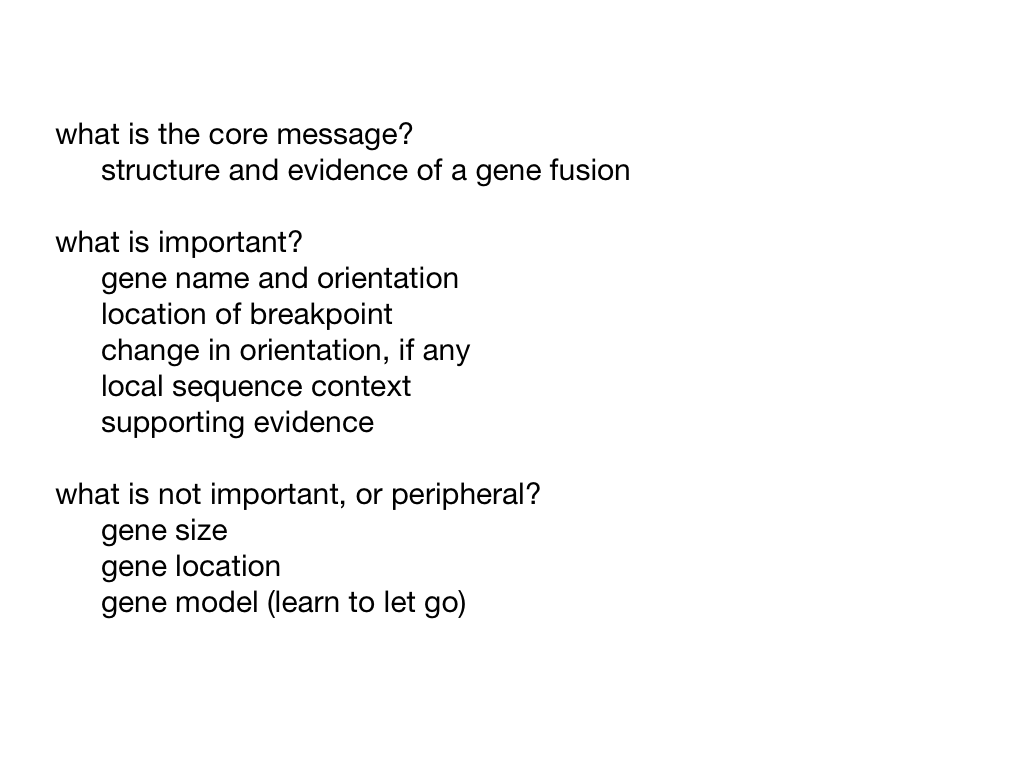
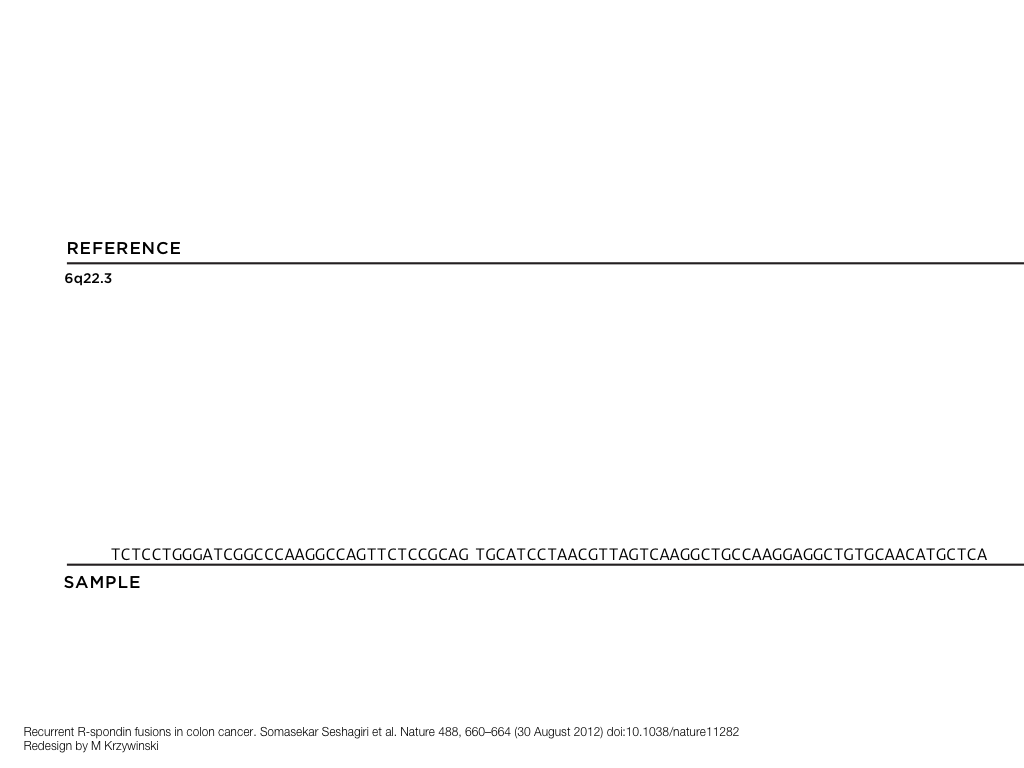
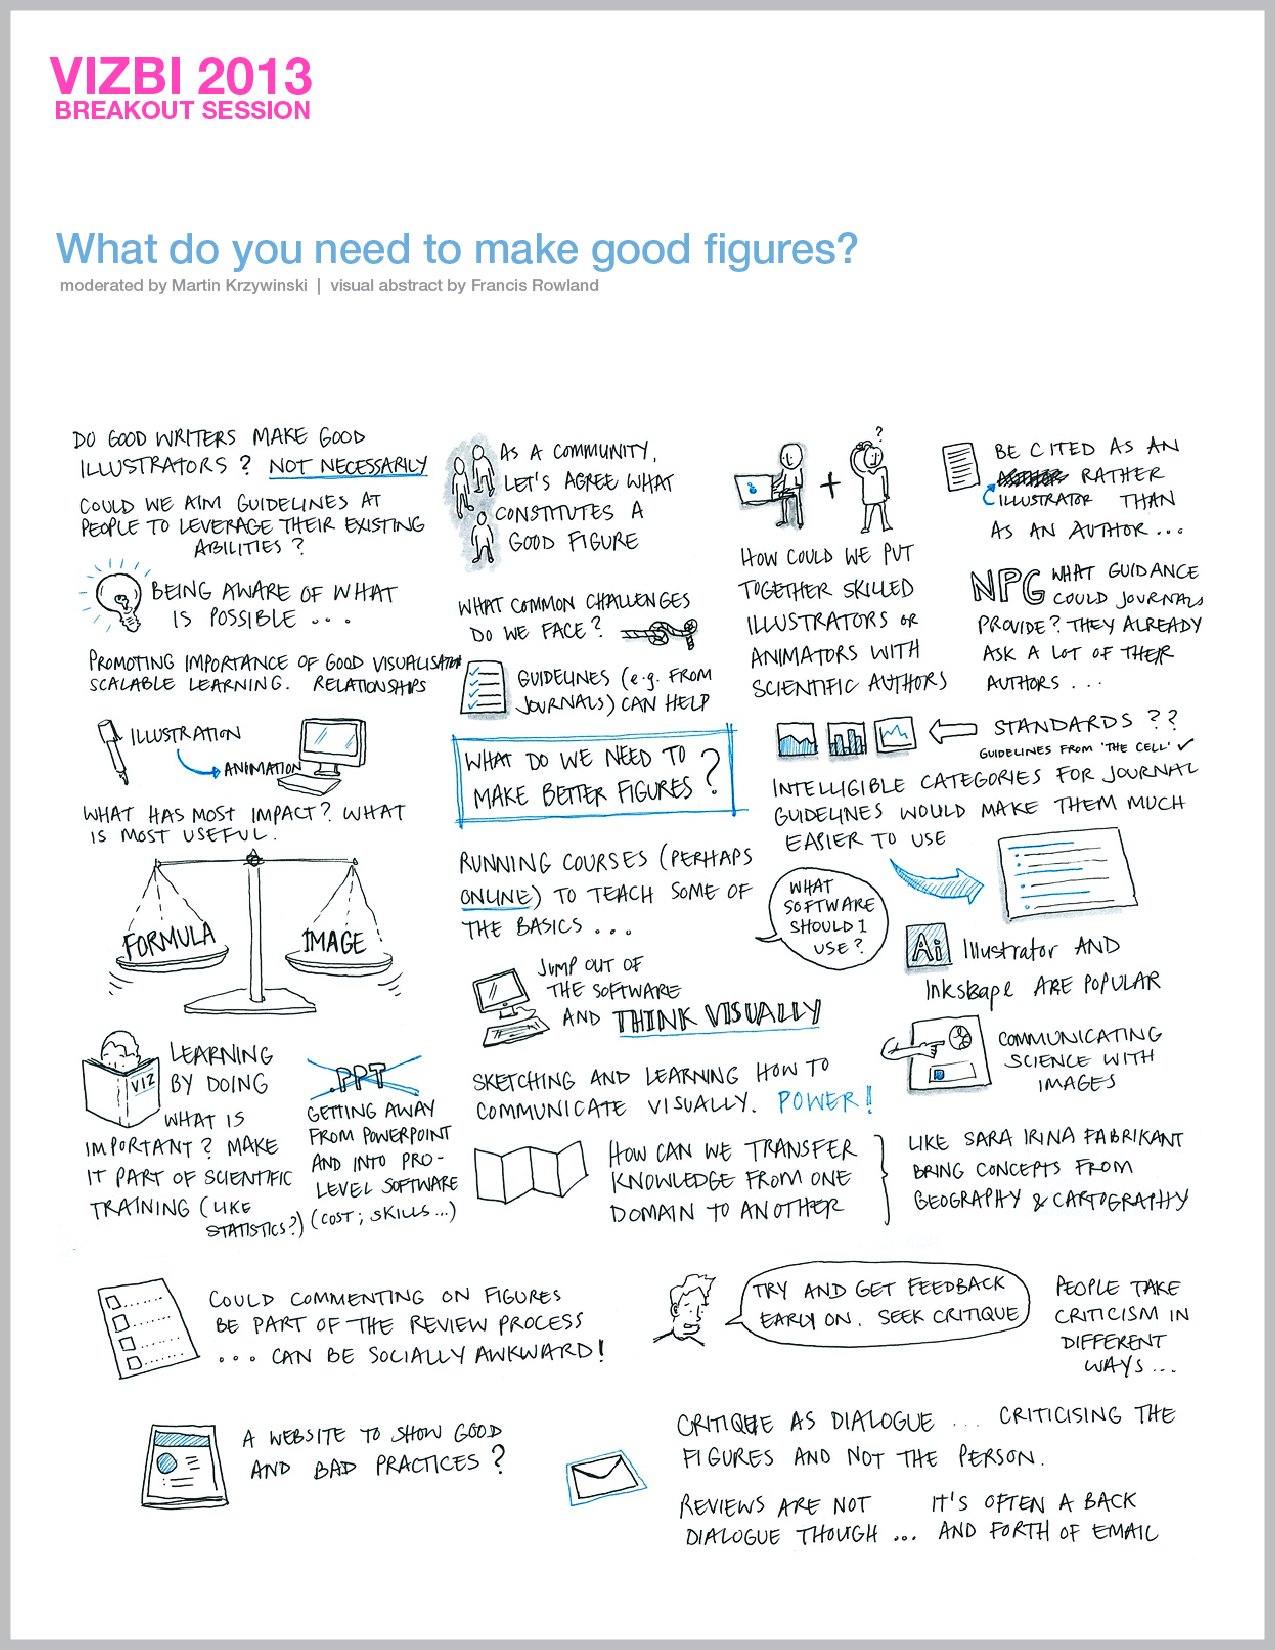
breakout session—making good figures
small, medium and big data visualization
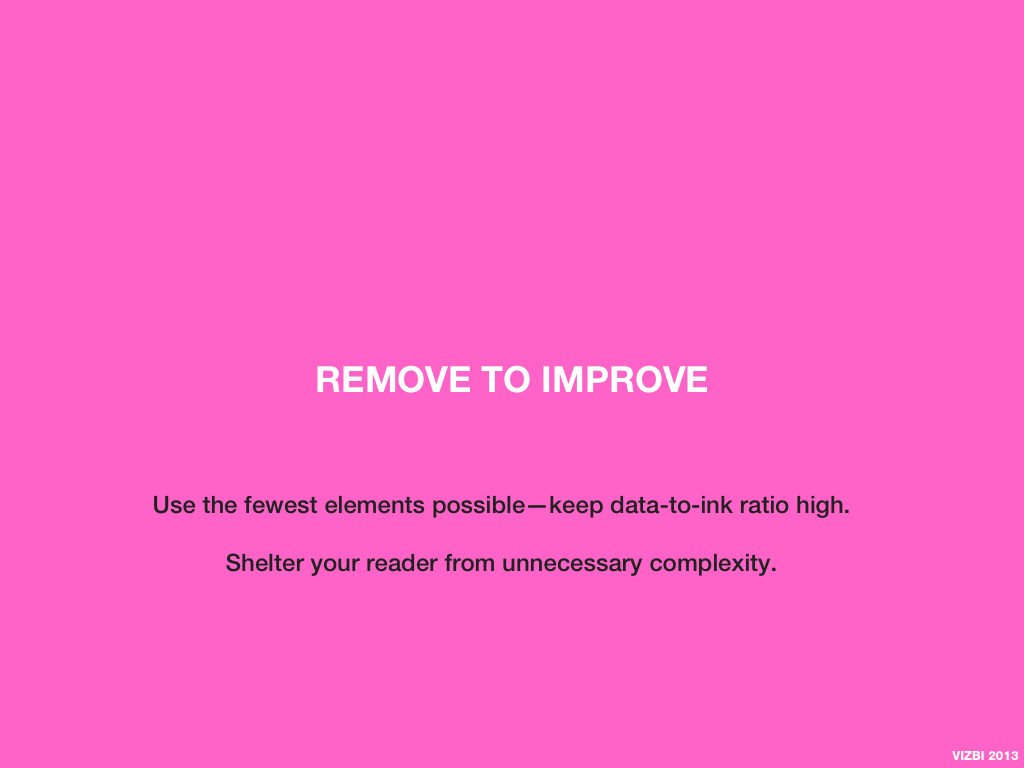
If you're asking how to visualize big data, first make sure you're doing a good job on small and medium data. Each scale requires good design.
to tell many stories
Also consider that there is a very large number of combinations of data sets, hypotheses and possible patterns. Because of this, you cannot expect to use one way to tell many stories. There is no Holy Grail of big data visualization. But there are many good questions to ask and practices to follow that make up a process which can help you get there.
Nasa to send our human genome discs to the Moon
We'd like to say a ‘cosmic hello’: mathematics, culture, palaeontology, art and science, and ... human genomes.


Comparing classifier performance with baselines
All animals are equal, but some animals are more equal than others. —George Orwell
This month, we will illustrate the importance of establishing a baseline performance level.
Baselines are typically generated independently for each dataset using very simple models. Their role is to set the minimum level of acceptable performance and help with comparing relative improvements in performance of other models.

Unfortunately, baselines are often overlooked and, in the presence of a class imbalance5, must be established with care.
Megahed, F.M, Chen, Y-J., Jones-Farmer, A., Rigdon, S.E., Krzywinski, M. & Altman, N. (2024) Points of significance: Comparing classifier performance with baselines. Nat. Methods 20.
Happy 2024 π Day—
sunflowers ho!
Celebrate π Day (March 14th) and dig into the digit garden. Let's grow something.

How Analyzing Cosmic Nothing Might Explain Everything
Huge empty areas of the universe called voids could help solve the greatest mysteries in the cosmos.
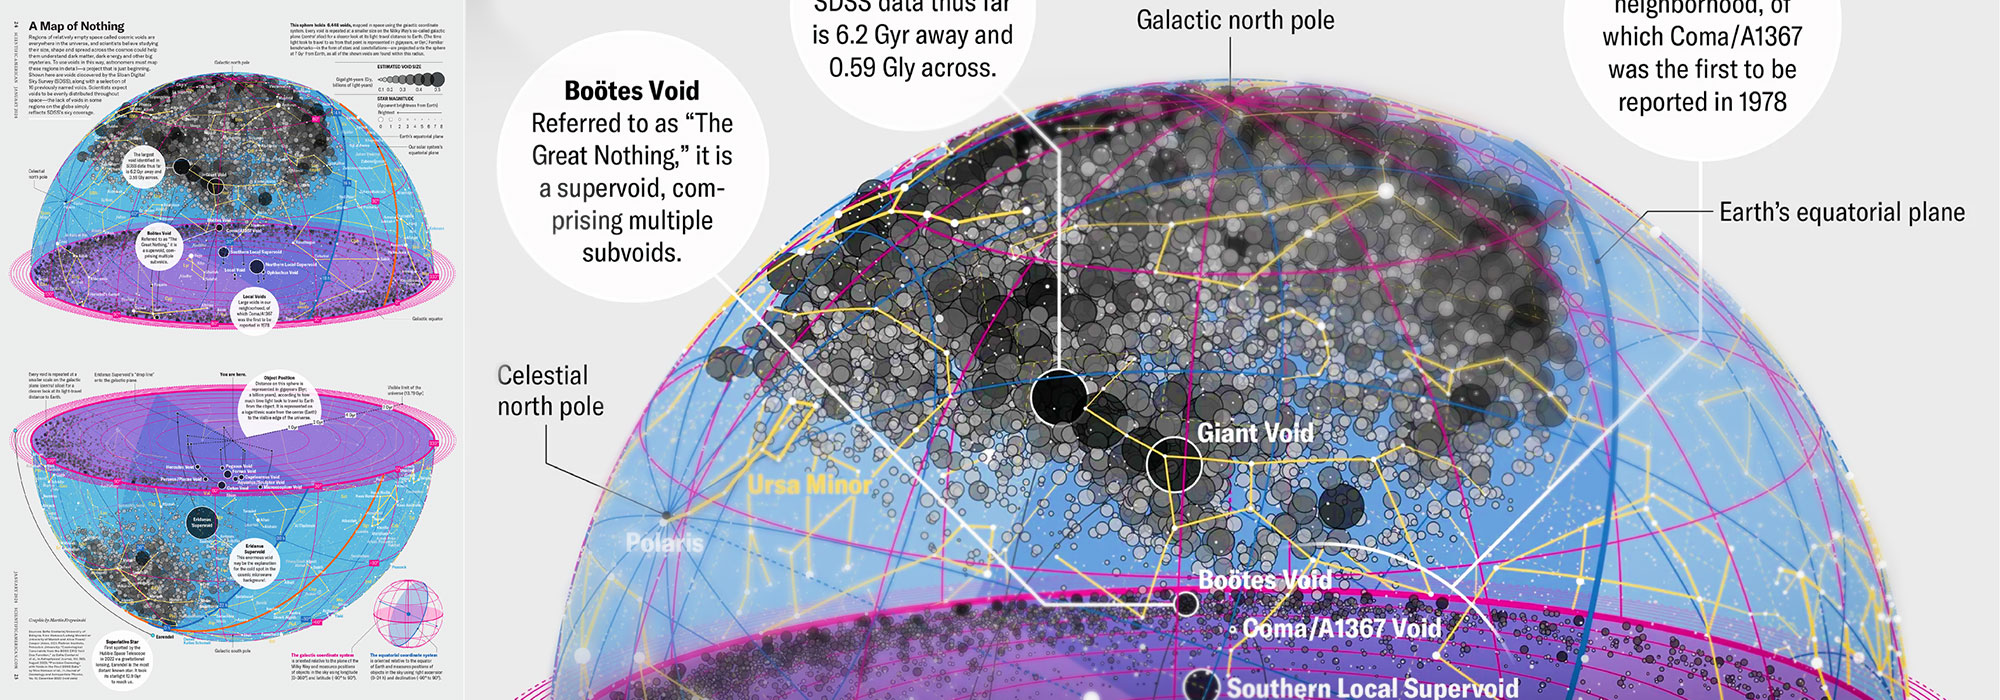
My graphic accompanying How Analyzing Cosmic Nothing Might Explain Everything in the January 2024 issue of Scientific American depicts the entire Universe in a two-page spread — full of nothing.

The graphic uses the latest data from SDSS 12 and is an update to my Superclusters and Voids poster.
Michael Lemonick (editor) explains on the graphic:
“Regions of relatively empty space called cosmic voids are everywhere in the universe, and scientists believe studying their size, shape and spread across the cosmos could help them understand dark matter, dark energy and other big mysteries.
To use voids in this way, astronomers must map these regions in detail—a project that is just beginning.
Shown here are voids discovered by the Sloan Digital Sky Survey (SDSS), along with a selection of 16 previously named voids. Scientists expect voids to be evenly distributed throughout space—the lack of voids in some regions on the globe simply reflects SDSS’s sky coverage.”
voids
Sofia Contarini, Alice Pisani, Nico Hamaus, Federico Marulli Lauro Moscardini & Marco Baldi (2023) Cosmological Constraints from the BOSS DR12 Void Size Function Astrophysical Journal 953:46.
Nico Hamaus, Alice Pisani, Jin-Ah Choi, Guilhem Lavaux, Benjamin D. Wandelt & Jochen Weller (2020) Journal of Cosmology and Astroparticle Physics 2020:023.
Sloan Digital Sky Survey Data Release 12
Alan MacRobert (Sky & Telescope), Paulina Rowicka/Martin Krzywinski (revisions & Microscopium)
Hoffleit & Warren Jr. (1991) The Bright Star Catalog, 5th Revised Edition (Preliminary Version).
H0 = 67.4 km/(Mpc·s), Ωm = 0.315, Ωv = 0.685. Planck collaboration Planck 2018 results. VI. Cosmological parameters (2018).
constellation figures
stars
cosmology