Schemaball
Circular visualization of database schemas
Schemaball was published in SysAdmin Magazine (Krzywinski, M. Schemaball: A New Spin on Database Visualization (2004) Sysadmin Magazine Vol 13 Issue 08). Who cites Schemaball?

Schemaball is an SQL database schema viewer. It requires Perl and a few modules, such as GD and optionally Math::Bezier and SQL::Translator. Schemaball creates flexible visualizations of database schemas. Schemas may be read from an SQL schema dump, flat file or live database.
what is schemaball?
Schemaball is a flexible schema visualizer for SQL databases. The purpose of Schemaball is to help visualize the relationships between tables. Tables are related by foreign keys, which are fields which store the value of a record field from another table. Foreign keys create a lookup relationship between two tables. Large schemas can have hundreds of tables and table relationships. Keeping track of them call can be tedious, error-prone and slow down the schema development process. Schemaball provides a means to create flexible, static graphic images of a schema. Tables and table links can be hidden, highlighted and foreign key relationships can be traversed forward or backward to highlight connected tables.
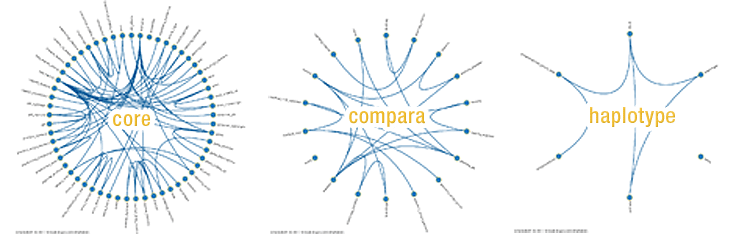
Schemaball produces images called schema balls. Schema balls are schema visualizations in which tables are ordered along a circle with table relationships drawn as curves or straight lines. Using an input configuration file, all elements of the schema ball can be configured.
Schemaball is free software, licensed under GPL. It is written in Perl and requires a few CPAN modules to run. It's simple to use, while being able to produce high quality schema balls suitable for publication. In particular, you can use Schemaball to generate elements of a schema ball and then create a composite in an image editing program. One such result is shown in the figure at right.
A Need for Flexible Database Visualization

A database schema can be thought of as a directed graph. The nodes in the graph are the tables and the edges are relationships between them. The edges are created by foreign key fields in tables (see figure at right). The reason why the personality is stored in a separate table has to do with optimizing the way data is stored. There may be millions of records in the PERSON table, but only hundreds of different personalities. If the personality name is very long, the size of the database would be unnecessarily large since this same field value would be found in thousands of PERSON records. Storing a personality name in a separate table as a single record and associating it with a unique identifier, while other tables refer to it, is called normalization.
While in this example it's hard to get lost in the single table link, even with 10 tables keeping things straight can get messy. Schemaball helps to keep your head wrapped around your tables' connections. You can print out a schema ball and mark it up while you work on your schema. When I'm working on a database, I use the excellent mysqlfront to create tables and edit table fields. When I have my tables created, I print out a schema ball and mark up how I'd like to link the tables together. Once I create the foreign key fields, I can print out another schema ball and keep it for record.
Since it is designed primarily to Schemaball does not show the interal details of the tables. In future versions, support for display of fields may be included, to generate schema superballs.
Schemaball is at end of life
I am not longer actively working on Schemaball. As a prototype system, it works well to quickly figure out the extent of connectedness between tables and create some visually appealing images.
I've since been using the circular composition form in my Circos project, which applies this layout to visualizing genomes (Circos is particularly popular in the field of comparative genomes, in which relationships between two or more genomes are analyzed and displayed).
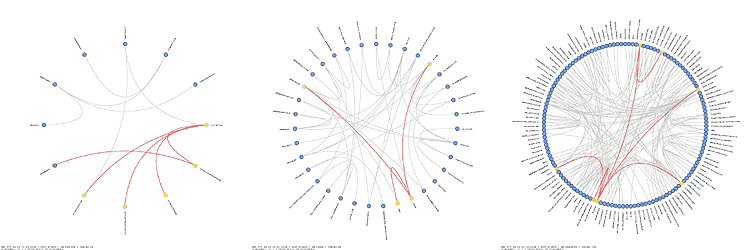
Case Study — Ensembl
Ensembl balls! See the structure of each Ensembl database, as drawn with Schemaball.
using Schemaball
To run Schemaball, you need Perl and a few CPAN modules. Schemaball has not been tested on Windows.
Nasa to send our human genome discs to the Moon
We'd like to say a ‘cosmic hello’: mathematics, culture, palaeontology, art and science, and ... human genomes.


Comparing classifier performance with baselines
All animals are equal, but some animals are more equal than others. —George Orwell
This month, we will illustrate the importance of establishing a baseline performance level.
Baselines are typically generated independently for each dataset using very simple models. Their role is to set the minimum level of acceptable performance and help with comparing relative improvements in performance of other models.

Unfortunately, baselines are often overlooked and, in the presence of a class imbalance5, must be established with care.
Megahed, F.M, Chen, Y-J., Jones-Farmer, A., Rigdon, S.E., Krzywinski, M. & Altman, N. (2024) Points of significance: Comparing classifier performance with baselines. Nat. Methods 20.
Happy 2024 π Day—
sunflowers ho!
Celebrate π Day (March 14th) and dig into the digit garden. Let's grow something.

How Analyzing Cosmic Nothing Might Explain Everything
Huge empty areas of the universe called voids could help solve the greatest mysteries in the cosmos.
My graphic accompanying How Analyzing Cosmic Nothing Might Explain Everything in the January 2024 issue of Scientific American depicts the entire Universe in a two-page spread — full of nothing.

The graphic uses the latest data from SDSS 12 and is an update to my Superclusters and Voids poster.
Michael Lemonick (editor) explains on the graphic:
“Regions of relatively empty space called cosmic voids are everywhere in the universe, and scientists believe studying their size, shape and spread across the cosmos could help them understand dark matter, dark energy and other big mysteries.
To use voids in this way, astronomers must map these regions in detail—a project that is just beginning.
Shown here are voids discovered by the Sloan Digital Sky Survey (SDSS), along with a selection of 16 previously named voids. Scientists expect voids to be evenly distributed throughout space—the lack of voids in some regions on the globe simply reflects SDSS’s sky coverage.”
voids
Sofia Contarini, Alice Pisani, Nico Hamaus, Federico Marulli Lauro Moscardini & Marco Baldi (2023) Cosmological Constraints from the BOSS DR12 Void Size Function Astrophysical Journal 953:46.
Nico Hamaus, Alice Pisani, Jin-Ah Choi, Guilhem Lavaux, Benjamin D. Wandelt & Jochen Weller (2020) Journal of Cosmology and Astroparticle Physics 2020:023.
Sloan Digital Sky Survey Data Release 12
Alan MacRobert (Sky & Telescope), Paulina Rowicka/Martin Krzywinski (revisions & Microscopium)
Hoffleit & Warren Jr. (1991) The Bright Star Catalog, 5th Revised Edition (Preliminary Version).
H0 = 67.4 km/(Mpc·s), Ωm = 0.315, Ωv = 0.685. Planck collaboration Planck 2018 results. VI. Cosmological parameters (2018).
constellation figures
stars
cosmology
Error in predictor variables
It is the mark of an educated mind to rest satisfied with the degree of precision that the nature of the subject admits and not to seek exactness where only an approximation is possible. —Aristotle
In regression, the predictors are (typically) assumed to have known values that are measured without error.
Practically, however, predictors are often measured with error. This has a profound (but predictable) effect on the estimates of relationships among variables – the so-called “error in variables” problem.

Error in measuring the predictors is often ignored. In this column, we discuss when ignoring this error is harmless and when it can lead to large bias that can leads us to miss important effects.
Altman, N. & Krzywinski, M. (2024) Points of significance: Error in predictor variables. Nat. Methods 20.
Background reading
Altman, N. & Krzywinski, M. (2015) Points of significance: Simple linear regression. Nat. Methods 12:999–1000.
Lever, J., Krzywinski, M. & Altman, N. (2016) Points of significance: Logistic regression. Nat. Methods 13:541–542 (2016).
Das, K., Krzywinski, M. & Altman, N. (2019) Points of significance: Quantile regression. Nat. Methods 16:451–452.