Learning Circos
Bioinformatics and Genome Analysis
Institut Pasteur Tunis Tunisia, December 10 – December 11, 2018
v2.00 6 Dec 2018 Download PDF slides
v2.00 6 Dec 2018
A 2- or 4-day practical mini-course in Circos, command-line parsing and scripting. This material is part of the Bioinformatics and Genome Analysis course held at the Institut Pasteur Tunis.
Quick links
BCGA 2018 | 1-day Circos course | Circos documentation best practices getting started | Brewer palette swatches | Color resources | Nature Methods Points of View Points of Significance
Visualizing and Parsing clustal alignments
Additional material — Day 3
9h00 - 10h30 | Lecture 1 — Visualization strategies
11h00 - 12h30 | Lecture (practical) 2 — Parsing clustal alignments on command line
14h00 - 15h30 | Lecture (practical) 3 — Parsing clustal alignments with Perl
16h00 - 18h00 | Lecture (practical) 4 — Plotting clustal alignments
Concepts covered
designing effective visualizations, parsing clustal alignments, advanced Perl techniques, using Circos tools
Plotting clustal alignments
A more detailed look at the Circos image of clustal alignments.
Now that you've parsed the links and created the karyotype file in Lecture 2, we can creating a Circos image from scratch.
Well, almost from scratch — it's always good to start with a boilerplate configuration.
I've provided a basic configuration — there are some ticks and ideogram parameters already defined.
You'll find a sample karyotype file
# karyotype.txt
# You'll replace this file with one based on the alignment file
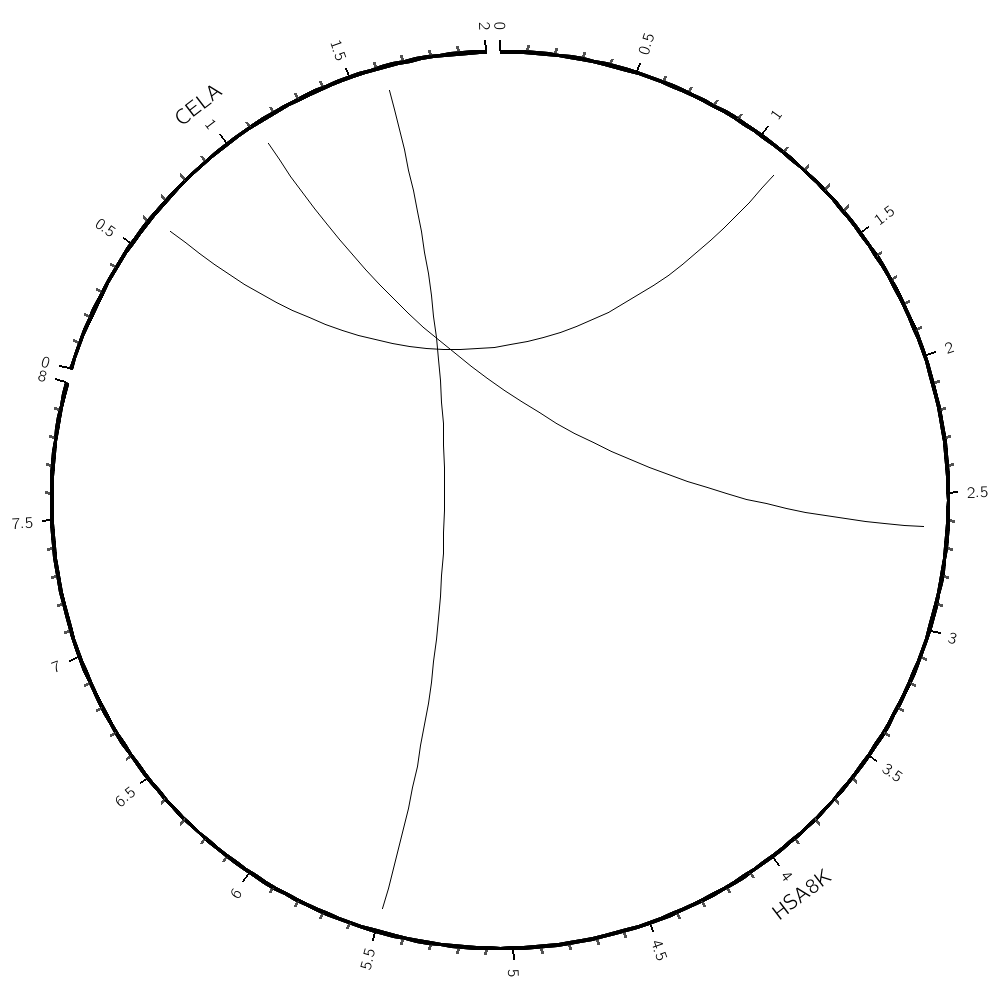
chr - hsa8K hsa8k 0 8000 black
chr - celA cela 0 2000 black
and a sample link file
# links.txt
# You'll replace this file with one based on the alignment file
hsa8K 1000 1250 celA 500 750
hsa8K 2500 2750 celA 1000 1250
hsa8K 5000 6000 celA 1500 1750
Using the files you generated from parsing the clustal alignments in the previous lecture, build this Circos configuration file.
Refer to the image you saw this morning to get ideas of what kinds of things to add. Feel free to copy content from that file but I suggest you don't cut and paste — enter the content manually to reinforce your understanding of how these configuration files are formatted.
Try using the binlinks Circos tool to generate counts of links in a given region. The binlinks.sh in this directory shows you how to do this, using the links generated by clustal2link. Apply the script to the link file you generated.
Add a histogram track to the circos image that shows the count of the links. Change the track type to a highlight to only show the regions. Experiment with a heat map. Refer to the Circos track documentation if you get stuck
http://www.circos.ca/documentation/tutorials/2d_tracks/
You'll replace this file with one based on the alignment file
chr - hsa8K hsa8k 0 8000 black
chr - celA cela 0 2000 black
You'll replace this file with one you create.
hsa8K 1000 1250 celA 500 750
hsa8K 2500 2750 celA 1000 1250
hsa8K 5000 6000 celA 1500 1750
#!/bin/bash

CTOOLS=/home/martink/work/circos/svn/tools/

# report a count of the number of links (-num) in 250 base windows (-bin_size 250)
# counting both ends of the link (-link_end 2)

cat ../../lecture.2/1/data/links.txt | $CTOOLS/binlinks/bin/binlinks -bin_size 250 -num -link_end 2
<colors>
# include any colors you create here
</colors>

karyotype = karyotype.txt

chromosomes_units           = 1000
chromosomes_display_default = yes

<links>
<link>
file   = links.txt
See the link geometry tutorial to explore how the shape of the link curve can be altered.
http://www.circos.ca/documentation/tutorials/links/geometry/
radius        = 0.95r
bezier_radius = 0r
color         = black

# ... other parameters as required

# try using ribbons
# ribbon = yes
# flat   = yes # what does this do?

<rules>
# some rules to try
#
# 1. show only alignments that are larger than a certain size
# 2. set the color of alignments smaller than a certain size to grey
# 3. map the size of alignments onto their color using a Brewer palette

#<rule>
# first rule
# condition = ...
# ... other parameters
#</rule>

#<rule>
# another rule
# condition = ...
# ... other parameters
#</rule>

</rules>

</link>

</links>

<<include ideogram.conf>>
<<include ticks.conf>>