


The trees along this city street,
Save for the traffic and the trains,
Would make a sound as thin and sweet
As trees in country lanes.
And people standing in their shade
Out of a shower, undoubtedly
Would hear such music as is made
Upon a country tree.
Oh, little leaves that are so dumb
Against the shrieking city air,
I watch you when the wind has come,—
I know what sound is there.
— Edna St. Vincent Millay
Nature Biotechnology Cover
11 April 2022, Issue 40, Volume 4
Konno, N. et al. Deep distributed computing to reconstruct extremely large lineage trees (2022) Nature Biotechnology 40:566–575.

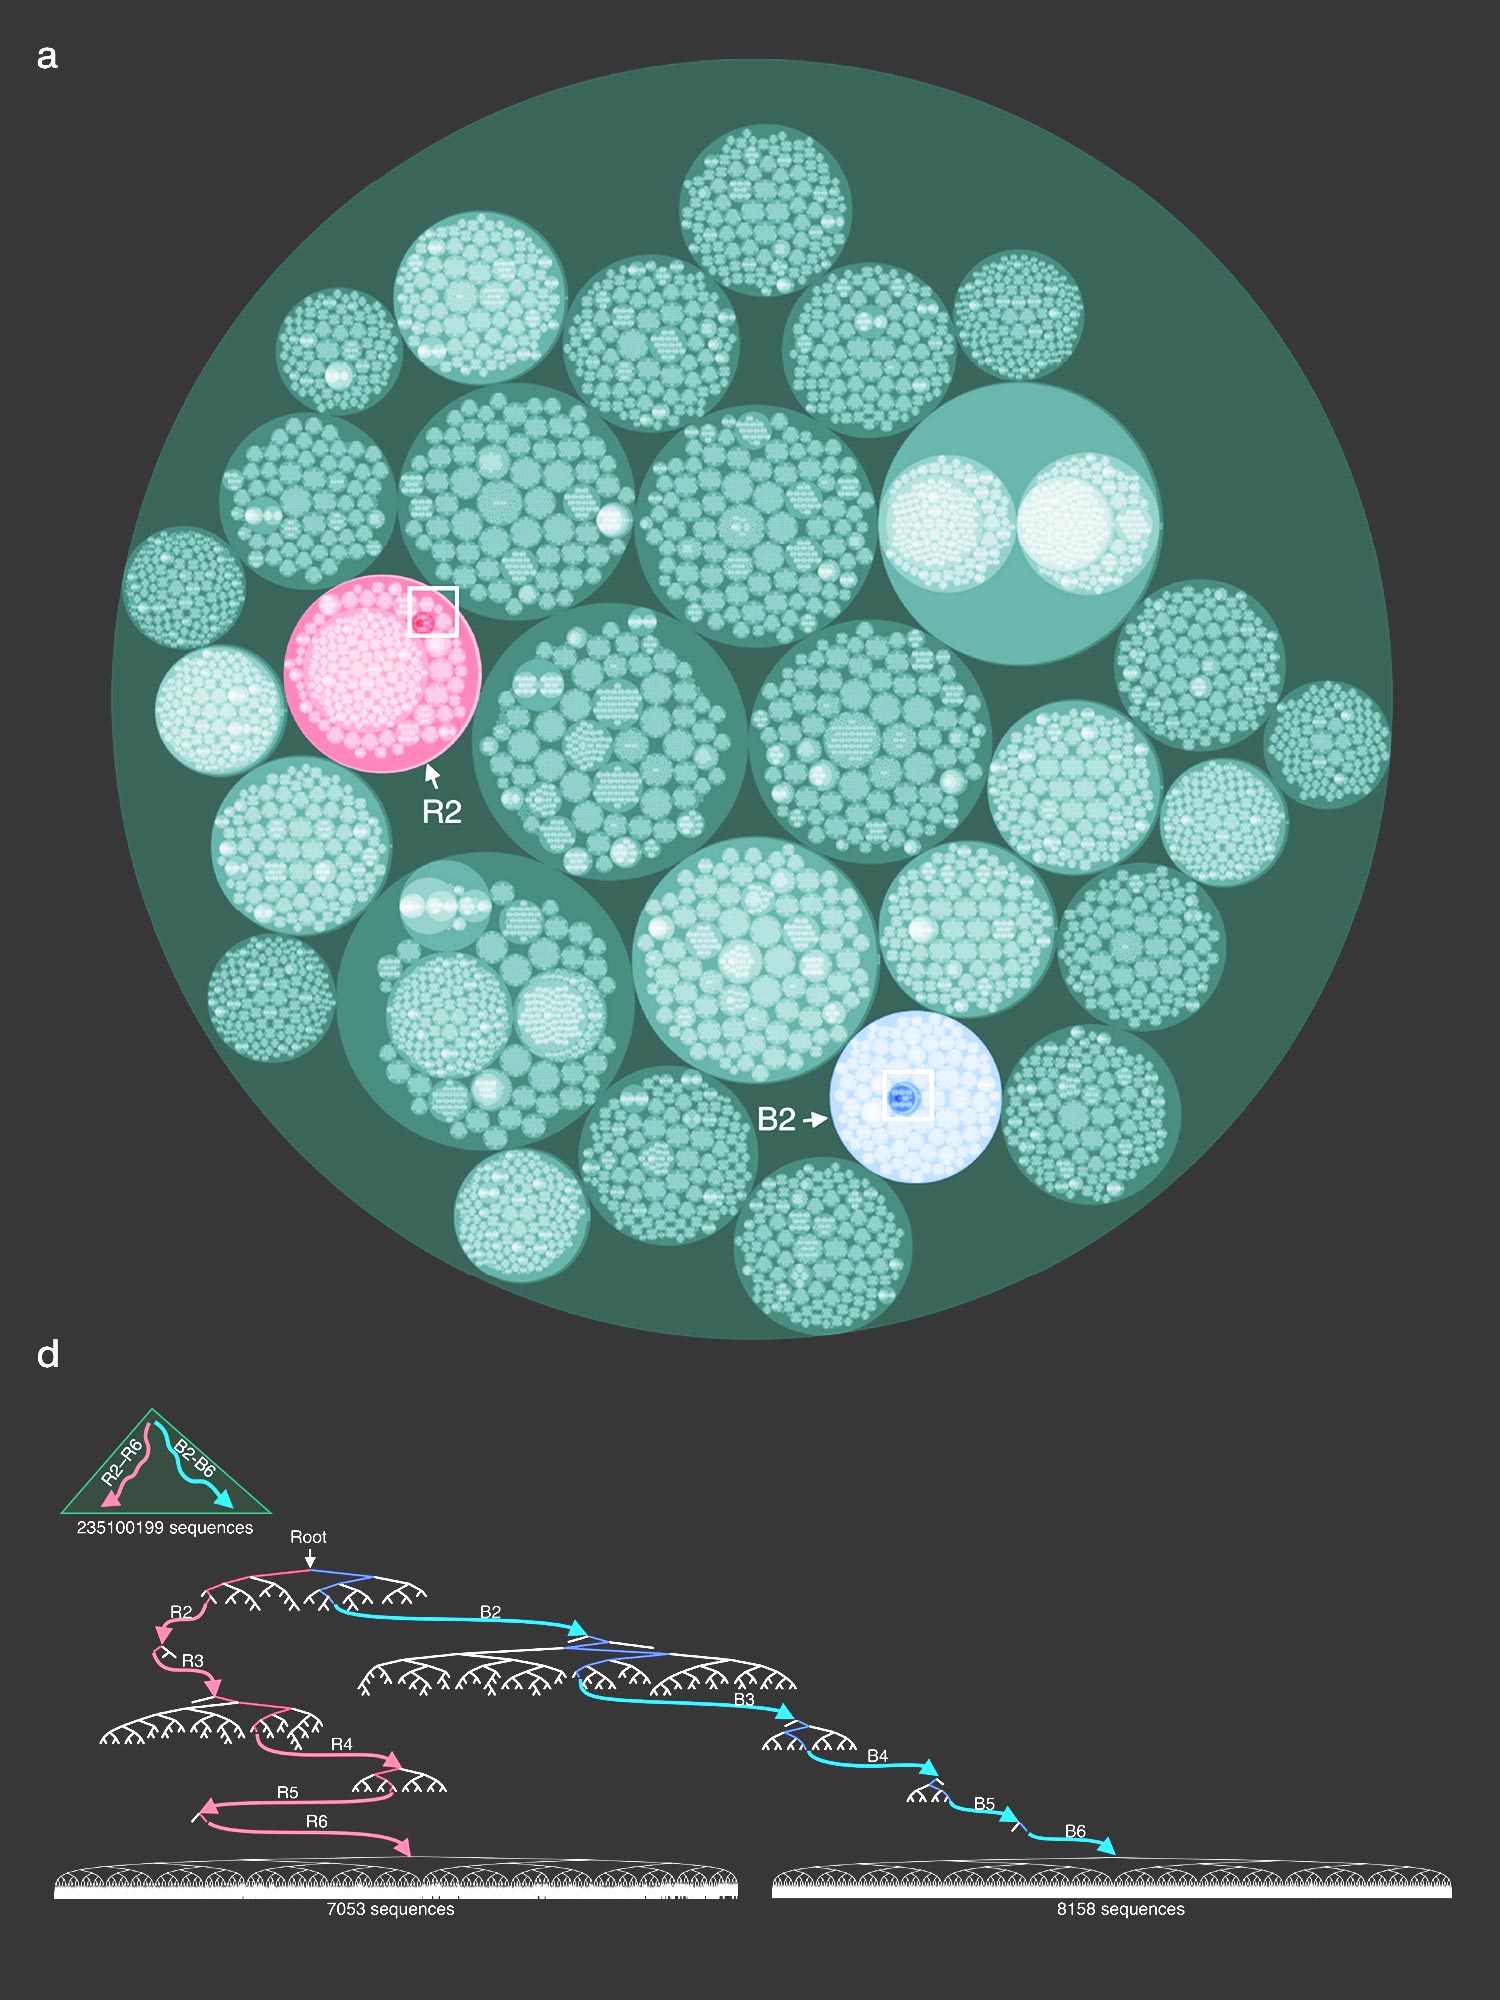
The cover design accompanies the paper by Konno et al., which presents a highly efficient distributed computing method for the reconstruction of evolutionary trees from very large datasets.
The cover is a rearrangement of the very large phylogenetic data set depicted in Figure 2a in the paper. You can browse this data set using the HiView server.
The source of inspiration for the cover design came from previous work, where I drew trees from data.
I receive email. One day, I received this one.
I am a Norwegian biology student that has recently become a huge fan of your data art! It's beautiful, really!
What I wanted to ask you, if it's possible for you to help me a little bit on the way of a project I'm starting.
I have had the pleasure of working with a PhD-student here at the university in Bergen, she has taught me so much, and given me a lot of experience in the field, as well as opened up some big career "doors" for me.
She is supposed to deliver her PhD in November and I want to give here a gift to say thank you for all she has done for me.
My idea is this: some sort of visualization of the data she is using in here PhD. She is studying plant communities in Norway, and I have access to the data (plant heights, carbon in the air, thickness of leafs, number of individuals and so on), but i'm not sure how I can make it look beautiful.
So to clarify, I'm not looking for a diagram that is useful or anything, but just pretty to look at, and that is a memory of all the data she has collected, and worked with for the last 4 years. Maybe a diagram in different colors, depending on what the value is, in just a random order... or something...
So do you have any idea of how I can do this? What program do you use when you make your diagrams?
Understand if you dont have the time to answer this, but thank you anyway for reading, and for all you have created!
—Ruben Thormodsæter
I love Norway and I love people that love people who love science.
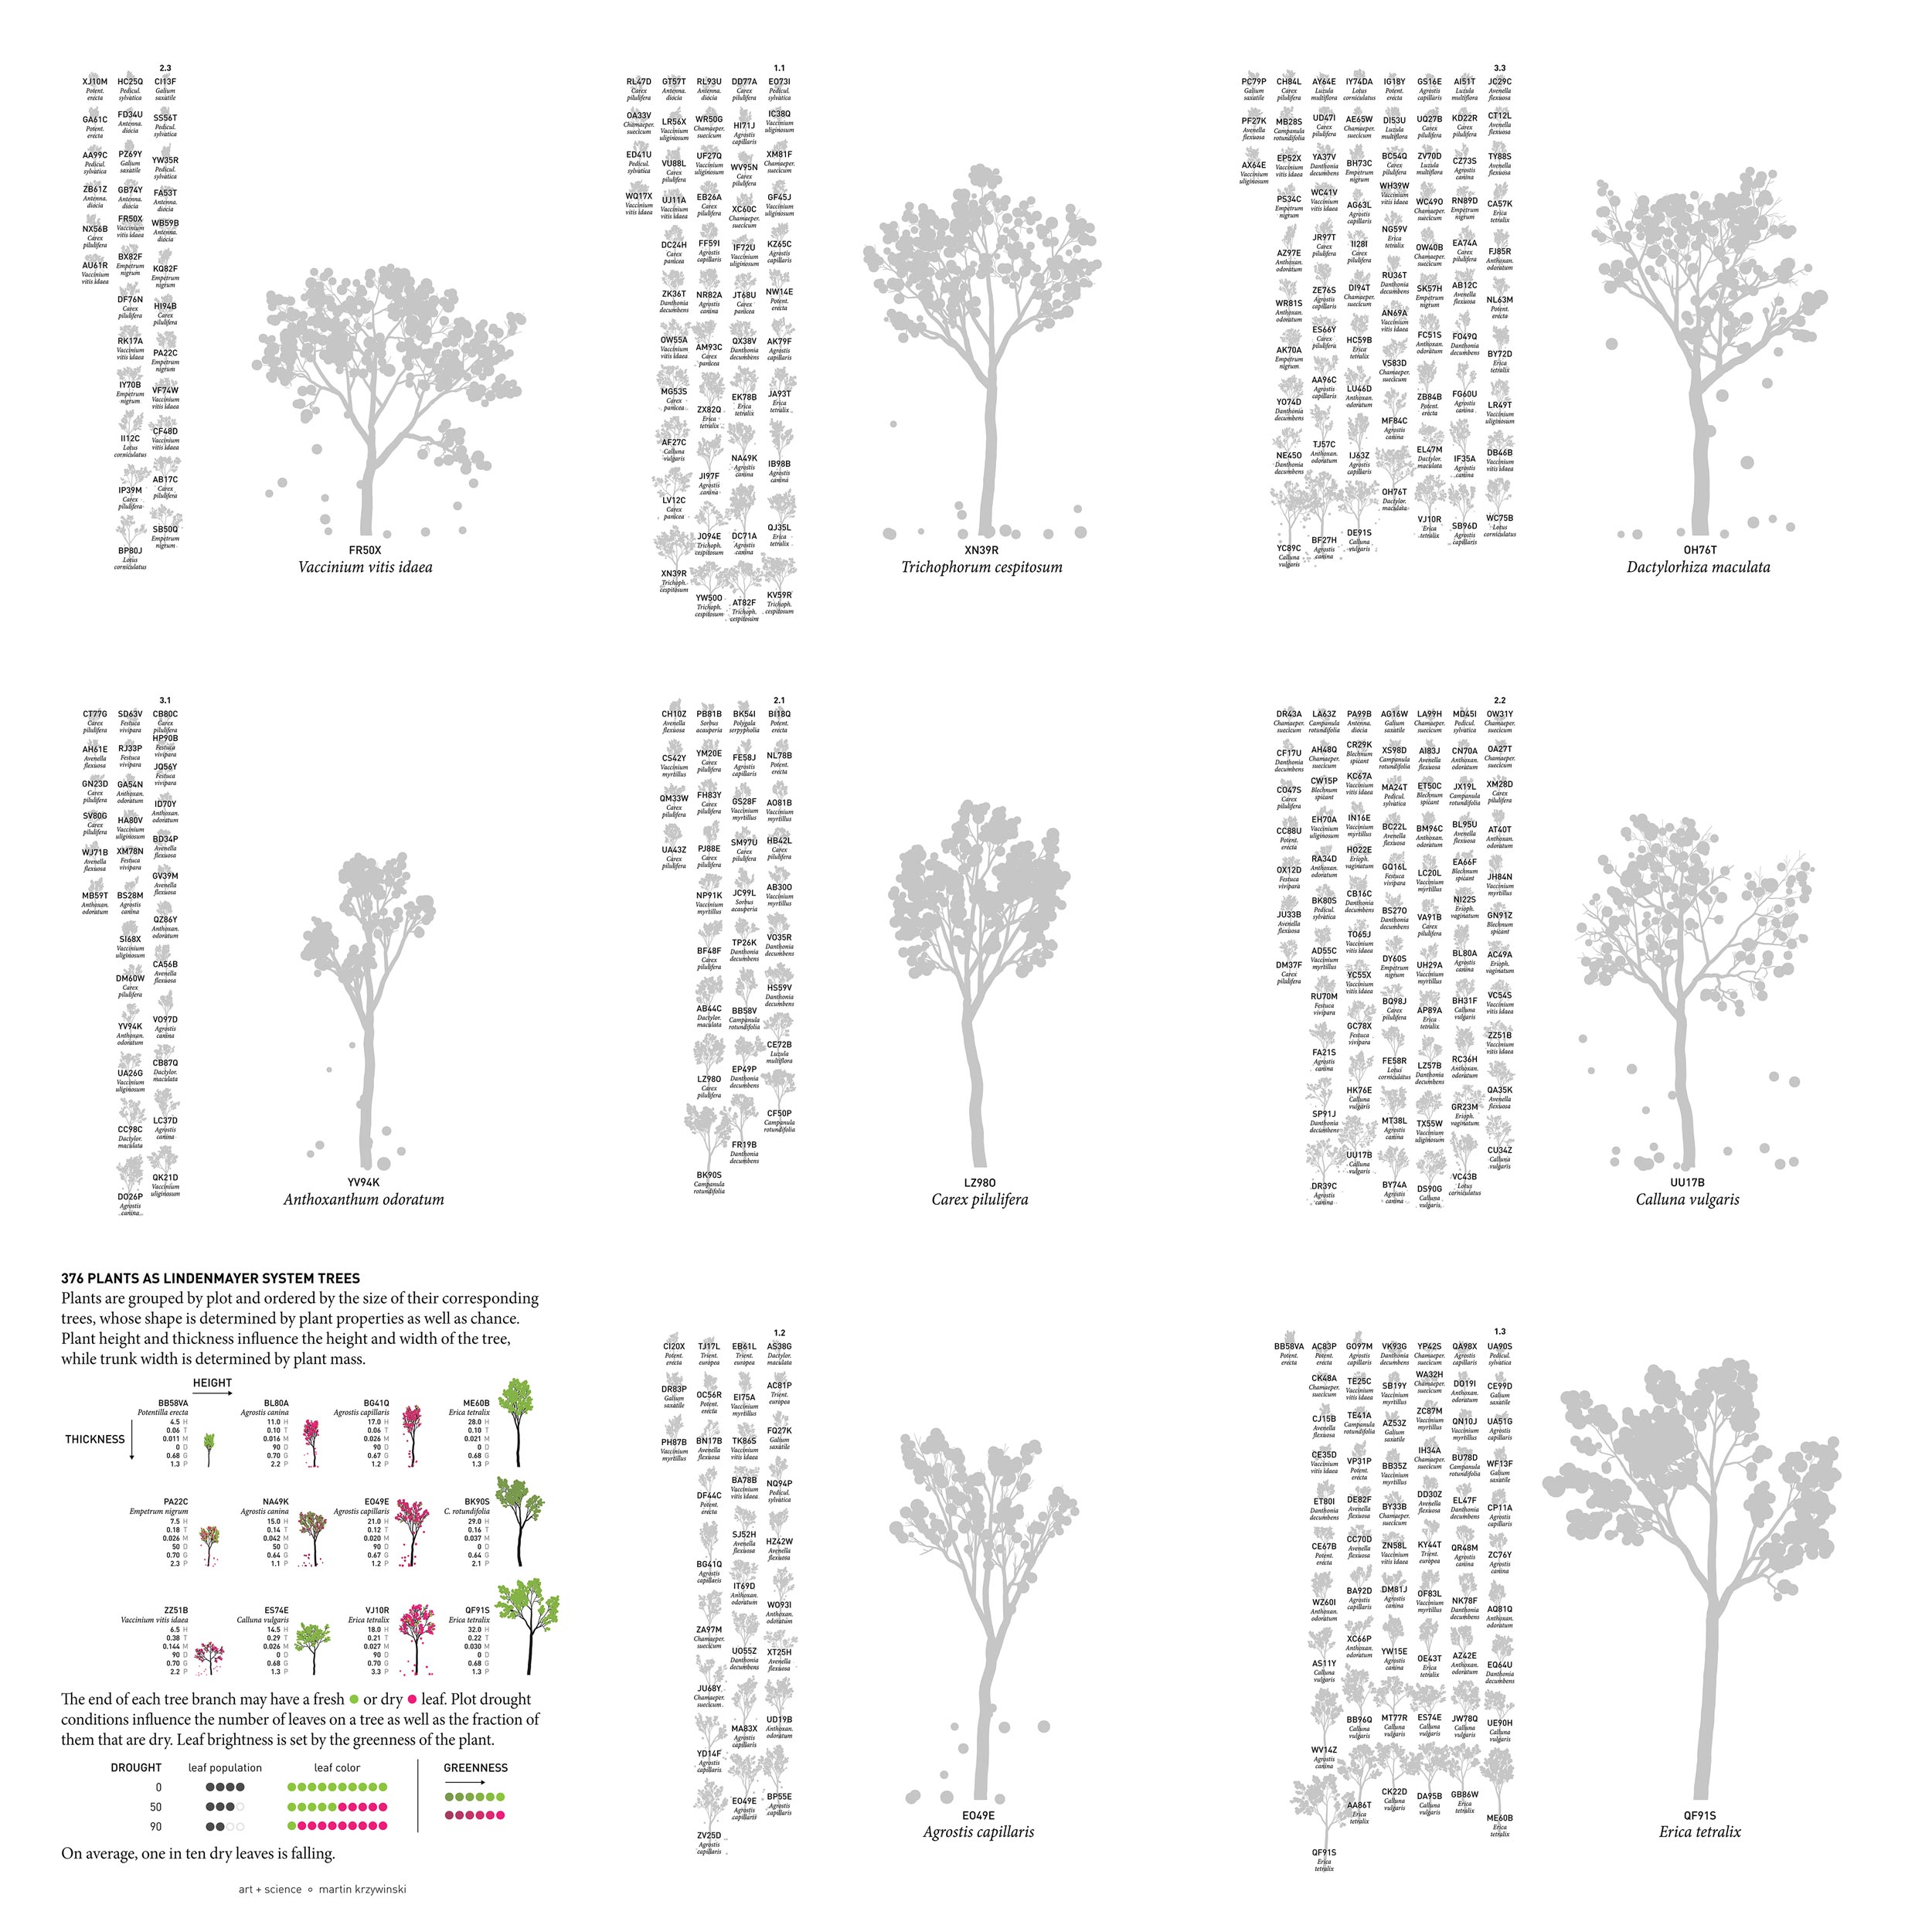
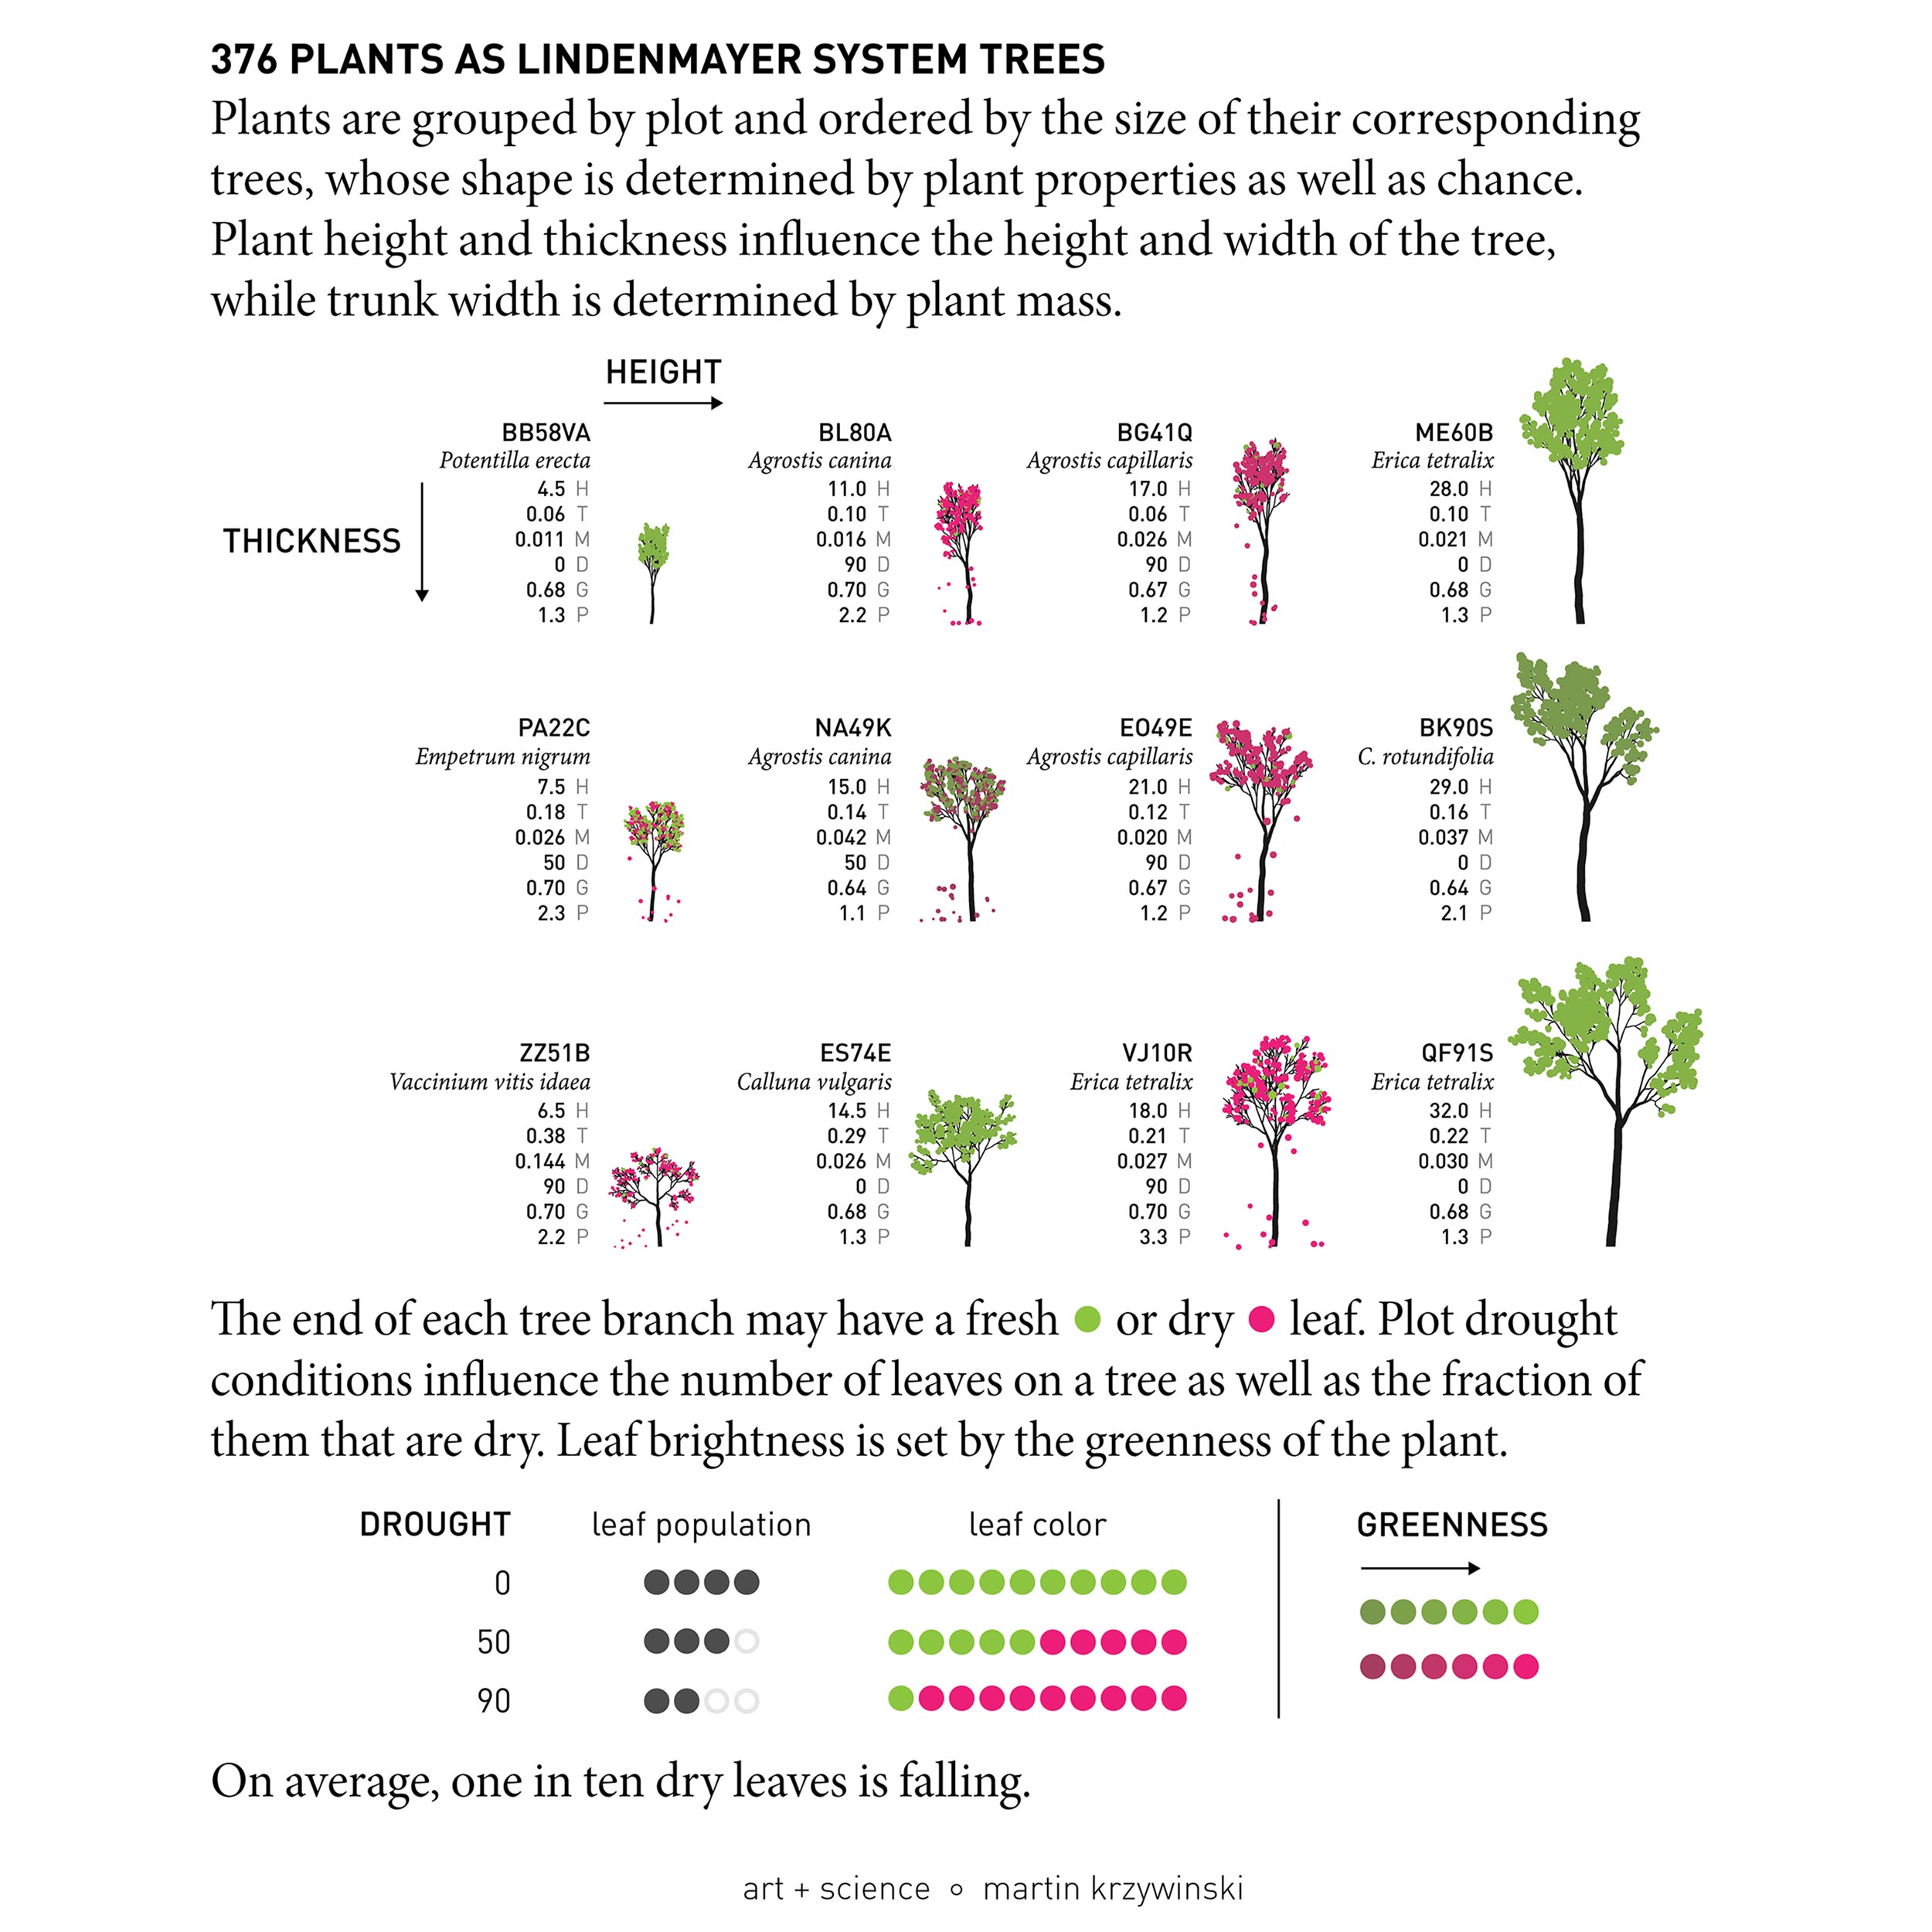
Since the dataset was a list of 376 individual plants, each annotated with species/genus and growth parameters such as height, mass and so on, and Ruben wanted something that is “not ... useful or anything” but rather “pretty to look at” based on “all the data she has collected and worked with for the last 4 years”.
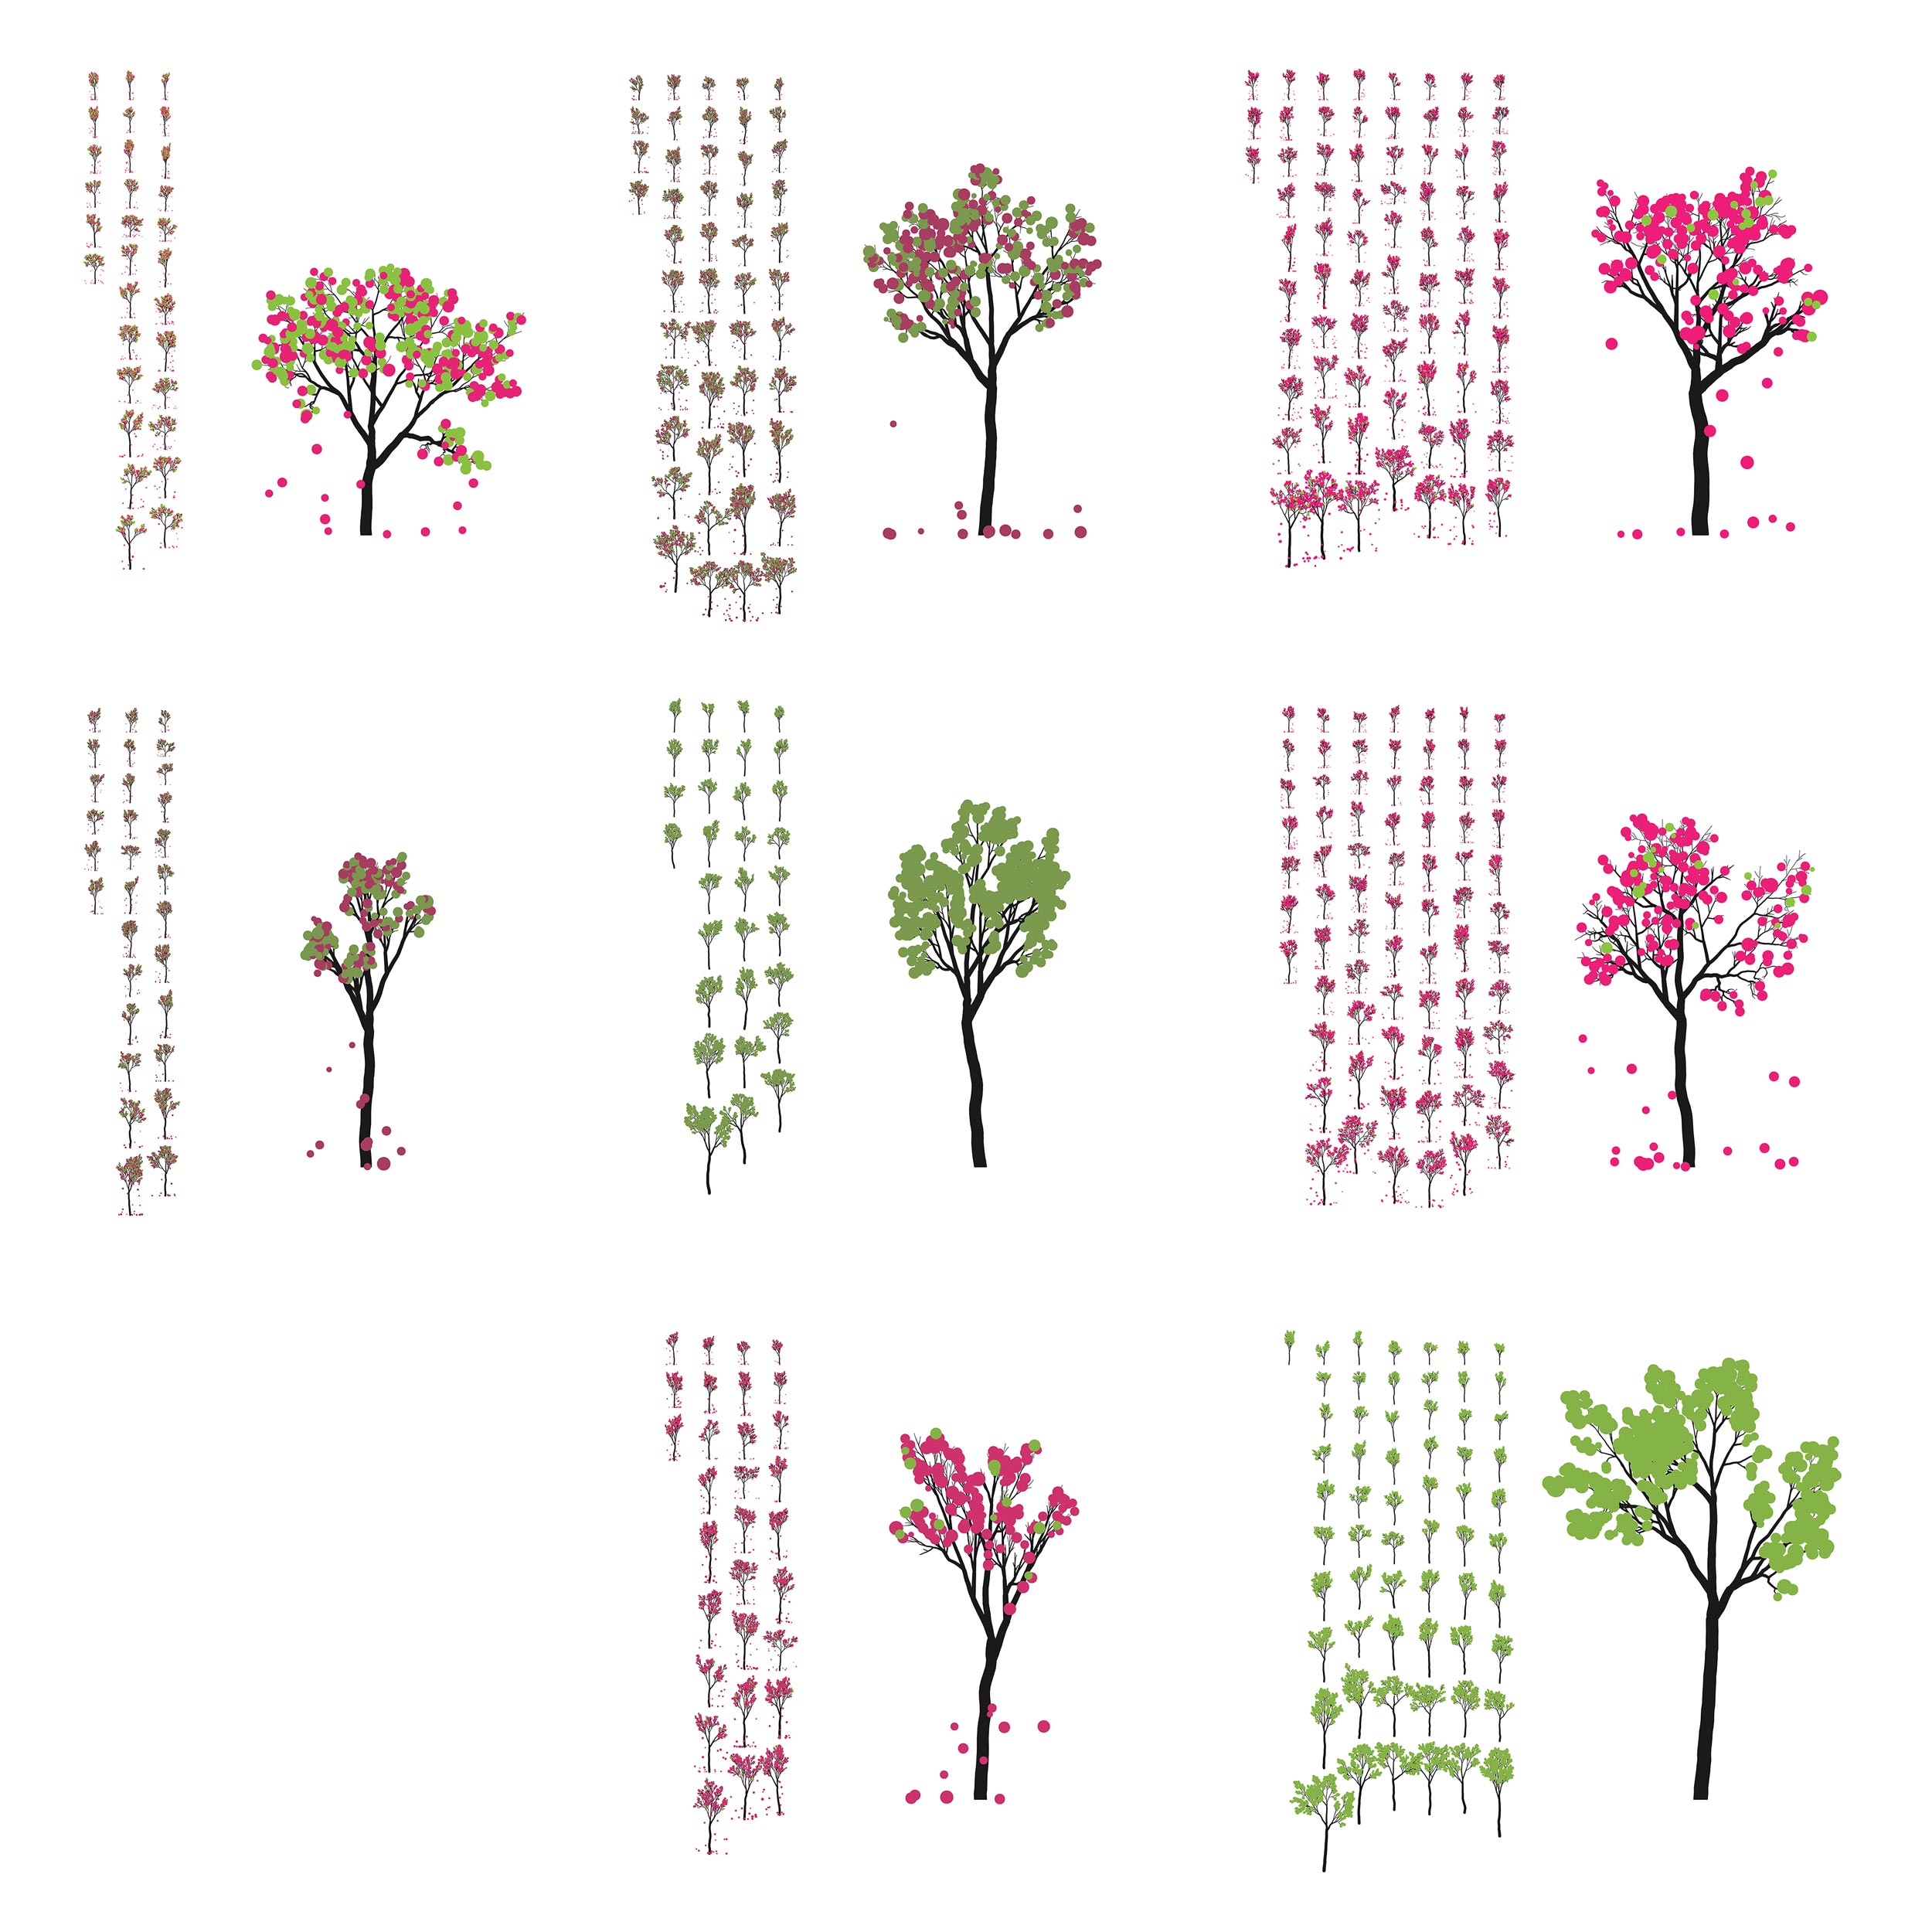
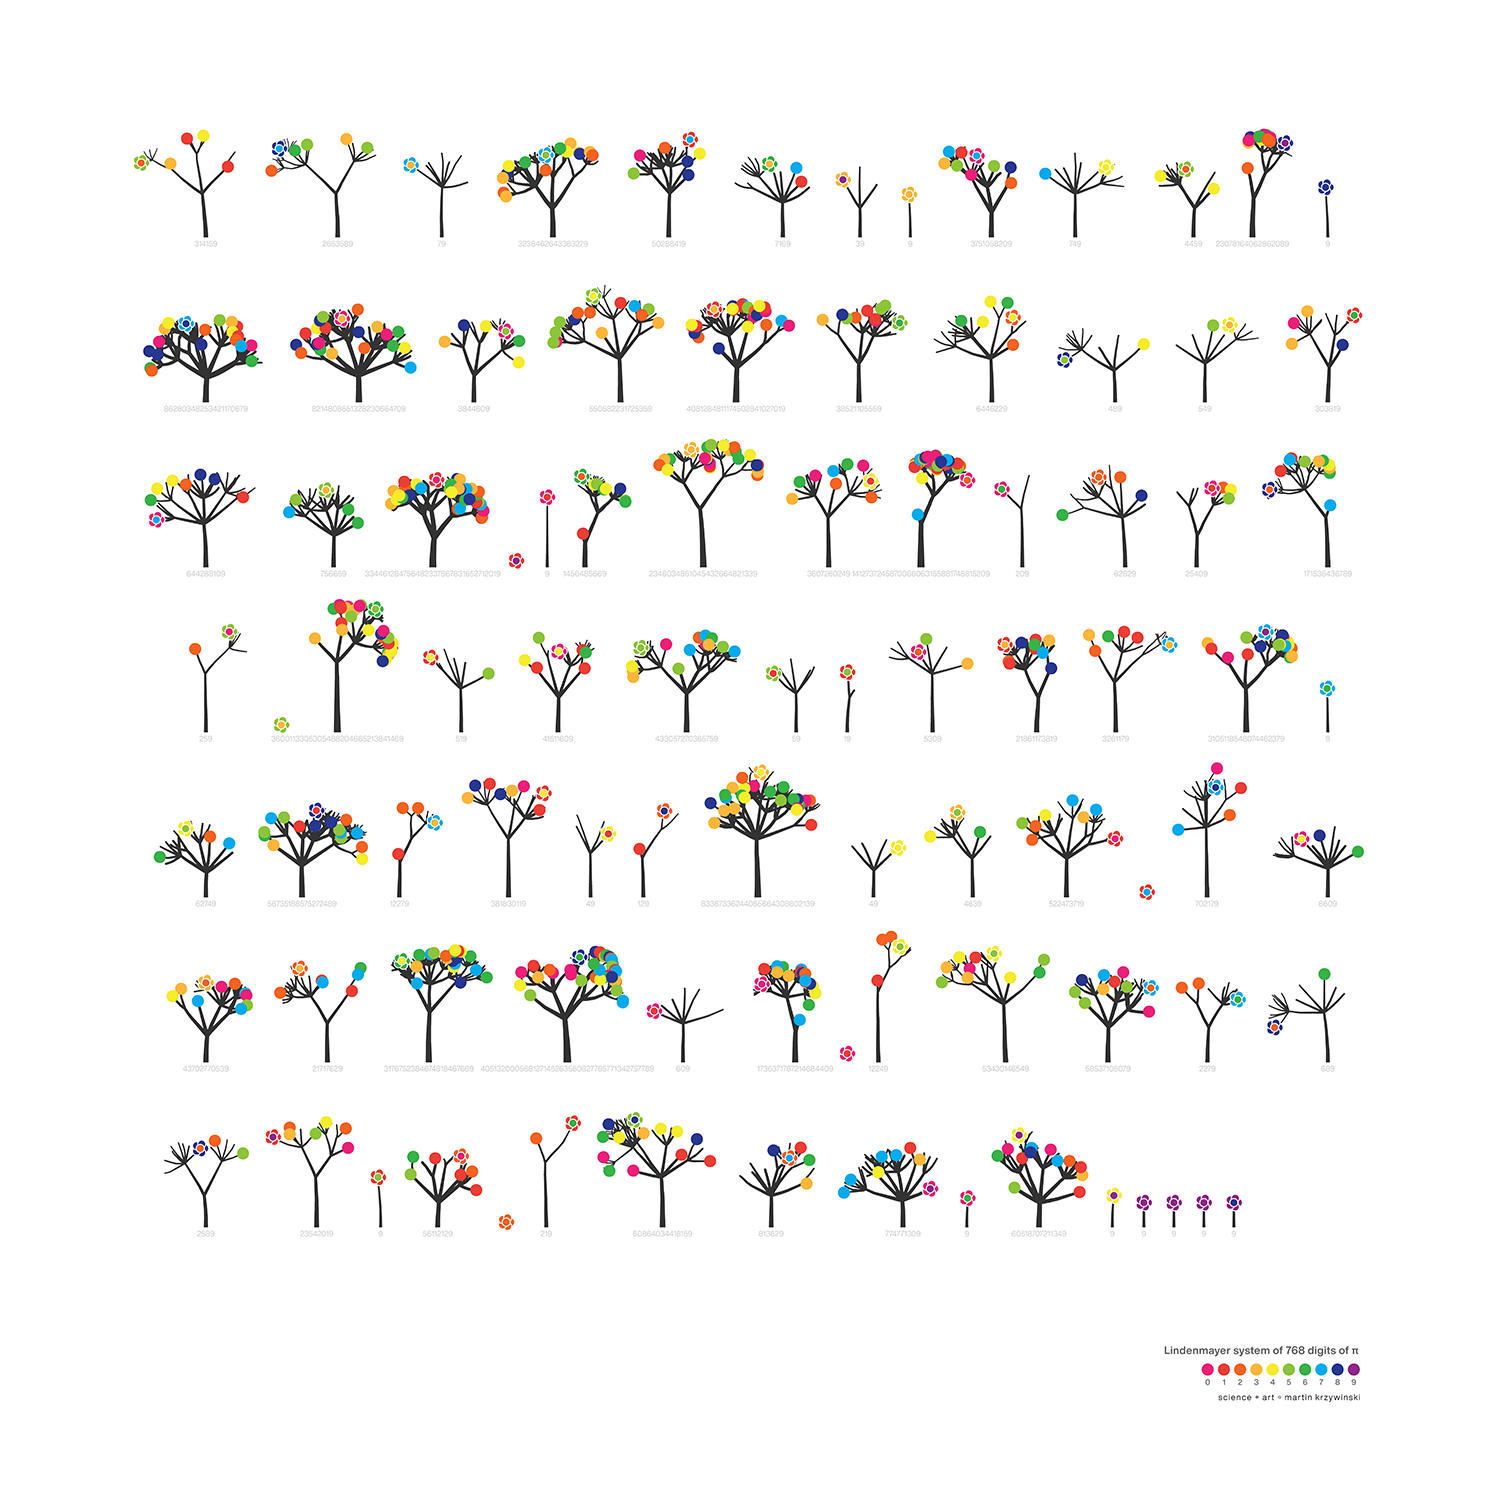
I thought it would be both useful and pretty to represent the plant data by ... growing trees — in silico. One way to do this is to use an L-system.
So, here's the data
id,year,site,genus,species,height,mass,thick,plot,drought,plotmass,green
AA86T,2019,Lygra,Erica,tetralix,27,0.02115,0.166,1.3,0,,0.675
AA96C,2019,Lygra,Agrostis,capillaris,9,0.01477,0.107,3.3,90,186.39,0.7025
AA99C,2019,Lygra,Pedicularis,sylvatica,4,0.01806,0.064,2.3,50,80.92,0.695625
AB12C,2019,Lygra,Avenella,flexuosa,6.5,0.03173,0.154,3.3,90,186.39,0.7025
AB17C,2019,Lygra,Carex,pilulifera,10,0.04504,0.154,2.3,50,80.92,0.695625
AB30O,2019,Lygra,Vaccinium,myrtillus,9,0.02605,0.116,2.1,0,111.11,0.636875
...
and here's the final poster.
I had such a great time with the L-systems that when Pi Day came around, I grew more trees. This time, using the digits of `\pi` to inform branching and sprouting.
So, for 2021 Pi Day, I tried to see the forest through the digits.
Browse my gallery of cover designs.
Nasa to send our human genome discs to the Moon
We'd like to say a ‘cosmic hello’: mathematics, culture, palaeontology, art and science, and ... human genomes.


Comparing classifier performance with baselines
All animals are equal, but some animals are more equal than others. —George Orwell
This month, we will illustrate the importance of establishing a baseline performance level.
Baselines are typically generated independently for each dataset using very simple models. Their role is to set the minimum level of acceptable performance and help with comparing relative improvements in performance of other models.

Unfortunately, baselines are often overlooked and, in the presence of a class imbalance5, must be established with care.
Megahed, F.M, Chen, Y-J., Jones-Farmer, A., Rigdon, S.E., Krzywinski, M. & Altman, N. (2024) Points of significance: Comparing classifier performance with baselines. Nat. Methods 20.
Happy 2024 π Day—
sunflowers ho!
Celebrate π Day (March 14th) and dig into the digit garden. Let's grow something.

How Analyzing Cosmic Nothing Might Explain Everything
Huge empty areas of the universe called voids could help solve the greatest mysteries in the cosmos.
My graphic accompanying How Analyzing Cosmic Nothing Might Explain Everything in the January 2024 issue of Scientific American depicts the entire Universe in a two-page spread — full of nothing.

The graphic uses the latest data from SDSS 12 and is an update to my Superclusters and Voids poster.
Michael Lemonick (editor) explains on the graphic:
“Regions of relatively empty space called cosmic voids are everywhere in the universe, and scientists believe studying their size, shape and spread across the cosmos could help them understand dark matter, dark energy and other big mysteries.
To use voids in this way, astronomers must map these regions in detail—a project that is just beginning.
Shown here are voids discovered by the Sloan Digital Sky Survey (SDSS), along with a selection of 16 previously named voids. Scientists expect voids to be evenly distributed throughout space—the lack of voids in some regions on the globe simply reflects SDSS’s sky coverage.”
voids
Sofia Contarini, Alice Pisani, Nico Hamaus, Federico Marulli Lauro Moscardini & Marco Baldi (2023) Cosmological Constraints from the BOSS DR12 Void Size Function Astrophysical Journal 953:46.
Nico Hamaus, Alice Pisani, Jin-Ah Choi, Guilhem Lavaux, Benjamin D. Wandelt & Jochen Weller (2020) Journal of Cosmology and Astroparticle Physics 2020:023.
Sloan Digital Sky Survey Data Release 12
Alan MacRobert (Sky & Telescope), Paulina Rowicka/Martin Krzywinski (revisions & Microscopium)
Hoffleit & Warren Jr. (1991) The Bright Star Catalog, 5th Revised Edition (Preliminary Version).
H0 = 67.4 km/(Mpc·s), Ωm = 0.315, Ωv = 0.685. Planck collaboration Planck 2018 results. VI. Cosmological parameters (2018).
constellation figures
stars
cosmology
Error in predictor variables
It is the mark of an educated mind to rest satisfied with the degree of precision that the nature of the subject admits and not to seek exactness where only an approximation is possible. —Aristotle
In regression, the predictors are (typically) assumed to have known values that are measured without error.
Practically, however, predictors are often measured with error. This has a profound (but predictable) effect on the estimates of relationships among variables – the so-called “error in variables” problem.

Error in measuring the predictors is often ignored. In this column, we discuss when ignoring this error is harmless and when it can lead to large bias that can leads us to miss important effects.
Altman, N. & Krzywinski, M. (2024) Points of significance: Error in predictor variables. Nat. Methods 20.
Background reading
Altman, N. & Krzywinski, M. (2015) Points of significance: Simple linear regression. Nat. Methods 12:999–1000.
Lever, J., Krzywinski, M. & Altman, N. (2016) Points of significance: Logistic regression. Nat. Methods 13:541–542 (2016).
Das, K., Krzywinski, M. & Altman, N. (2019) Points of significance: Quantile regression. Nat. Methods 16:451–452.