Thoughts rearrange, familiar now strange.
•
• break flowers
• more quotes


very clickable
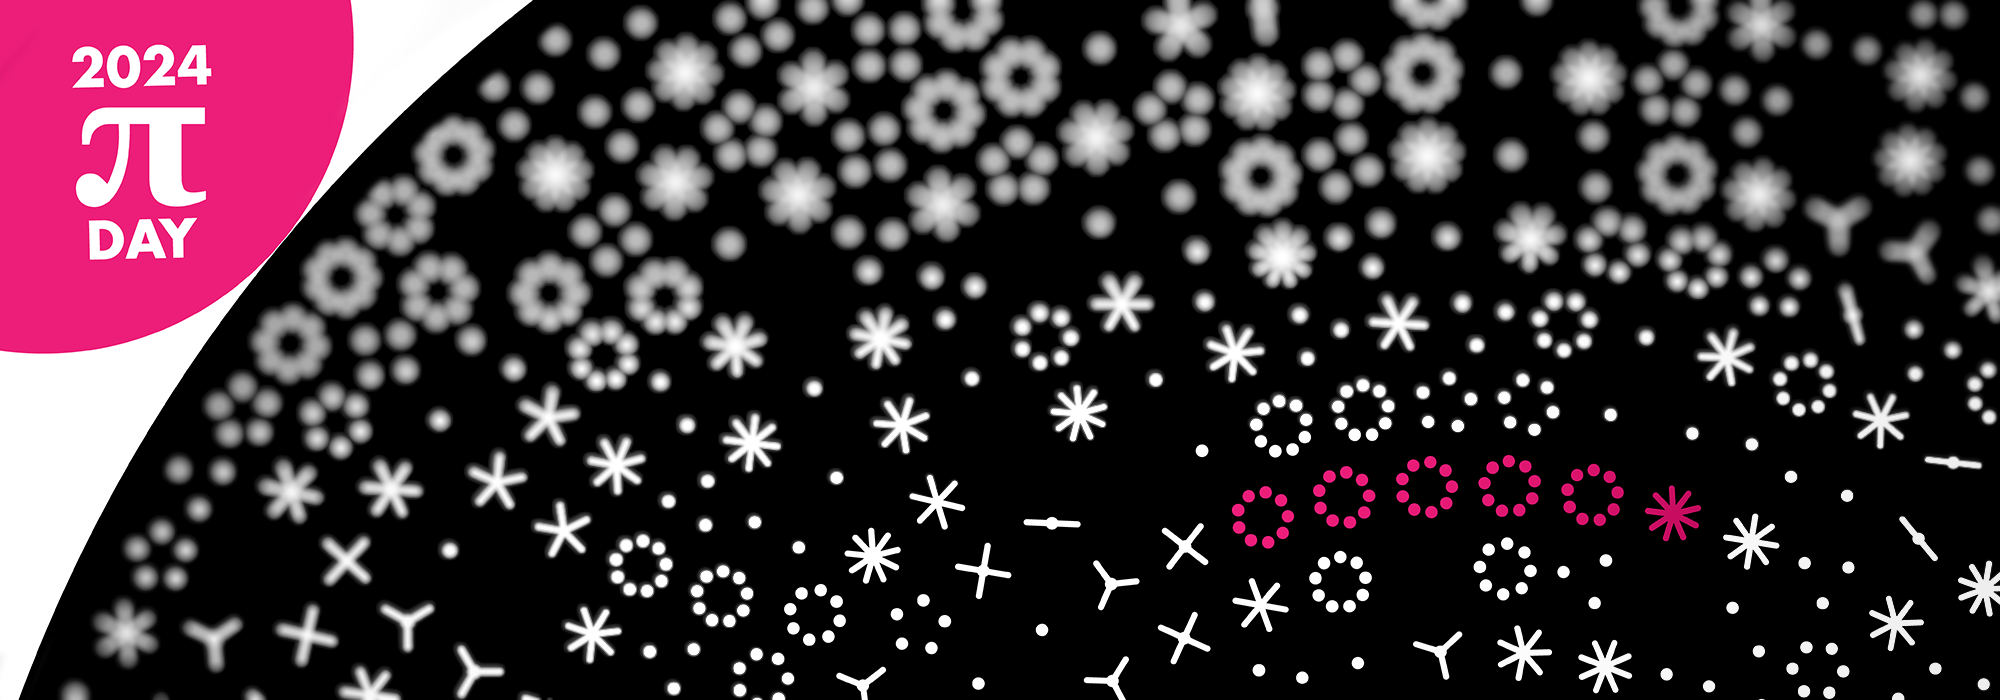
π day
·
ASCII
·
choices
·
clocks
·
color
·
constellations
NEW
·
covers
NEW
·
deadly genomes
NEW
·
debates
·
emotions
·
famous rat
·
gigapixel skies
NEW
·
hitchens
·
keyboards
·
languages
·
LOTRO
·
photography
·
questions
·
quotes
·
road trips
·
rockets
·
satire
·
spam poetry
·
time
·
tripsum
·
type
·
unwords
·
voids
·
words
·
writing
·
zaomm
data visualization
+ art
Covers — Journals, Books and Magazines
my designs
These designs could not have happened without the insight and vision of the journals' art directors. Thank you for kicking me into a higher gear.


others' designs that use my images or software
This list is incomplete. If you do not see your cover here, let me know.


publication
Cell Genomics
vol
3
issue
1
date
11 January 2023
citation
Akbari, V. et al. Parent-of-origin detection and chromosome-scale haplotyping using long-read DNA methylation sequencing and Strand-seq (2023) Cell Genomics 3(1).
DOI
10.1016/j.xgen.2022.100233
about
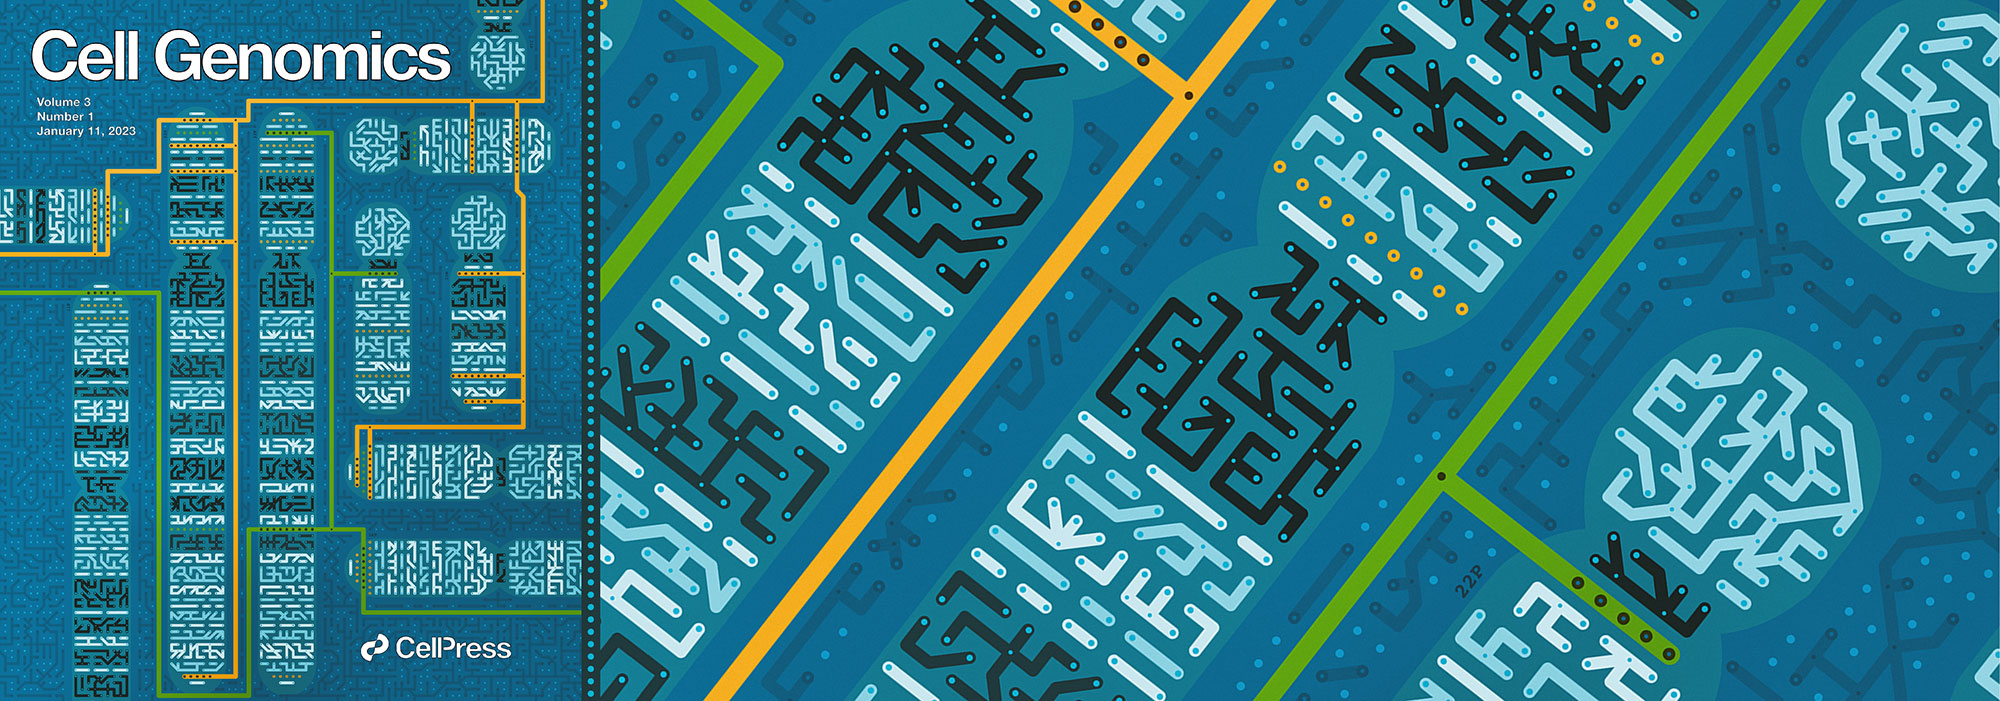
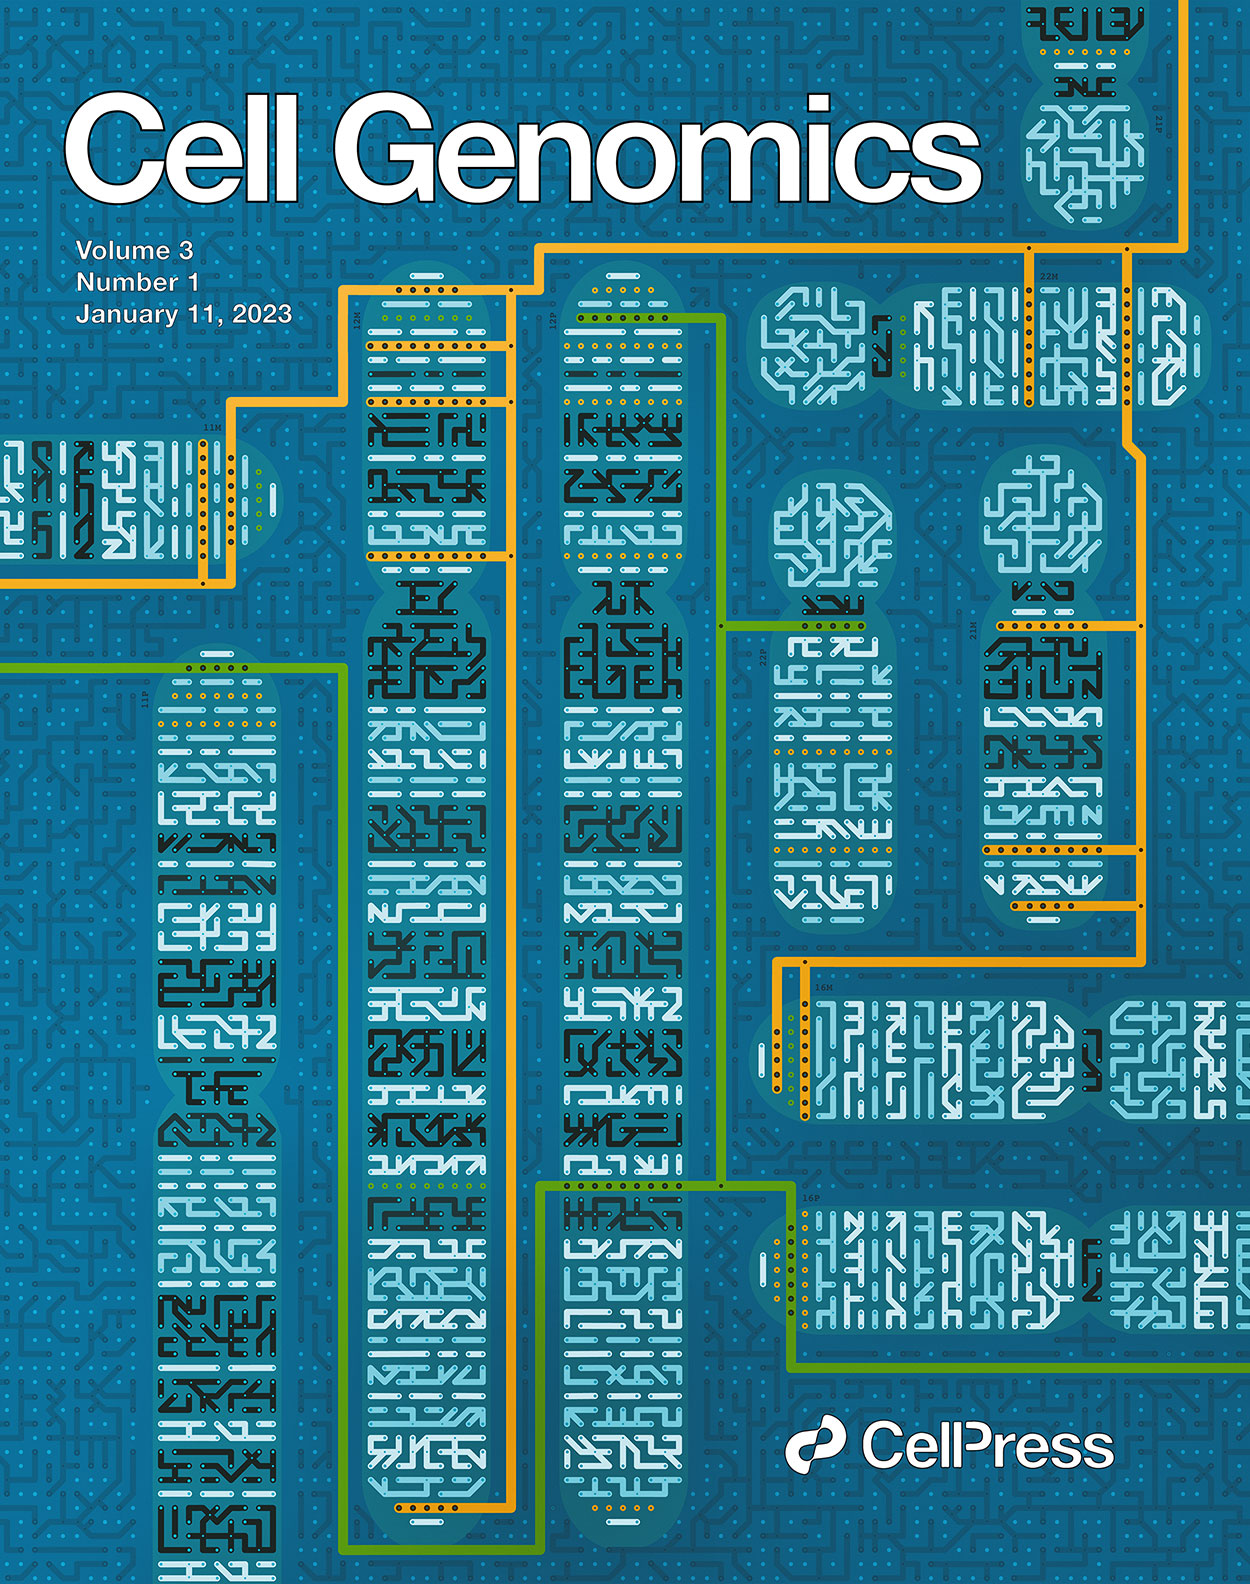
In this issue of Cell Genomics, Akbari et al. describe a method to assign individual alleles to their parent-of-origin. The method does not require any parental DNA but rather utilizes chromosome-scale haplotyping and epigenetically imprinted regions to make the assignment. In the cover image, the process of determining the parent-of-origin using differential methylation of alleles at imprinted regions (iDMRs) in chromosomes is imagined as a circuit. Shown are chromosomes (11, 12, 16, 21, and 22) with imprinted loci as rows of colored dots (orange maternal, green paternal). Independent circuits connect the chromosomes with a maternal (orange line) and paternal (green line) origin. Cytogenetic bands are depicted as independent circuits, colored by the conventional banding pattern.
credit
design in collaboration with Carlos Urzua
publication
Science Advances
vol
9
issue
1
date
6 January 2023
citation
Kijima, Y et al. A universal sequencing read interpreter (2023) Science Advances 9, eadd2793.
DOI
10.1126/sciadv.add2793
about
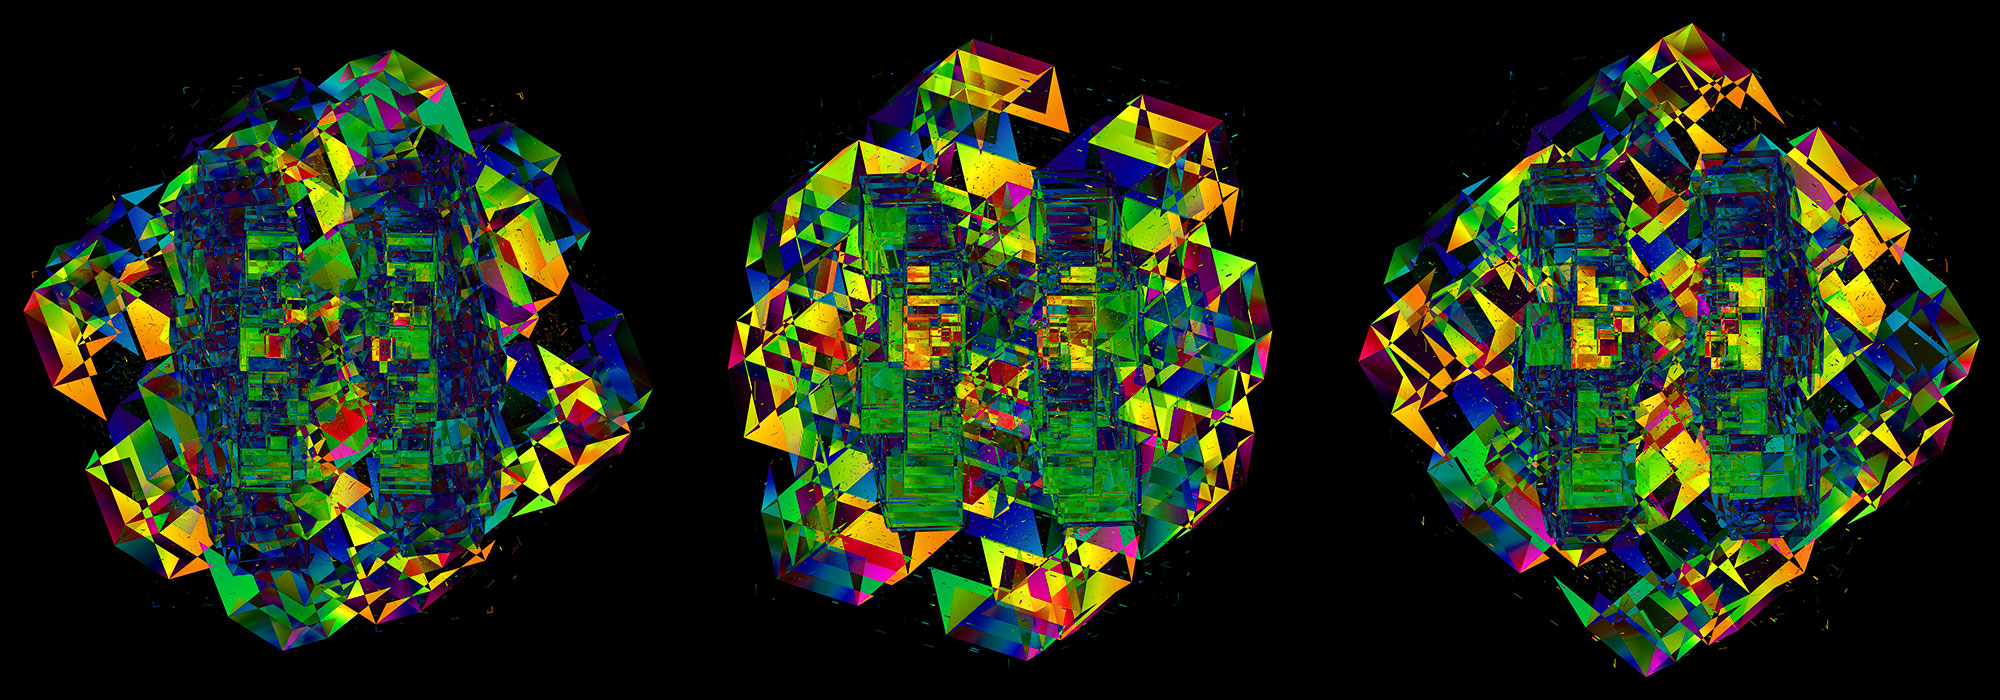
DNA sequencing read translation in high-dimensional space. The cover image was created when 672 bases of sequencing barcodes generated by three different single-cell RNA sequencing platforms were encoded as oriented triangles on the faces of three 7-dimensional cubes. Kijima et al. have developed a software tool that interprets DNA sequences to extract encoded information for additional biological analysis. The tool called, INTERSTELLAR, will facilitate development of sequencing-based experiments and sharing of data analysis pipelines.
details
publication
Annals of Oncology
vol
33
issue
9
date
1 September 2022
citation
Pleasance E et al. Whole-genome and transcriptome analysis enhances precision cancer treatment options (2022) Ann Oncology 33:939–949.
DOI
10.1016/j.annonc.2022.05.522
about
The illustration shows the landscape of actionable alterations (concentric circles) and consequent clinical actions (wedges, with start and duration mapped onto angle) for each of the 570 POG cases. Colors encode the type of alteration. Clinical action wedges are colored by the type of alteration that informed them — grey if the therapy is informed by multiple categories of alterations.
publication
Nature Biotechnology
vol
40
issue
4
date
11 April 2022
citation
Konno N et al. Deep distributed computing to reconstruct extremely large lineage trees (2022) Nature Biotechnology 40:566–575.
DOI
10.1038/s41587-021-01111-2
about
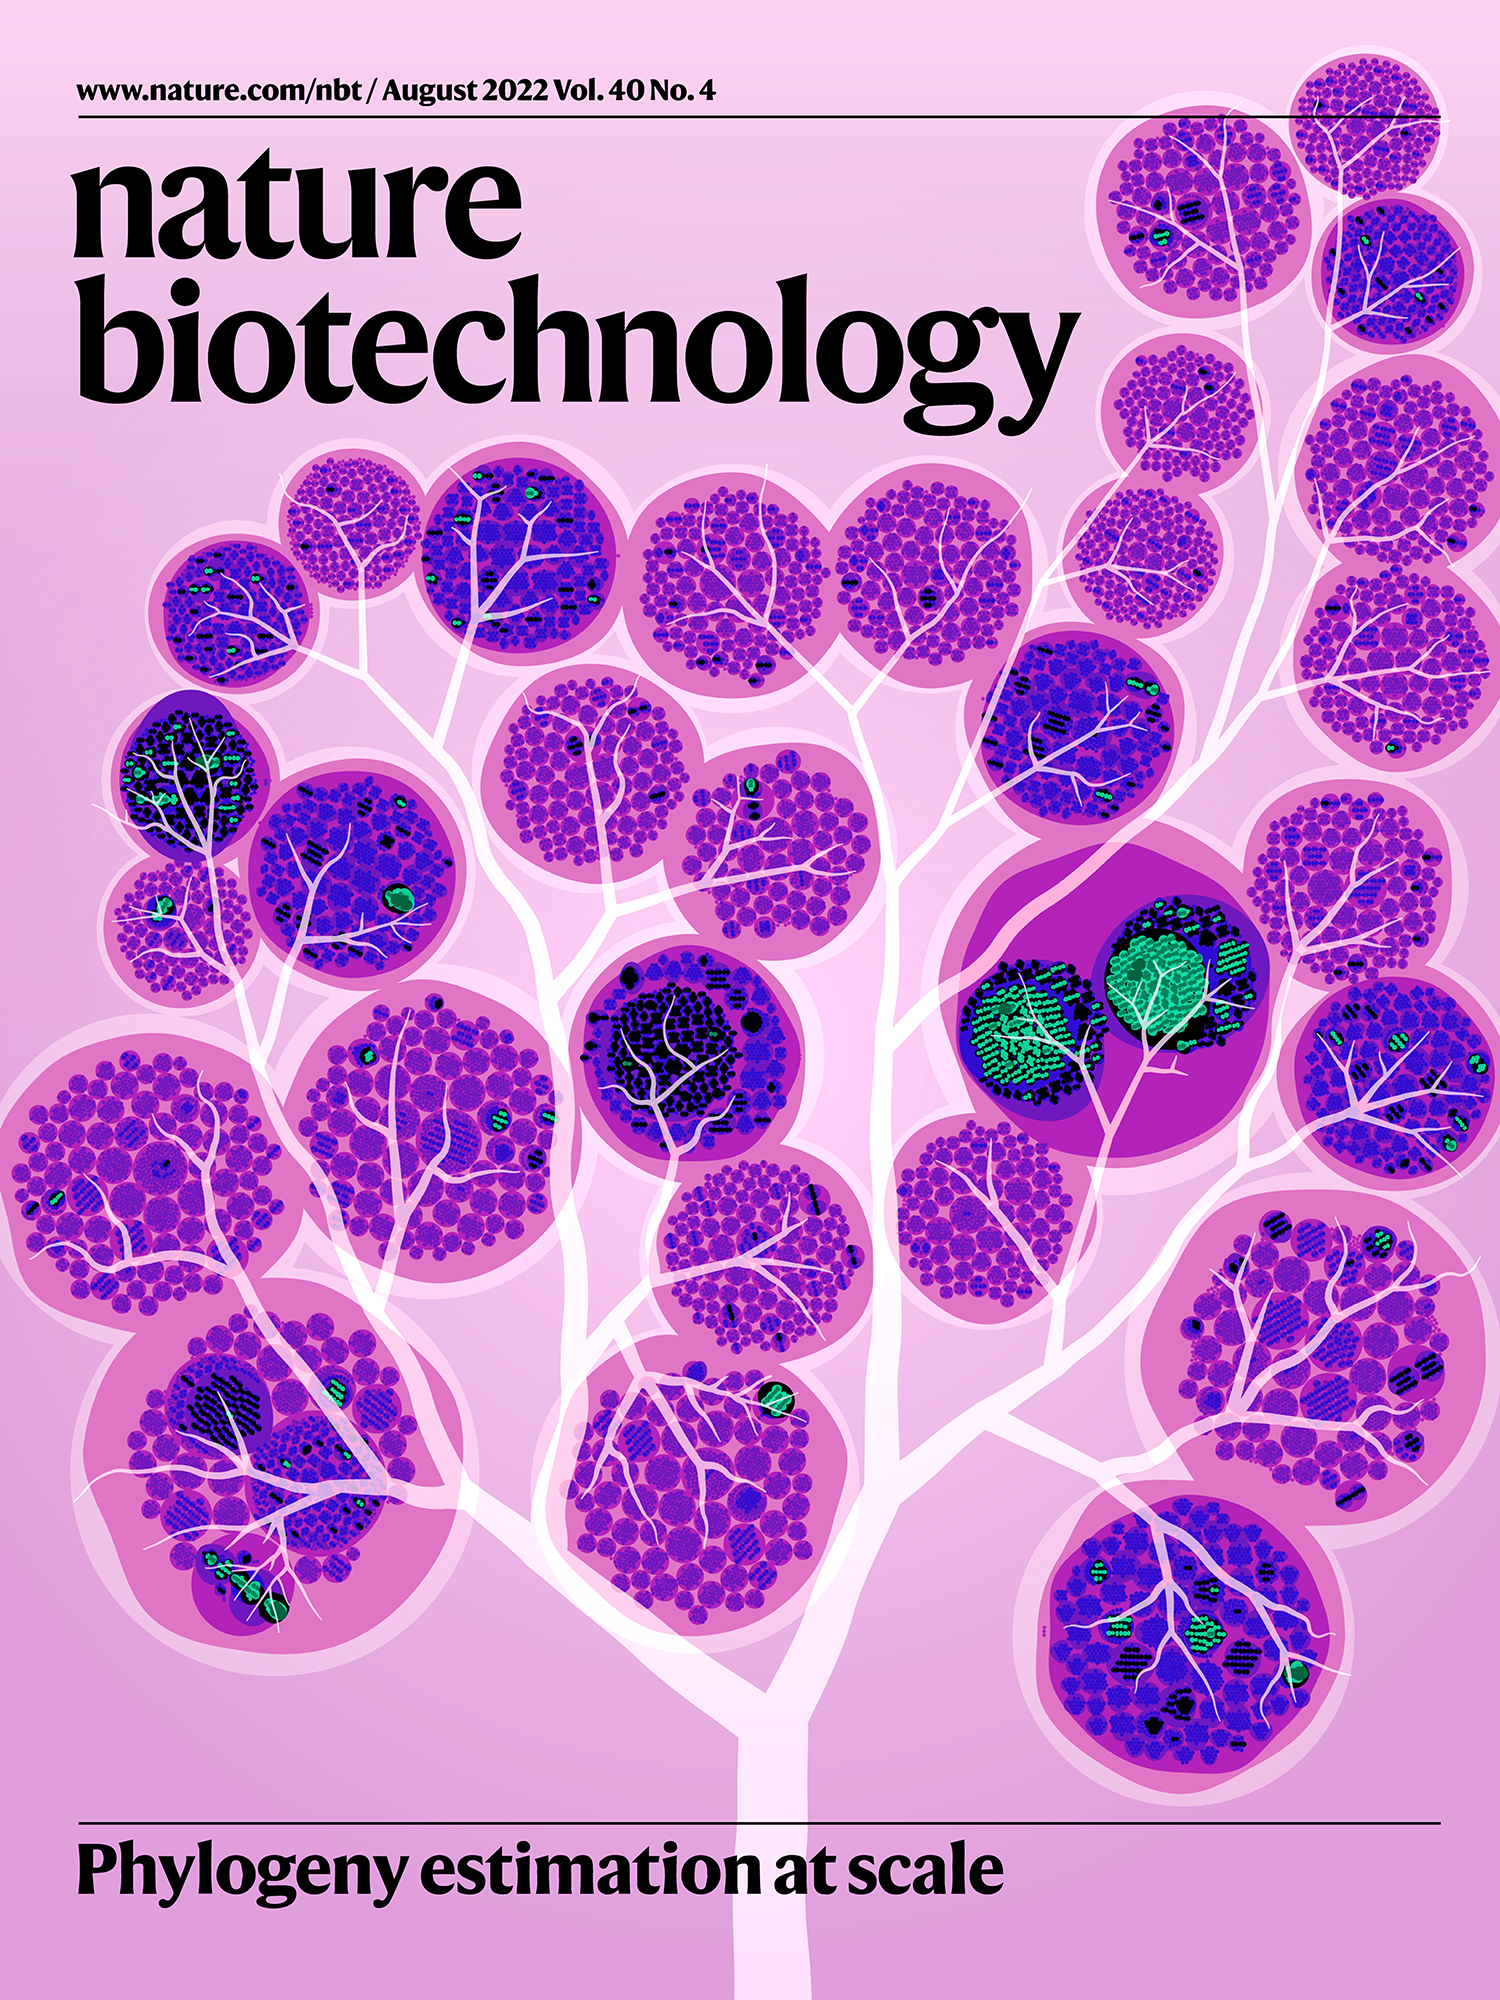
Artist’s impression of a phylogenetic tree. Konno et al. present a highly efficient distributed computing method for the reconstruction of evolutionary trees from very large datasets.
details
publication
Cancer Cell
vol
40
issue
4
date
11 April 2022
citation
LeBlanc VG et al. Single-cell landscapes of primary glioblastomas and matched explants and cell lines show variable retention of inter- and intratumor heterogeneity (2022) Cancer Cell 40:379–392.E9.
DOI
10.1016/j.ccell.2022.02.016
about
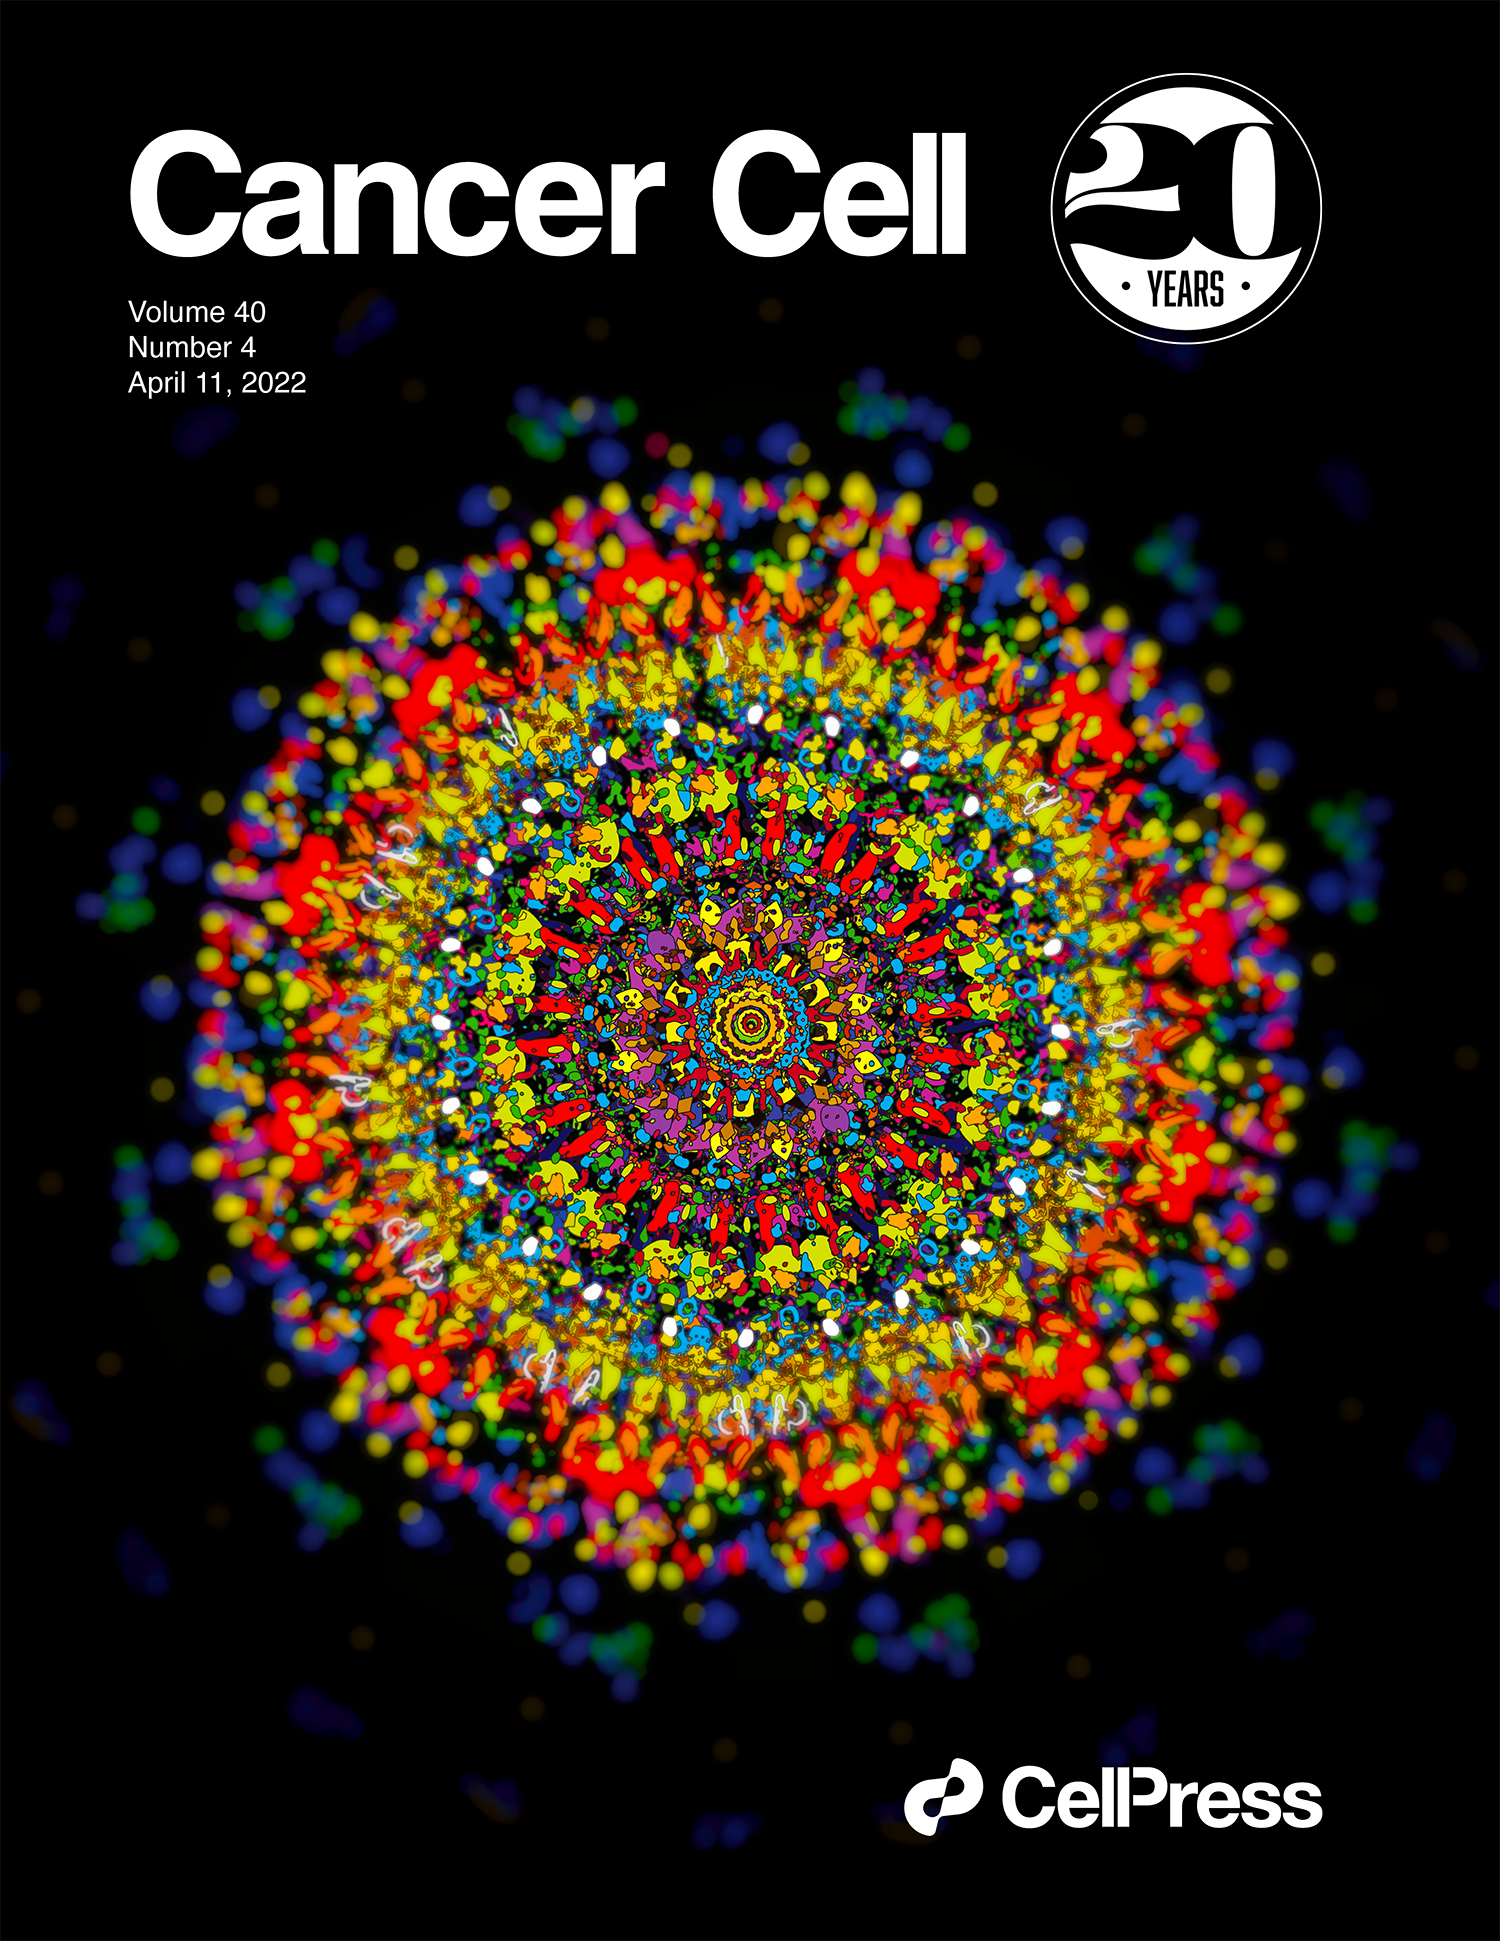
Glioblastomas (GBMs) are notoriously heterogeneous, contributing to their aggressive phenotype. In this issue, LeBlanc et al. use single-cell genomic approaches to show that novel explant models of GBM largely retain the genetic and transcriptional heterogeneity of their parent tumors. Their findings highlight how detailed molecular characterization of model systems is a necessary first step to their informed use. The artwork depicts cellular heterogeneity as a kaleidoscope generated from immunofluorescence staining of the glial and neuronal markers MBP and NeuN (respectively) in a GBM patient-derived explant.
publication
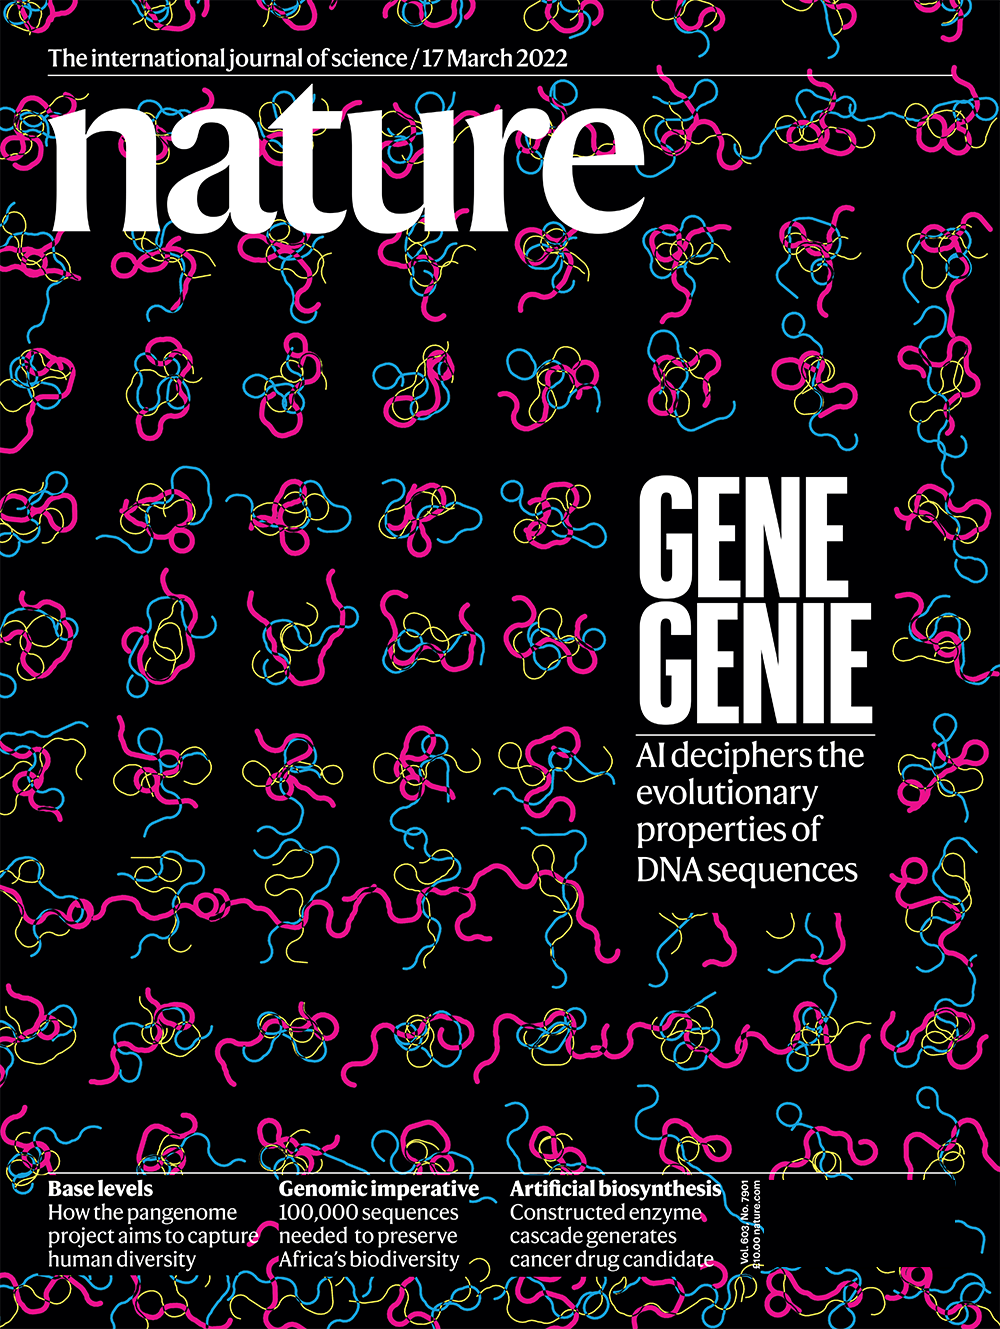
Nature
vol
603
issue
7901
date
17 March 2022
citation
Vaishnav ED et al. The evolution, evolvability and engineering of gene regulatory DNA (2022) Nature 603:455–463.
DOI
10.1038/s41586-022-04506-6
about
For more than 50 years, scientists have been trying to understand the relationship between DNA sequence, gene-expression phenotype and fitness to decipher principles of gene regulatory evolution. In this week’s issue, Eeshit Dhaval Vaishnav, Carl de Boer, Aviv Regev and their colleagues present a framework for understanding and engineering regulatory DNA sequences that takes a step towards this goal. The researchers built this framework around an ‘oracle’ they developed using a deep neural network model that predicts gene expression given a promoter DNA sequence. The neural network was trained using the expression measurements for tens of millions of promoter sequences. The result was an AI oracle that predicts expression from sequence well enough to study the evolutionary history and future evolvability of regulatory DNA sequences, as well as to design regulatory DNA sequences for synthetic biology applications. The cover offers a visual representation of the evolutionary properties of sequences at the extremes of the evolvability spectrum.
publication
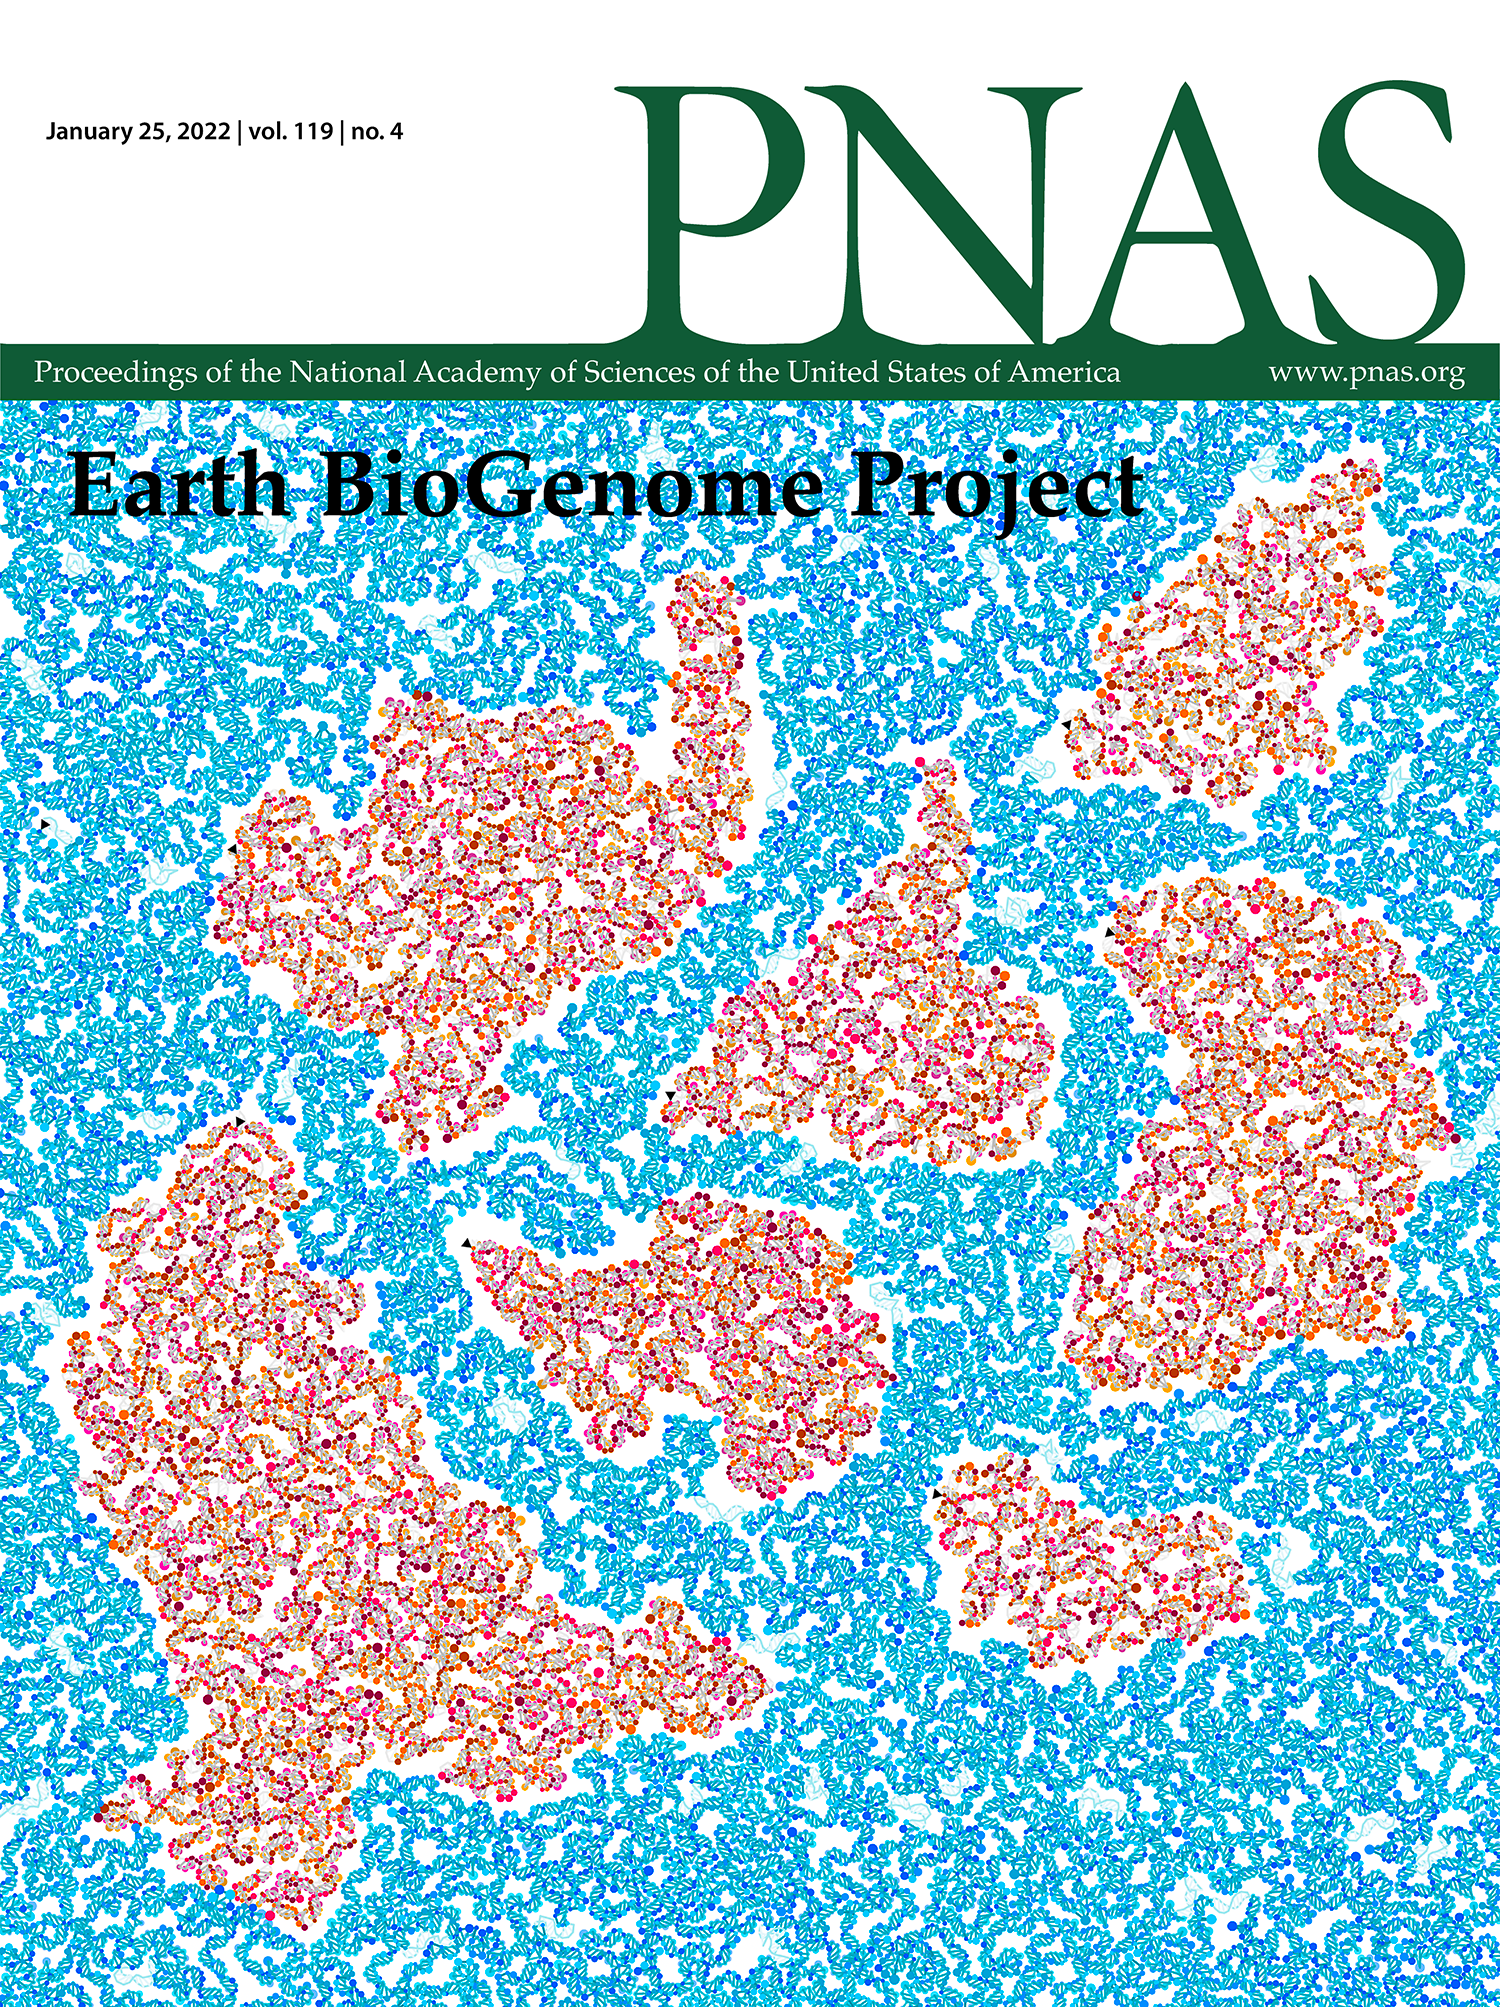
PNAS
special issue
Earth BioGenome Project
vol
119
issue
4
date
25 January 2022
citation
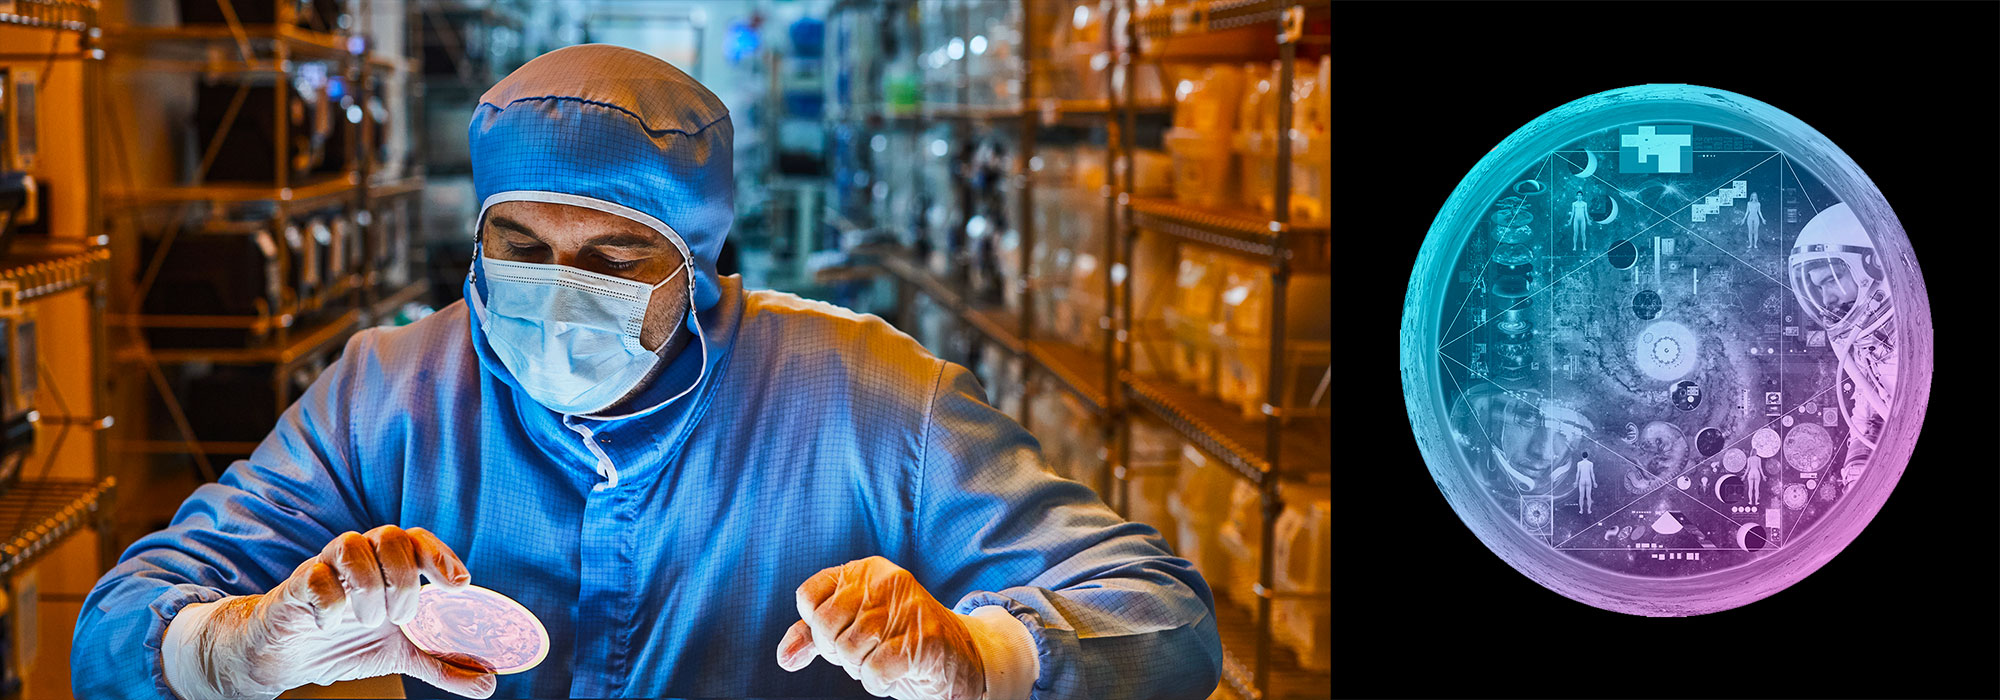
Lewin HA et al., The Earth BioGenome Project 2020: Starting the clock. (2022) PNAS 119(4) e2115635118
DOI
doi.org/10.1073/pnas.2115635118
about
A view of Earth that captures the vision of the Earth BioGenome Project — understanding and conserving genetic diversity on a global scale. Continents from the Authagraph projection, which preserves areas and shapes, are represented as a double helix of 32,111 bases. Short sequences of 806 unique species, sequenced as part of EBP-affiliated projects, are mapped onto the double helix of the continent (or ocean) where the species is commonly found. The length of the sequence is the same for each species on a continent (or ocean) and the sequences are separated by short gaps. Individual bases of the sequence are colored by dots. Species appear along the path in alphabetical order (by Latin name) and the first base of the first species is identified by a small black triangle.
details
publication
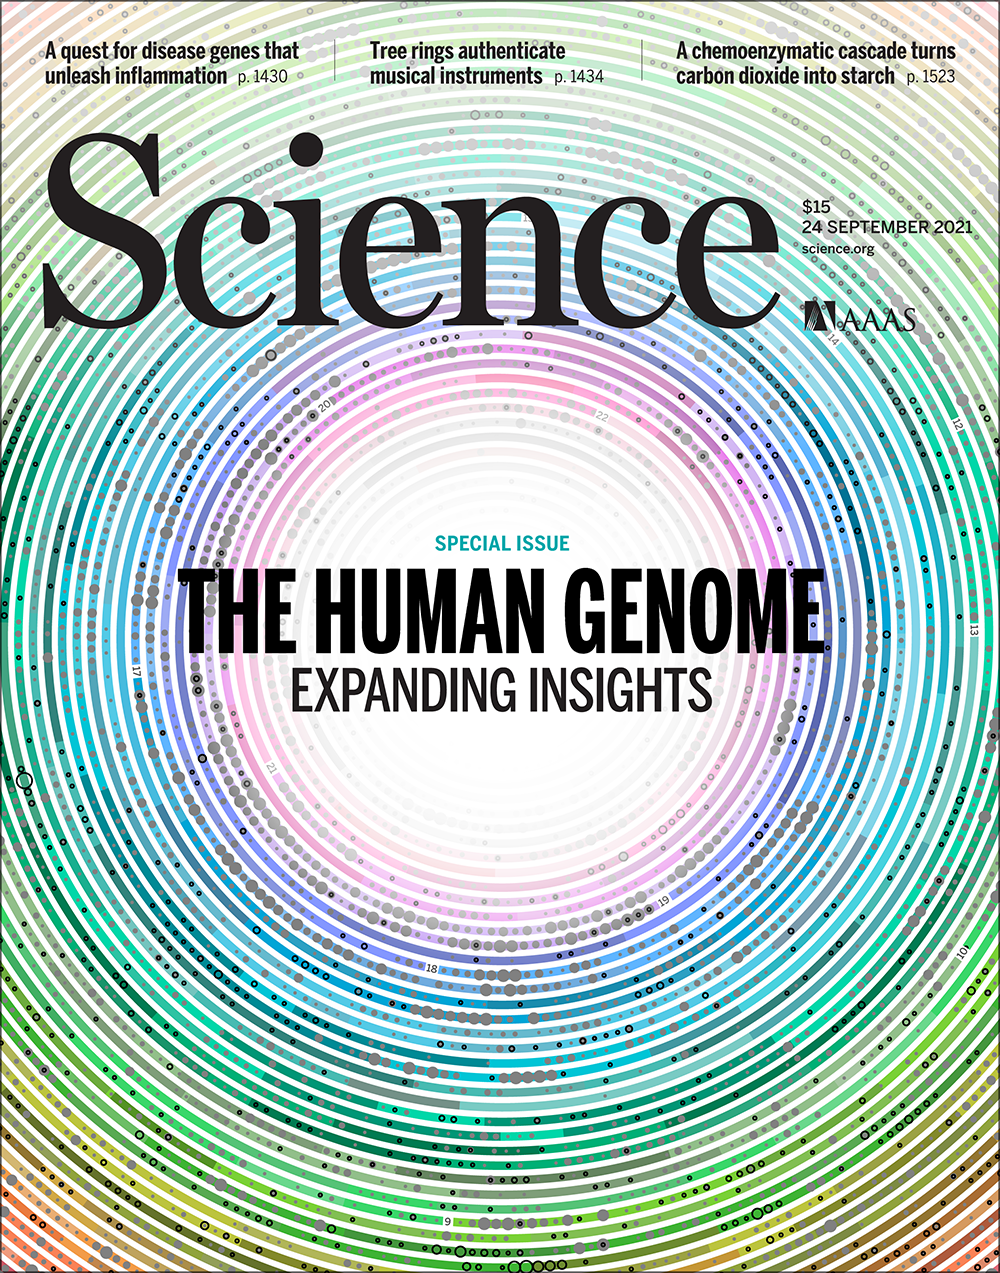
Science
special issue
The Human Genome special issue
vol
373
issue
6562
date
24 September 2021
citation
Zahn LM. The human genome: A Research Ultramarathon. Science 373, 1458–1459.
DOI
10.1126/science.abm1359
about
Visualization of the human genome as a spiral (scale: 1 million bases per centimeter), with colored segments representing different chromosomes. Circle size denotes the number of genes associated with Mendelian disorders and hollow circles indicate the number of mutation clusters from a pan-cancer analysis.
details
publication
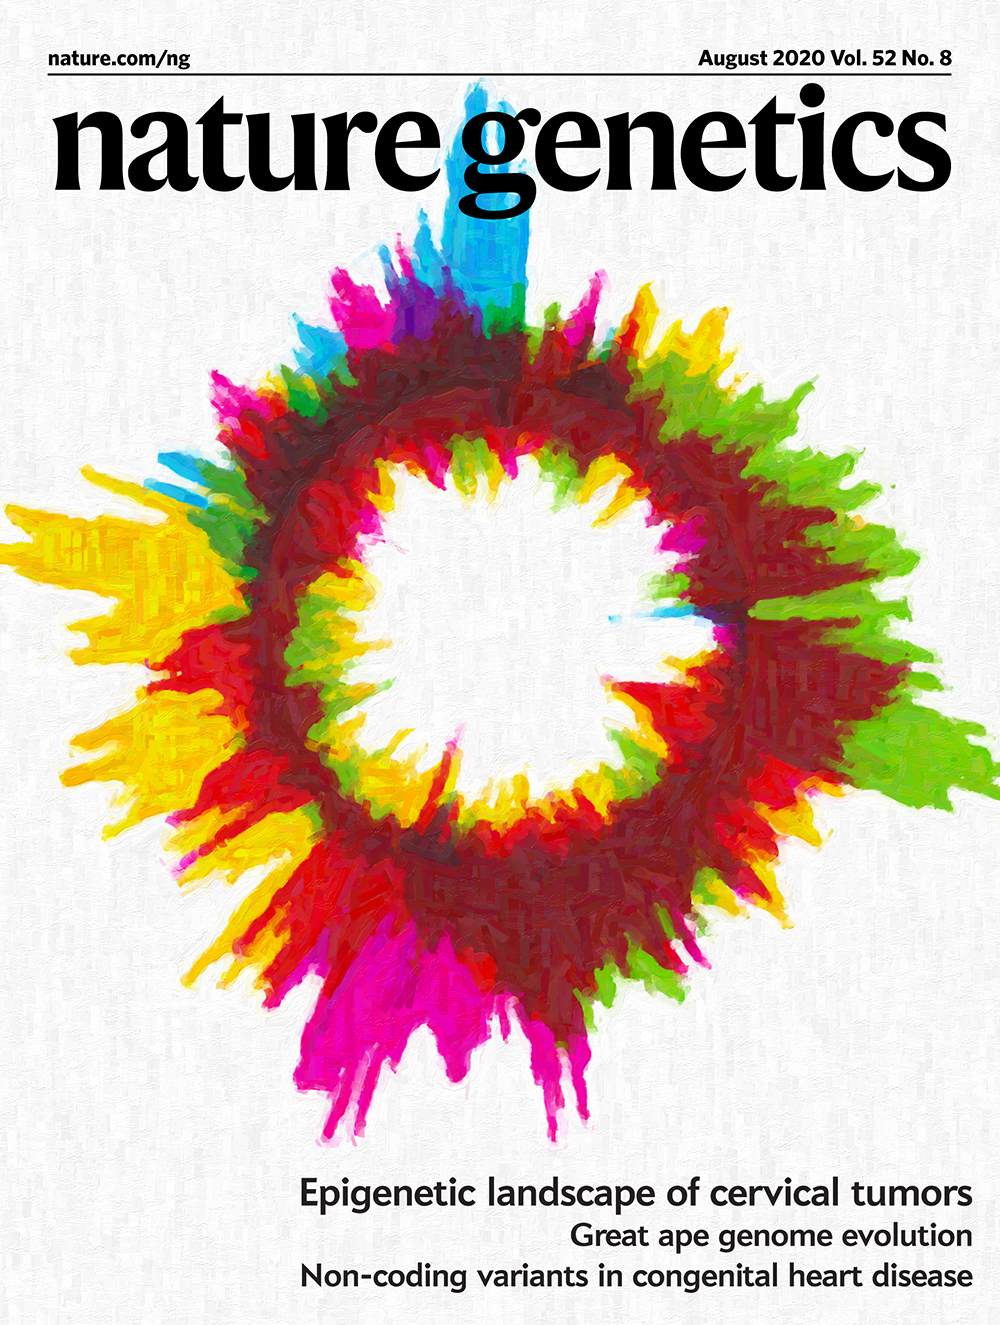
Nature Genetics
vol
52
issue
8
date
1 August 2020
citation
Gagliardi A, Porter VL, Zong Z. et al. Analysis of Ugandan cervical carcinomas identifies human papillomavirus clade–specific epigenome and transcriptome landscapes. (2020) Nature Genetics 52, 800–810 (2020).
DOI
10.1038/s41588-020-0673-7
about
Dichotomy of chromatin in color. The circular arrangement shows the profile of histone modifications observed with ChIP–seq across the HPV-integration events in the cluster with the highest increase in enrichment, as shown in Fig. 5f. It is composed of data sampled from two randomly paired individuals, with tracks facing inward and outward for each individual. Individuals are paired randomly, and track colors correspond to five histone marks with epigenetic enrichment. Designed in collaboration with Vanessa Porter.
details
publication
Nature Cancer
vol
1
issue
4
date
1 April 2020
citation
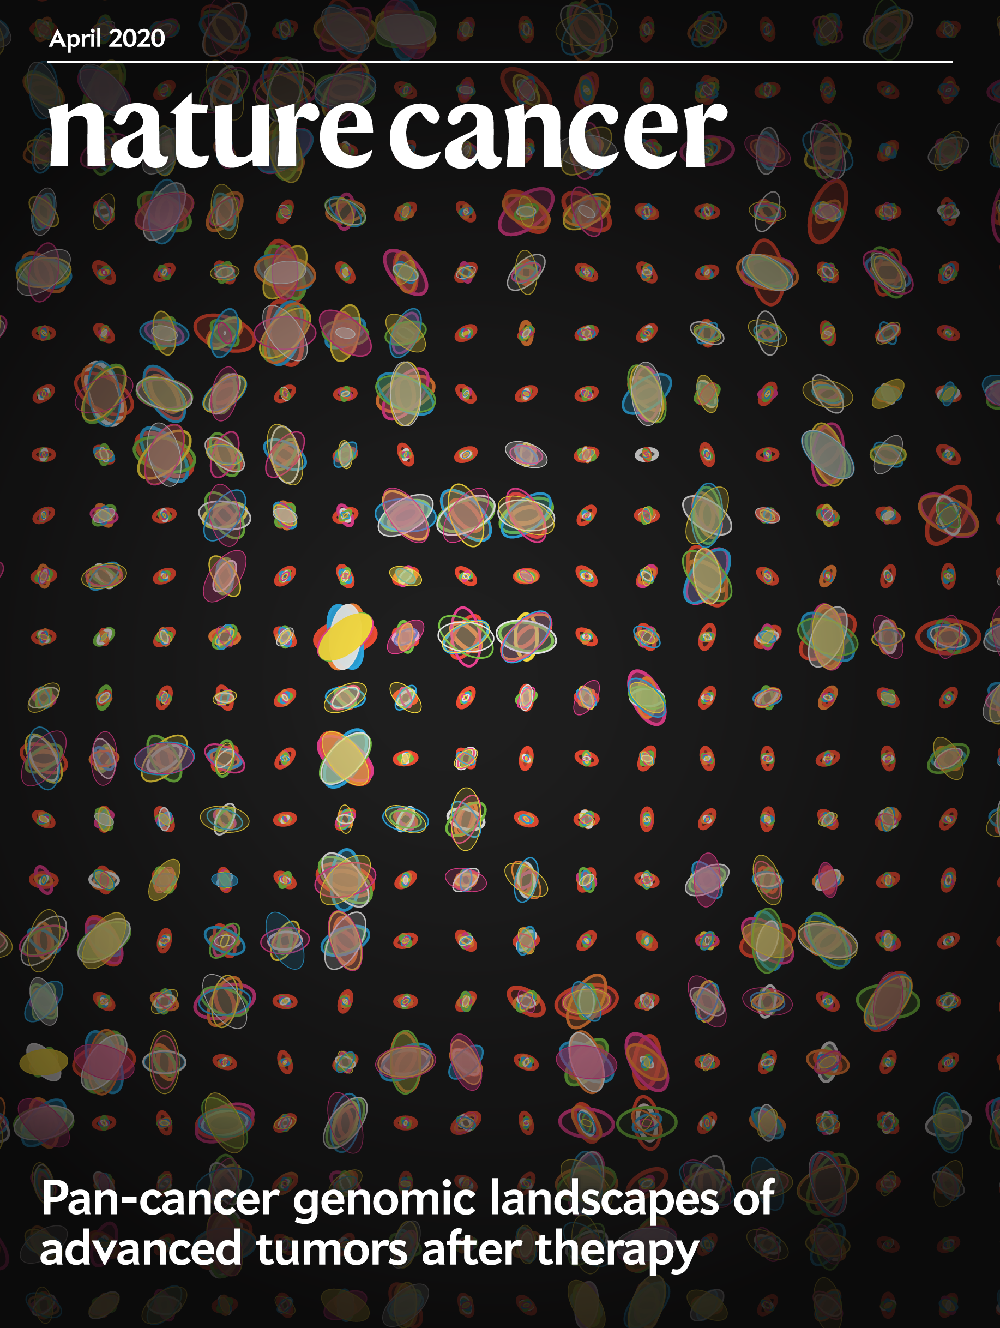
Pleasance E, Titmuss E, Williamson L et al. Pan-cancer analysis of advanced patient tumors reveals interactions between therapy and genomic landscapes. (2020) Nature Cancer 1, 452–468.
DOI
10.1038/s43018-020-0050-6
about
Each ellipse system represents the mutation spectrum of an individual patient in the POG570 cohort, with the opacity of each system representing the duration since the diagnosis of advanced disease. Each ellipse within a system depicts a specific base change, scaled by the number of mutations that exhibit that change and angled by the proportion of mutations in that sample that contribute to that change. Designed in collaboration with Emma Titmuss.
details
publication
Molecular Case Studies
vol
4
issue
2
date
1 April 2018
citation
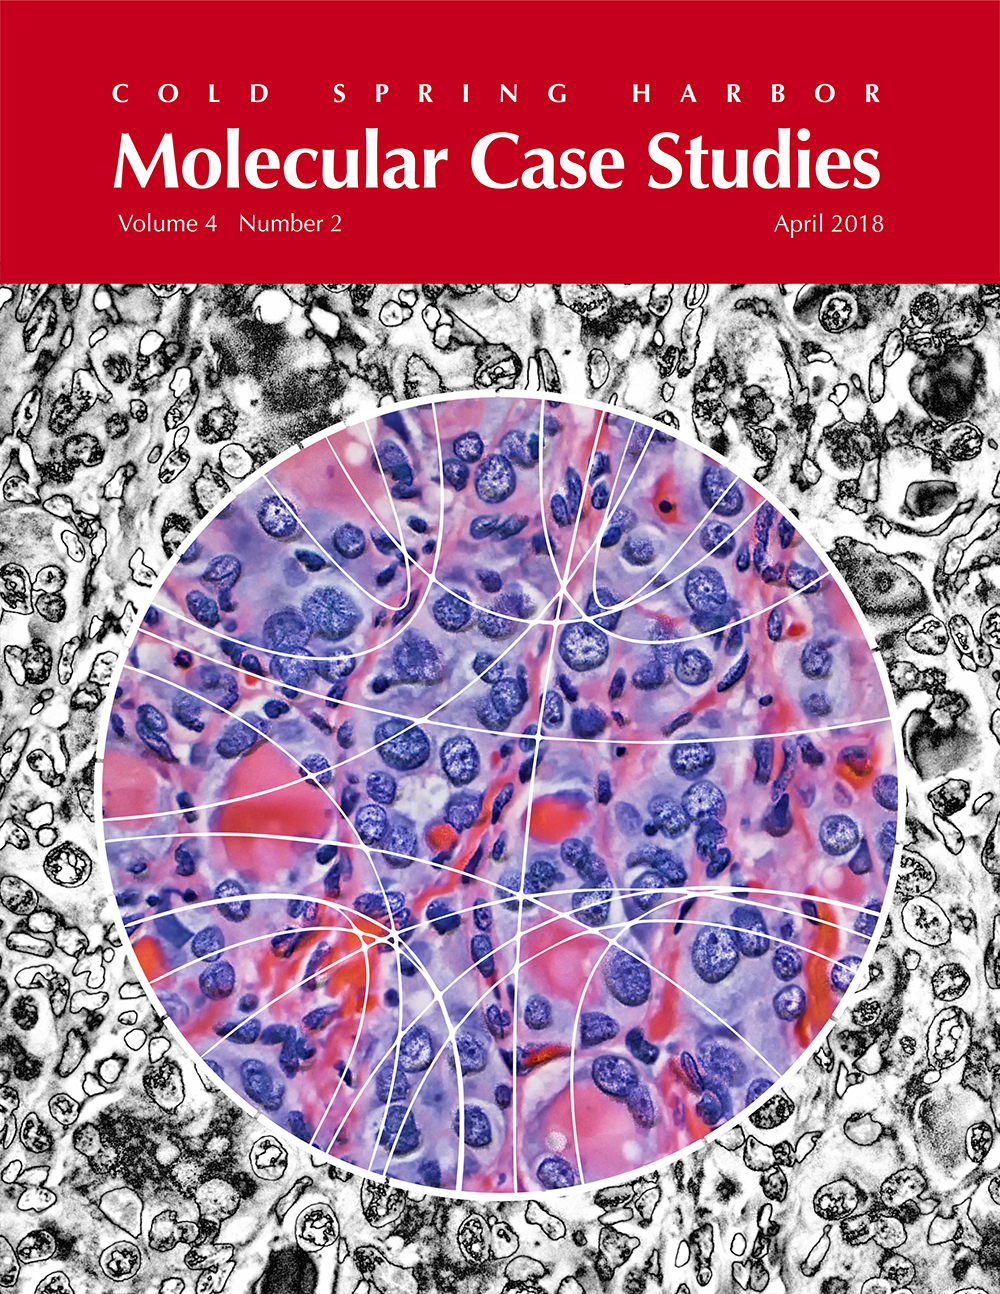
Ronsley R, Rassekh SR, Shen Y et al. Application of genomics to identify therapeutic targets in recurrent pediatric papillary thyroid carcinoma. (2018) Molecular Case Studies 4, a002568.
DOI
doi:10.1101/mcs.a002568
about
The black-and-white image is an artistic treatment of a PTC microscopy image (40×) from one of the Personalized Oncogenomics Program study participants at the BC Cancer Research Center. Superimposed is a Circos plot of 17 genomic fusions involving 17 chromosomes identified in the sample by whole-genome sequencing. Showing through the Circos plot is an enhanced color version of the microscopy image. The original image is from “Application of genomics to identify therapeutic targets in recurrent pediatric papillary thyroid carcinoma,” by Ronsley et al. in this issue (doi:10.1101/mcs.a002568).
details
publication
Nature
special issue
Nature's 10 special issue
vol
552
issue
7685
date
21 December 2017
citation
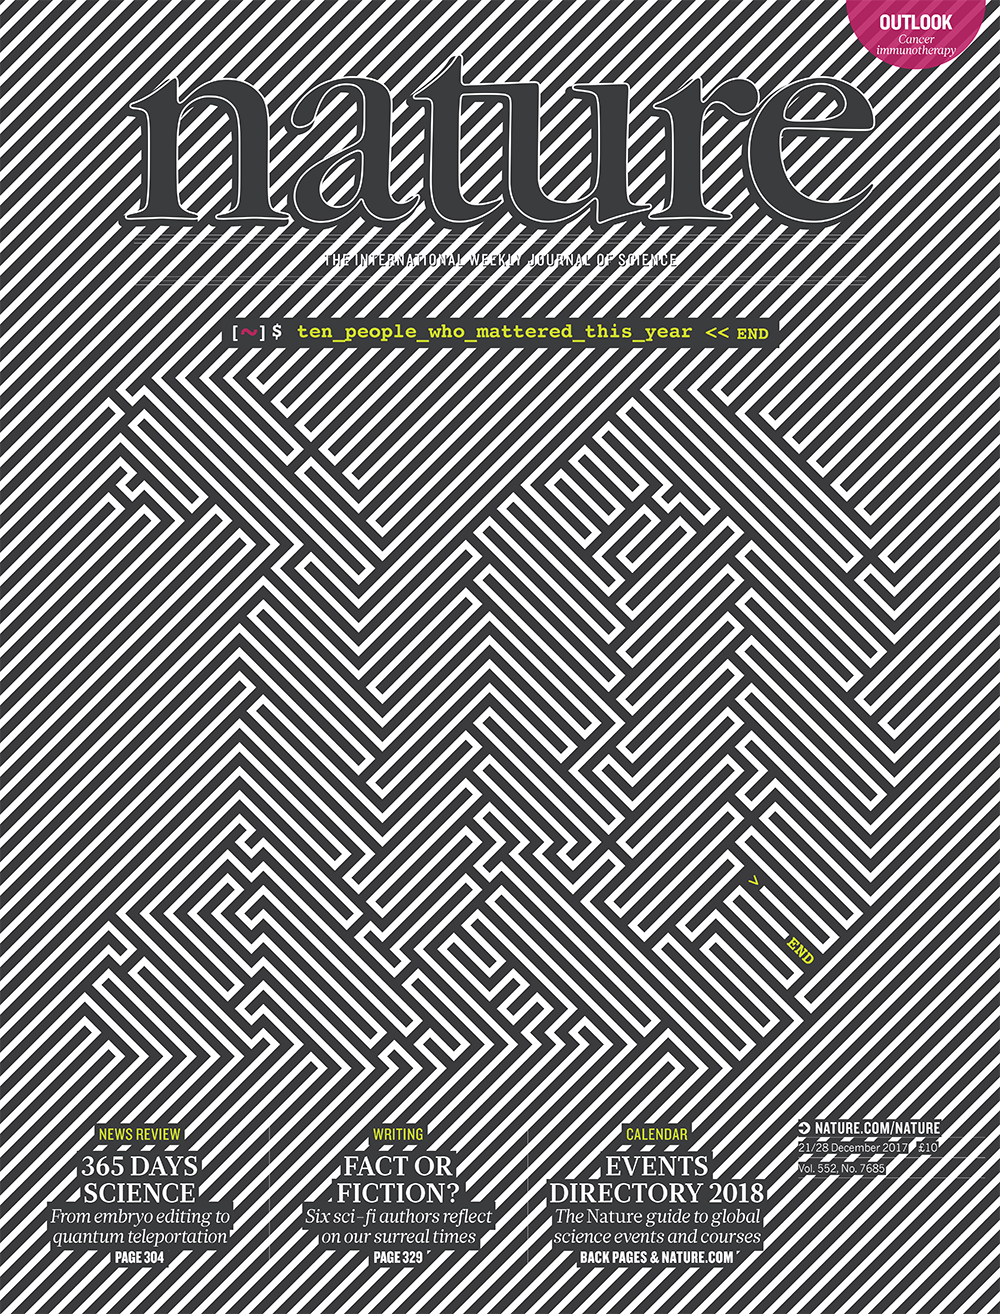
Ledford H et al (2017) Nature 552, 315–324.
DOI
10.1038/d41586-017-07763-y
about
This design speaks to the increasingly important role of artificial intelligence in science and technology. The image was created using a machine-learning algorithm designed to solve the travelling salesman problem, which asks for the optimum path between a given set of points. Thus, the ‘10’ is drawn as a single line. Image by Martin Krzywinski. More information on how it was created can be found in the Nature graphics blog.
details
publication
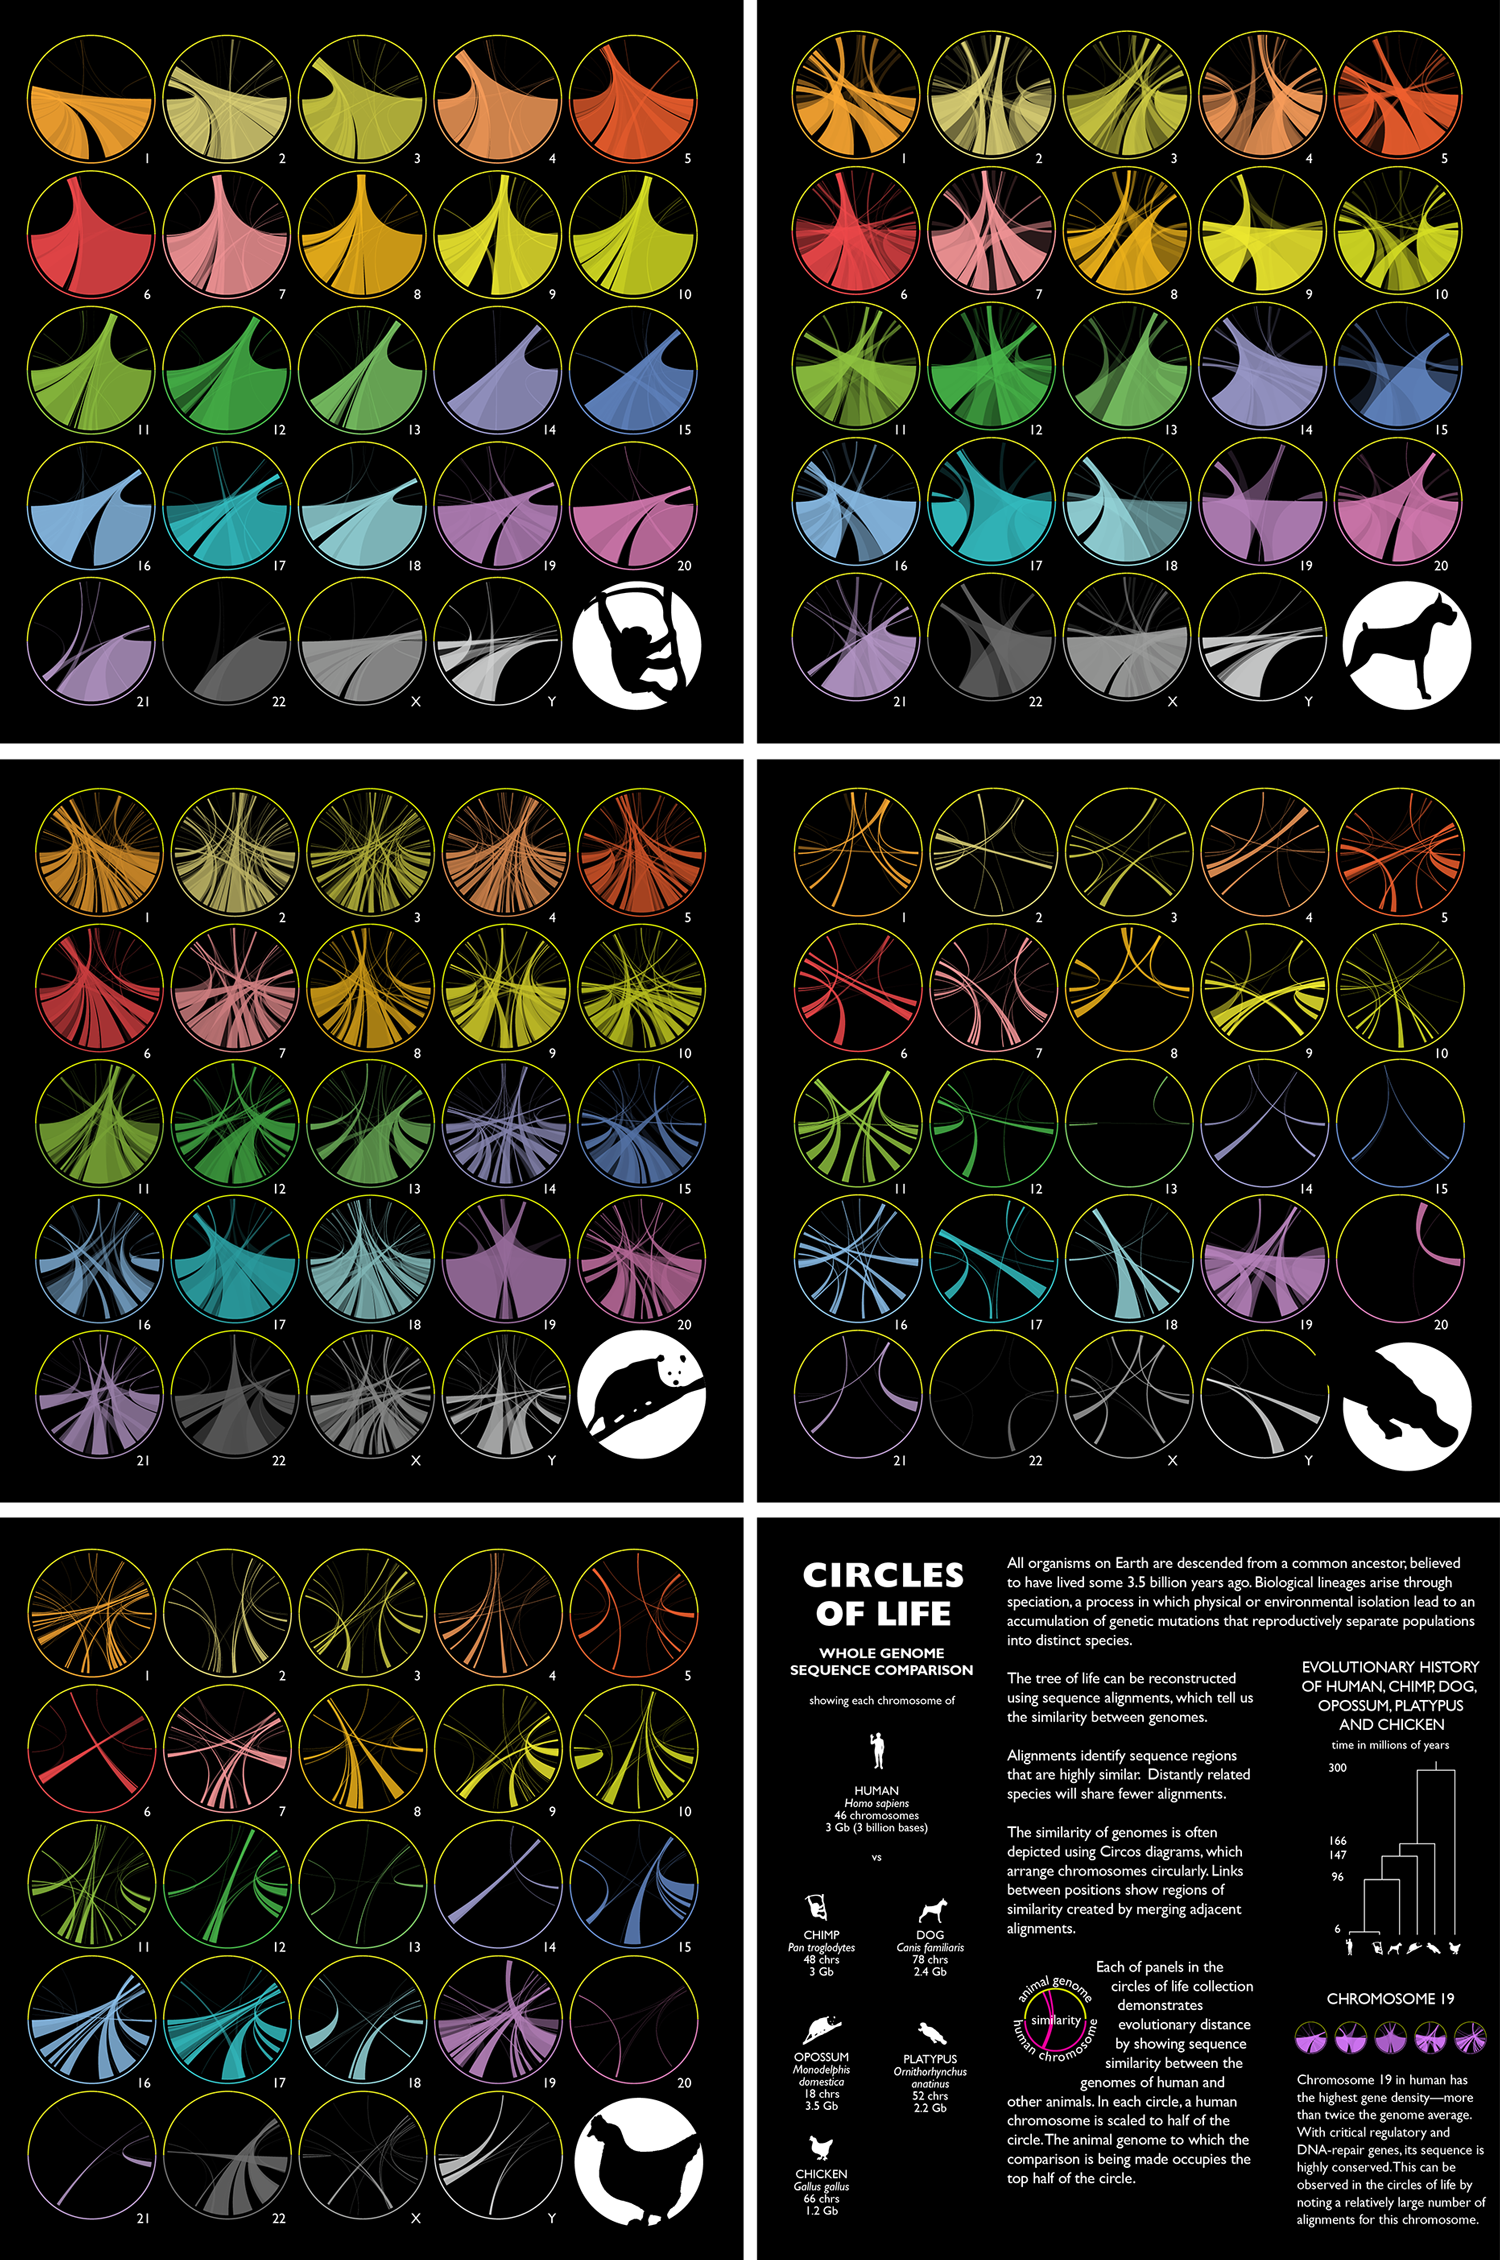
British Library
special issue
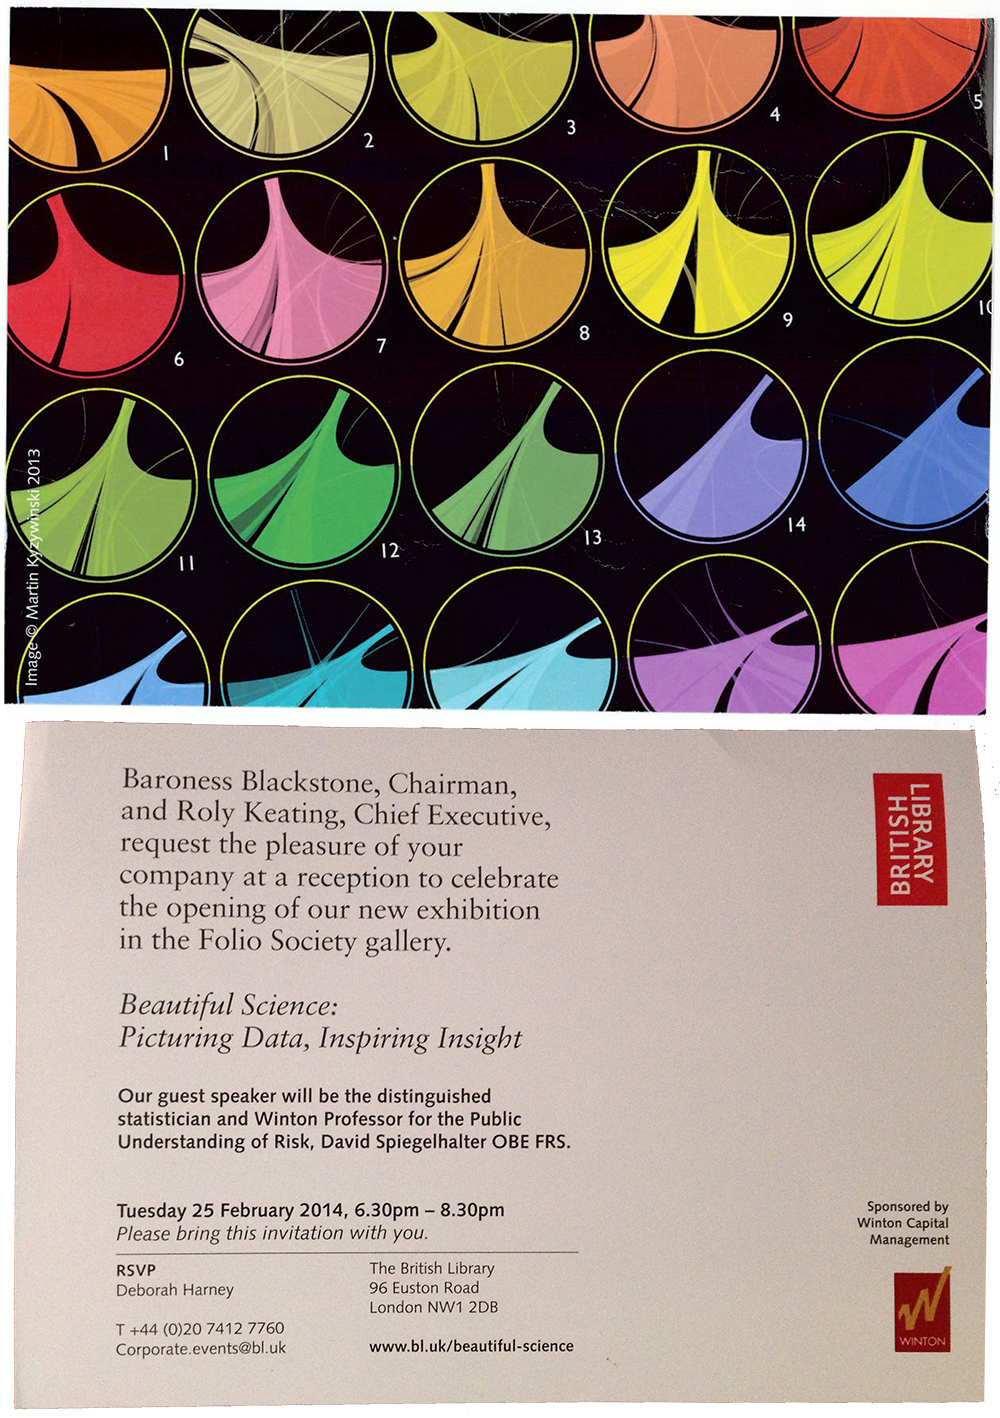
Beautiful Science
date
25 February 2014
about
Circles of Life — a visual comparison of differences between the human, chimp, dog, opossum, platypus and chicken genomes.
publication
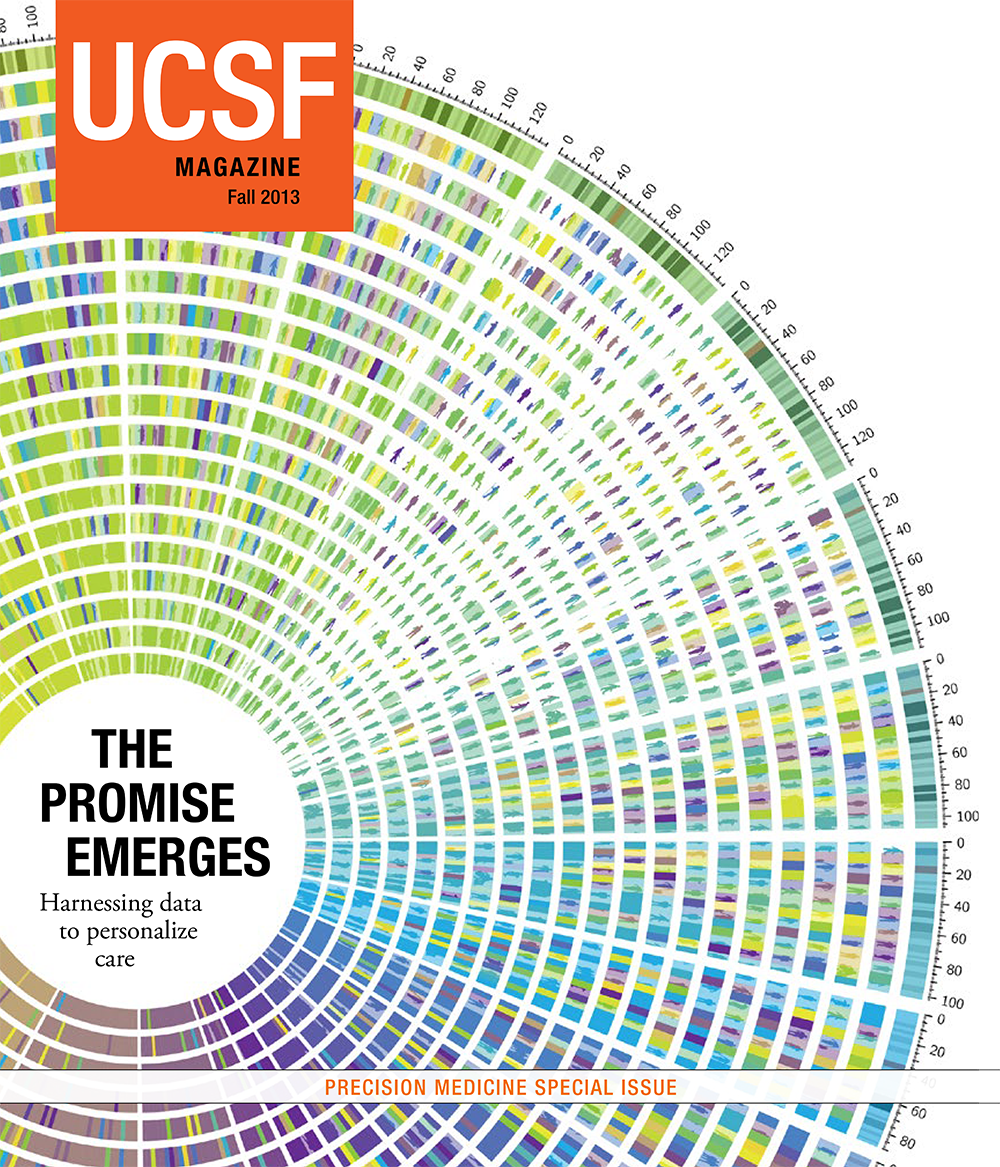
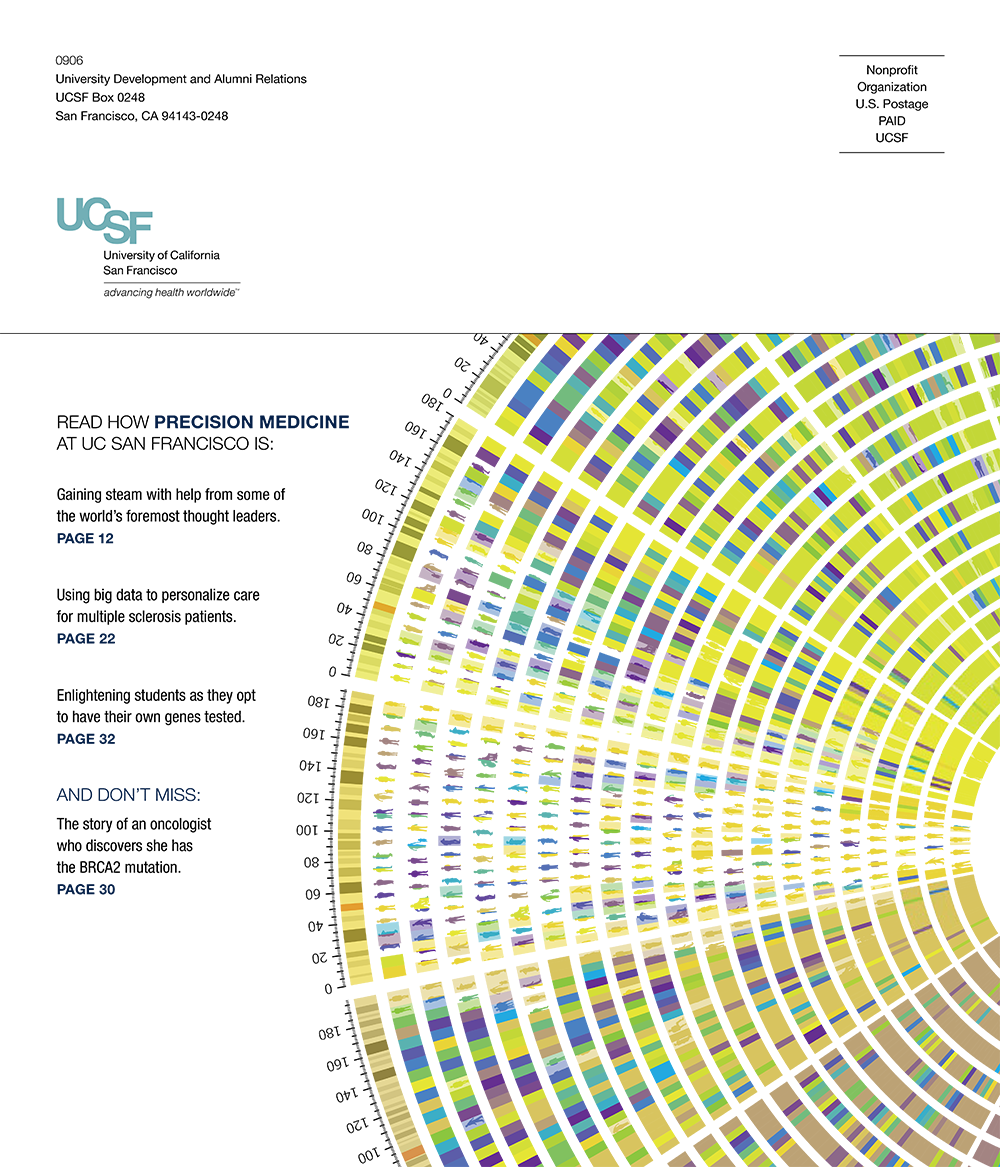
UCSF Magazine
special issue
Precision Medicine special issue
vol
2
issue
2
date
1 September 2013
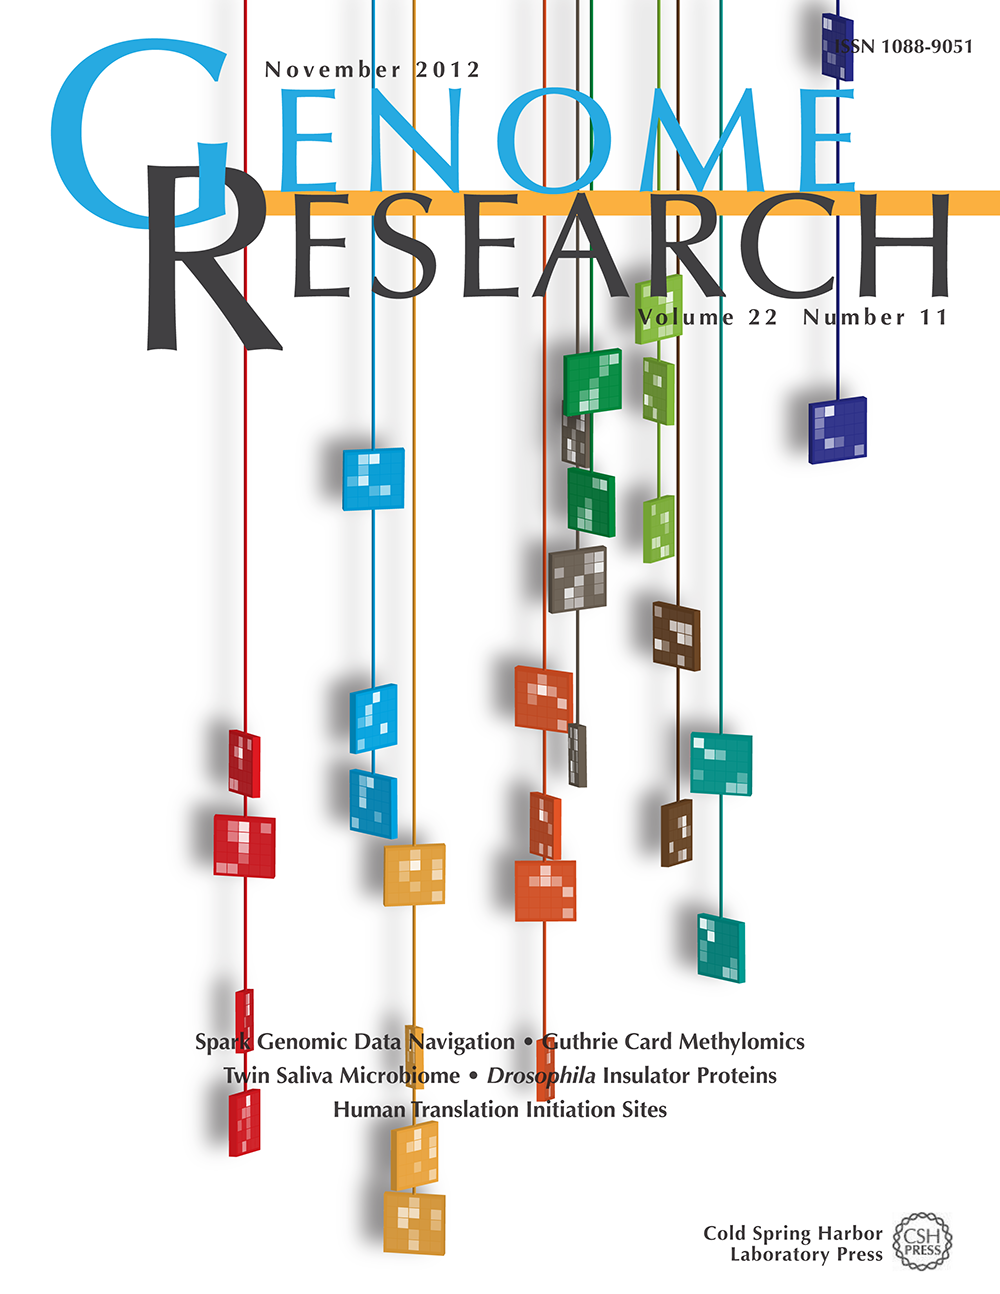
publication
Genome Research
vol
22
issue
11
date
1 November 2012
citation
Nielsen CB, Younesy H, O'Geen H, Xu X et al. Spark: A navigational paradigm for genomic data exploration. (2012) Genome Research 22, 2262–2269.
DOI
10.1101/gr.140665.112
about
Colored tiles are playfully suspended on vertical strings to illustrate how Spark, presented in this issue, uses clustering to group genomic regions (tiles) with similar data patterns (colored heatmaps) and facilitates genome-wide data exploration.
details
publication
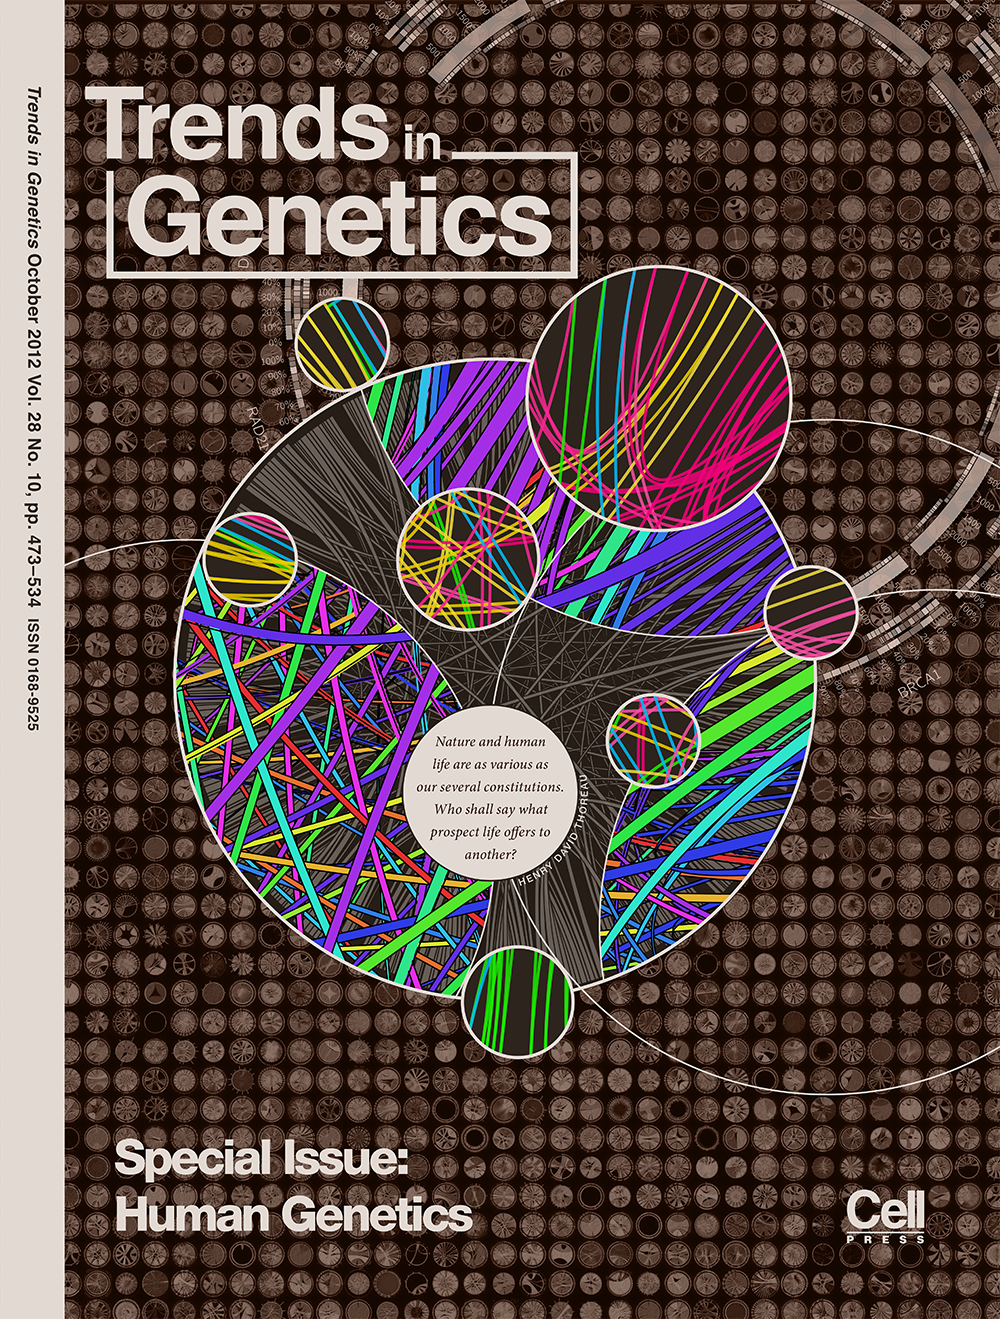
Trends in Genetics
special issue
Human Genetics special issue
vol
28
issue
10
date
1 October 2012
about
A collection of visualization of tabular data generated with the Circos table viewer.
details
publication
PNAS
vol
109
issue
18
date
1 May 2012
citation
Chang L, Noseda M, Higginson M, Ly M et al. Differentiation of vascular smooth muscle cells from local precursors during embryonic and adult arteriogenesis requires Notch signaling. (2012) Proceedings of the National Academy of Sciences 109, 6993–6998.
DOI
10.1073/pnas.1118512109
about
Pictured are mouse embryonic blood vessels. A carotid artery is shown in the foreground with endothelial cells in green, vascular smooth muscle cells in red, and the nuclei in blue. Linda Chang et al. found that the Notch signaling system is essential for the differentiation of mature vascular smooth muscle cells from local precursor cells; without this differentiation, mouse embryos experience localized hemorrhaging. The study’s experimental system could be used to follow embryonic arteriogenesis through development.
details
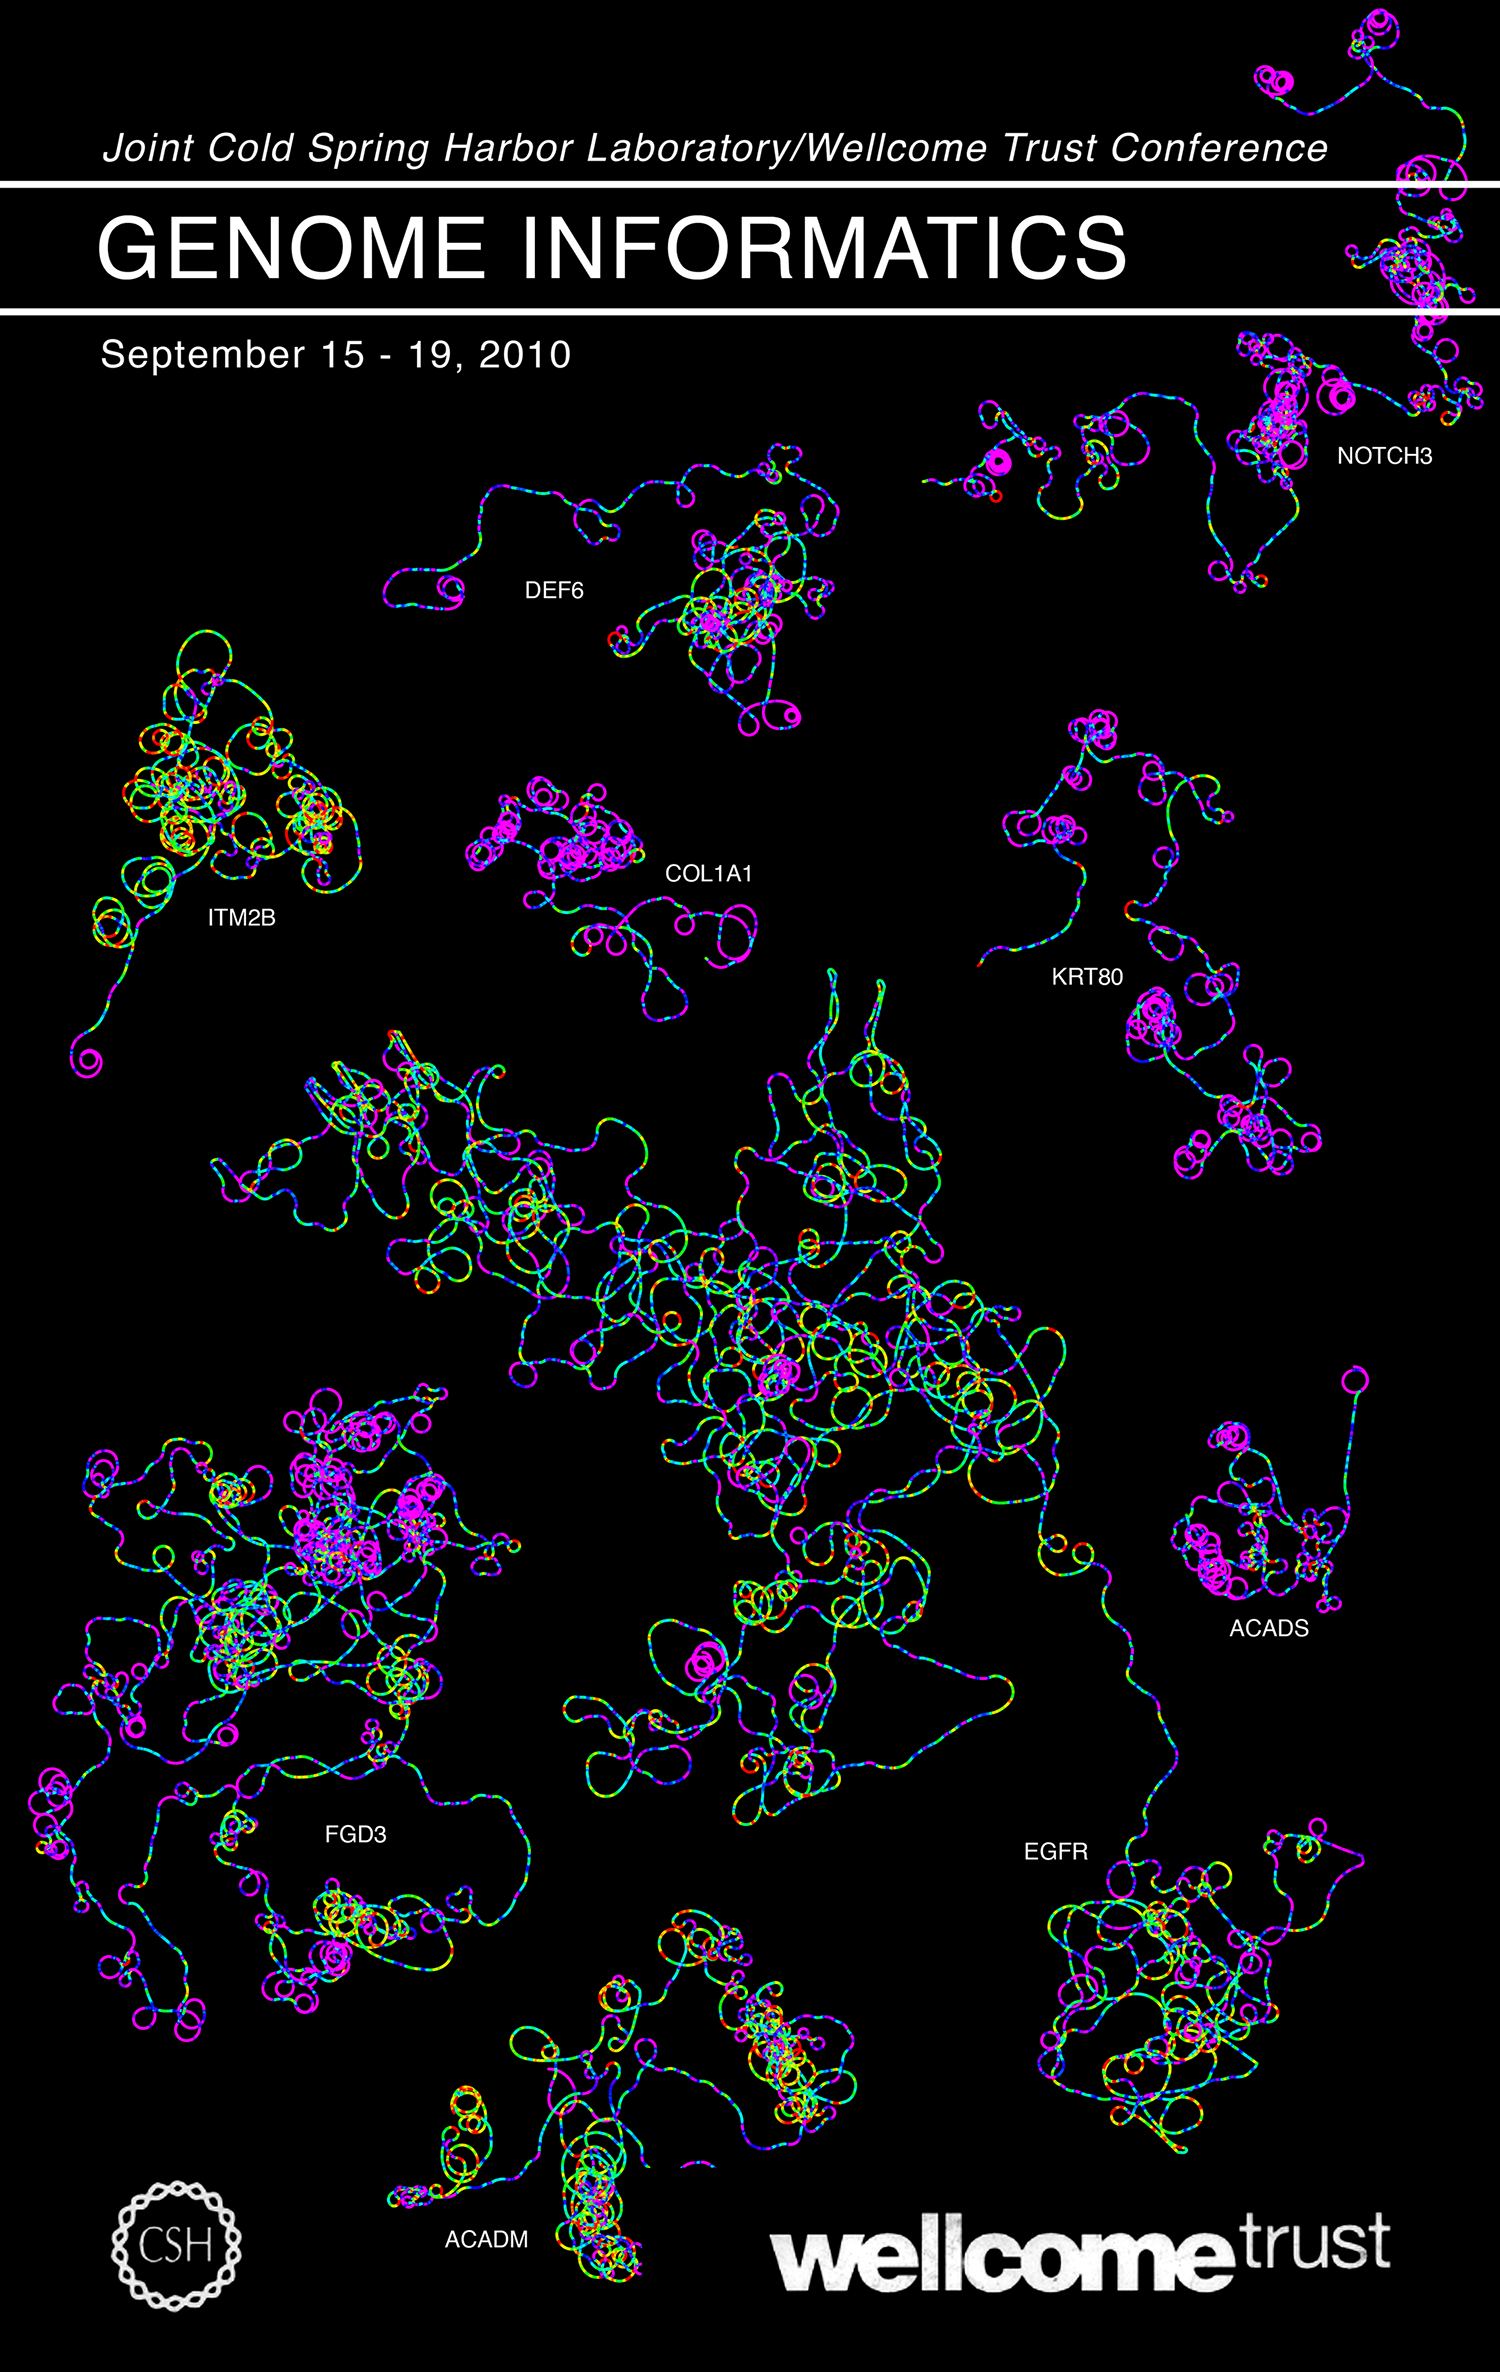
publication
Genome Informatics
special issue
Joint Cold Spring Harbor Laboratory/Wellcome Trust Conference
date
15 September 2010
about
The program cover shows sequences of some of the genes and viruses that appear in this conference's abstracts.
details
publication
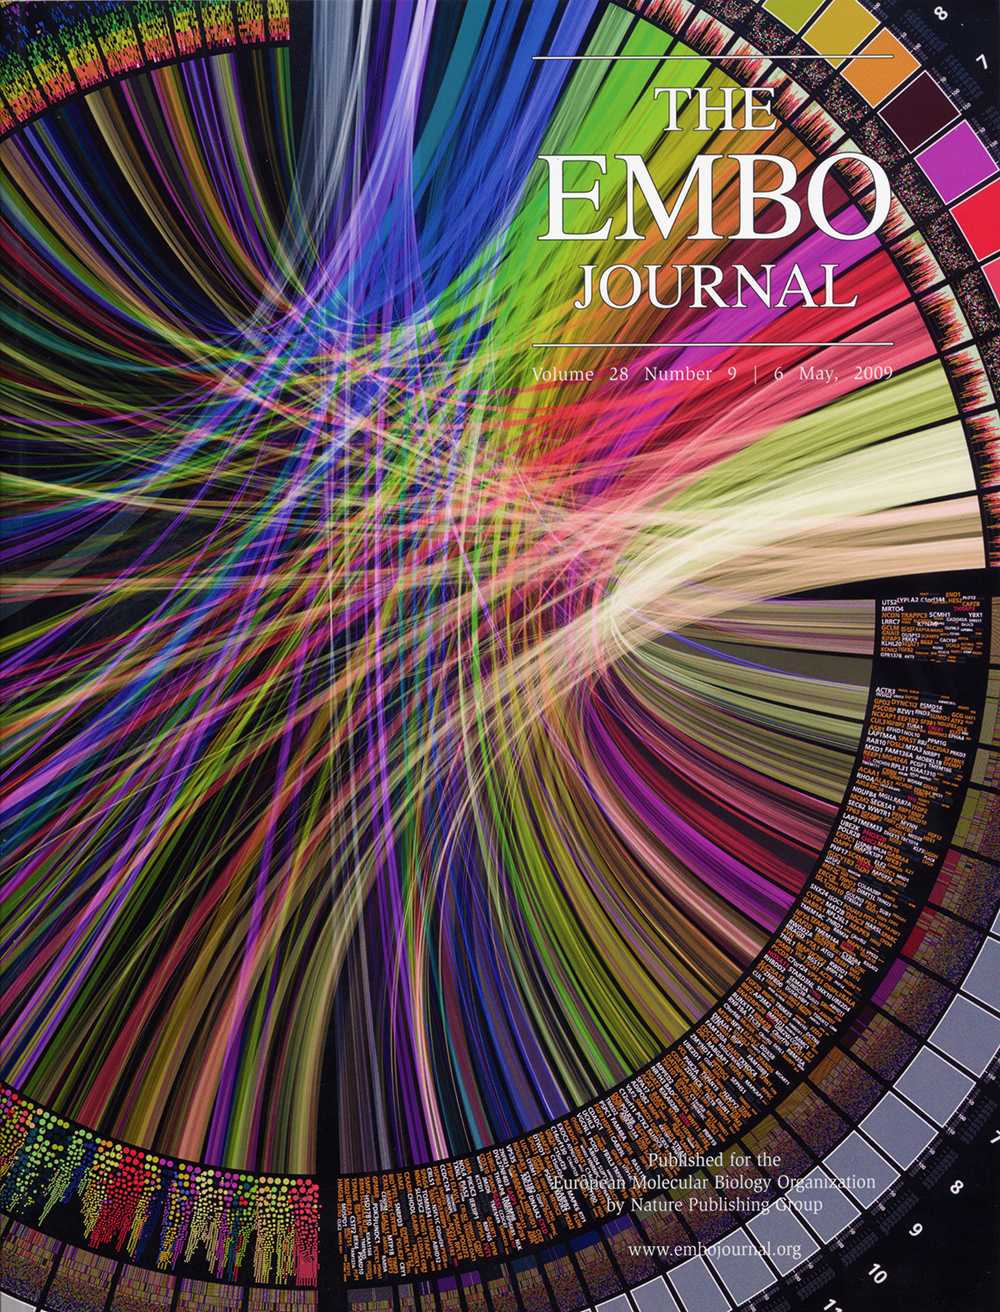
EMBO journal
vol
28
issue
9
date
6 May 2009
about
Four genomes. The illustration shows syntenic relationships between human, chimpanzee, mouse and zebrafish genomes. Curved links encode sequence similarity and outer data tracks represent consensus similarity statistics and orthologous genes. The cover image shows a detail of a visualization prepared with the free genome comparison tool, Circos.
details
publication
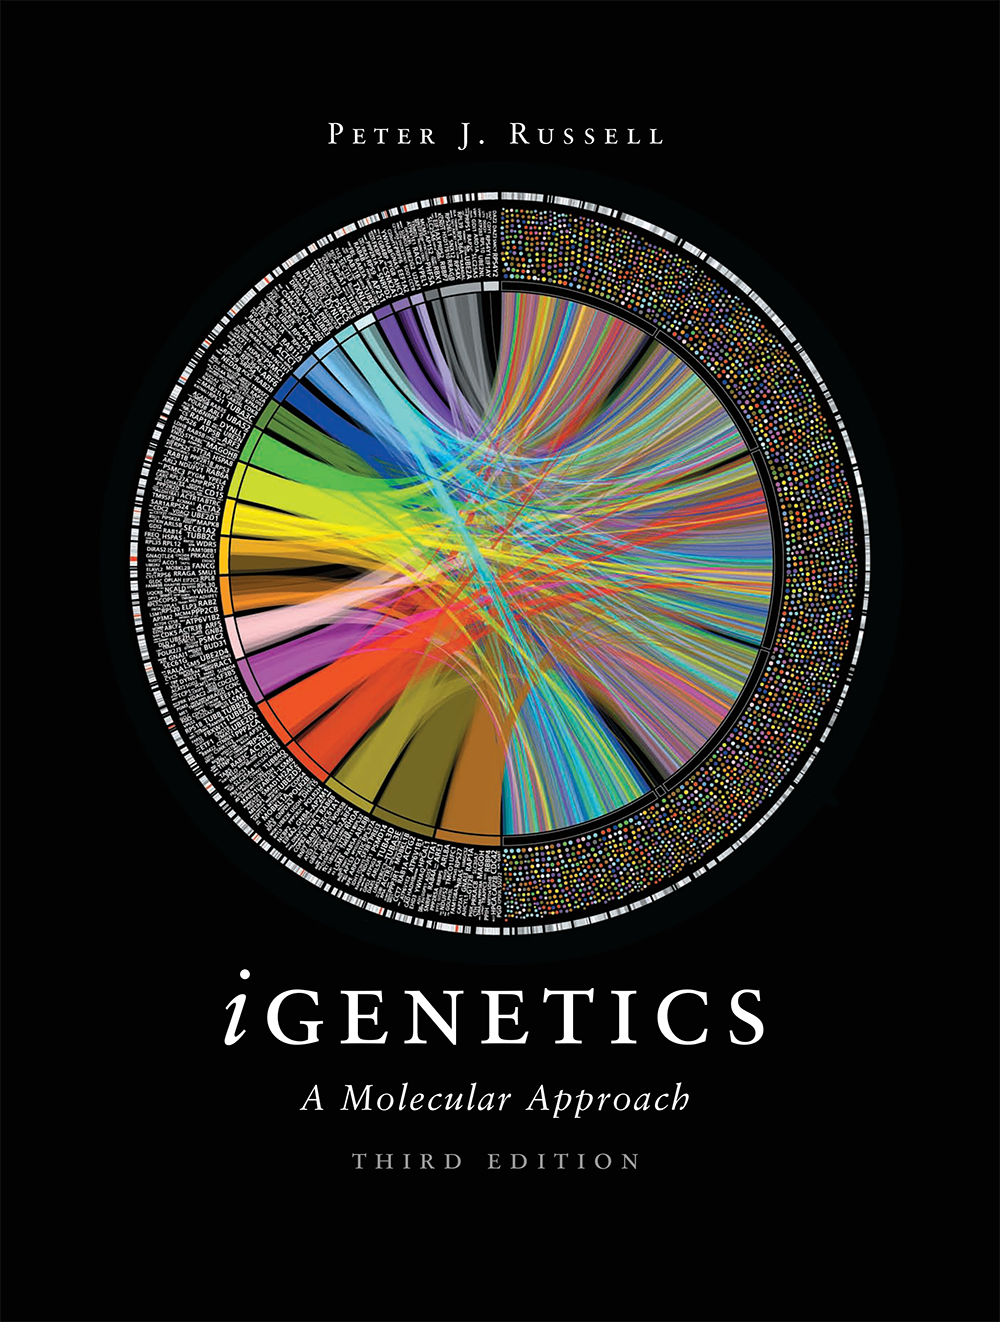
iGenetics
date
2 February 2009
article
citation
Russel PJ. iGenetics: A Molecular Approach, 3rd ed. (2009) Pearson. ISBN-13: 9780137553389
about
A visual comparison of differences between the human and Drosophila melanogaster (fruit fly) genomes.
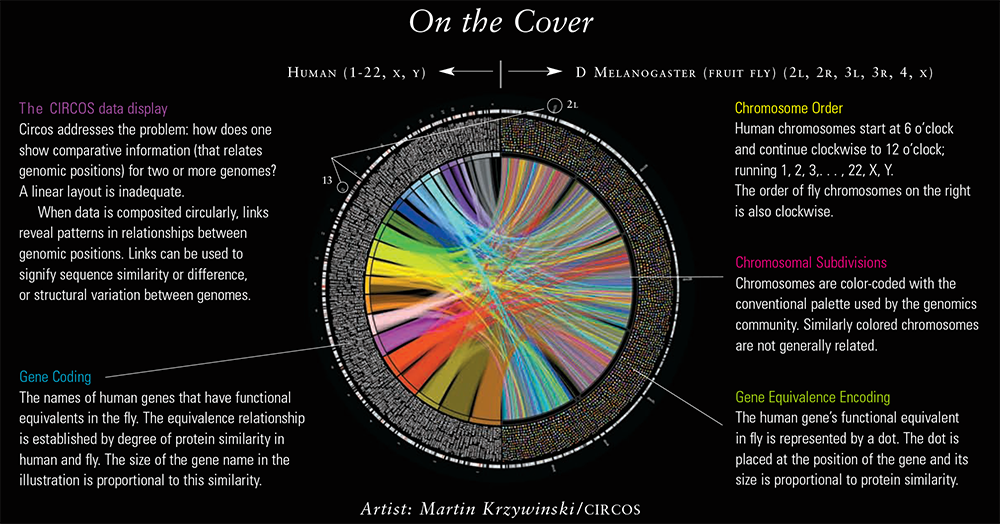
publication
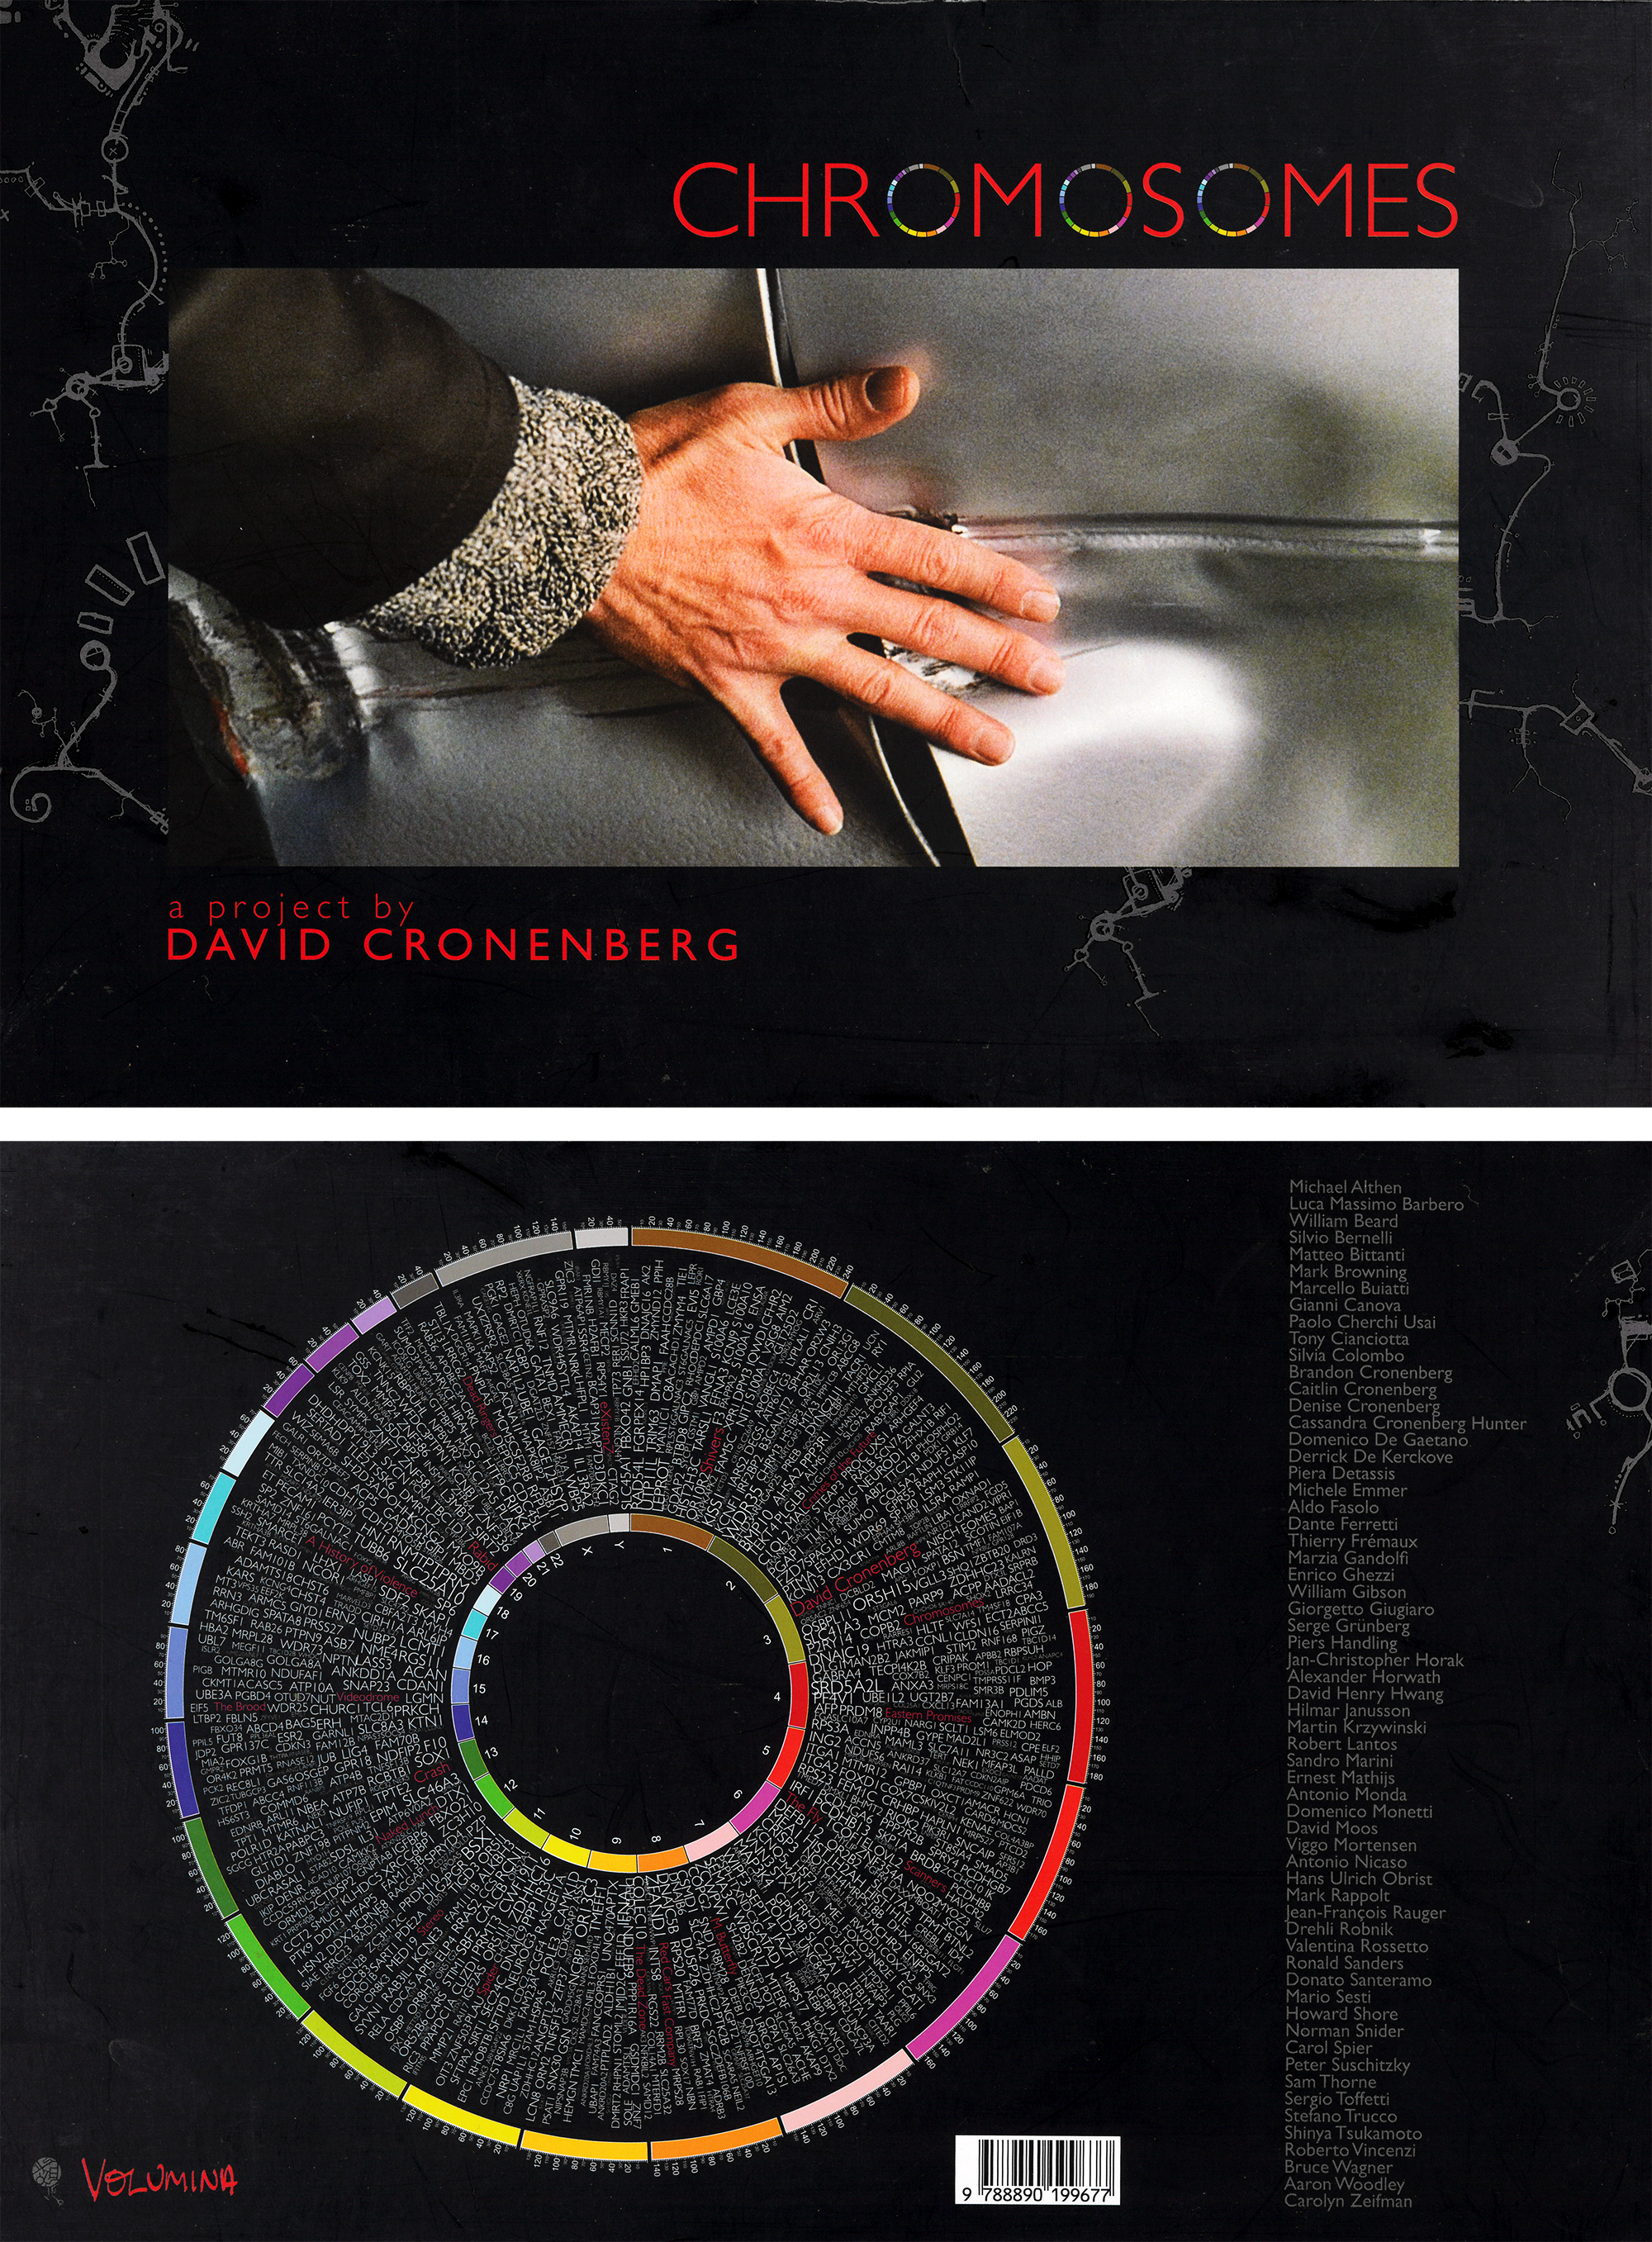
Chromosomes
special issue
A project by David Cronenberg
date
1 January 2009
article
citation
Cronenberg D, Chromosomes (2009) Volumina.
about
A visual comparison of differences between the human and Drosophila melanogaster (fruit fly) genomes.
publication
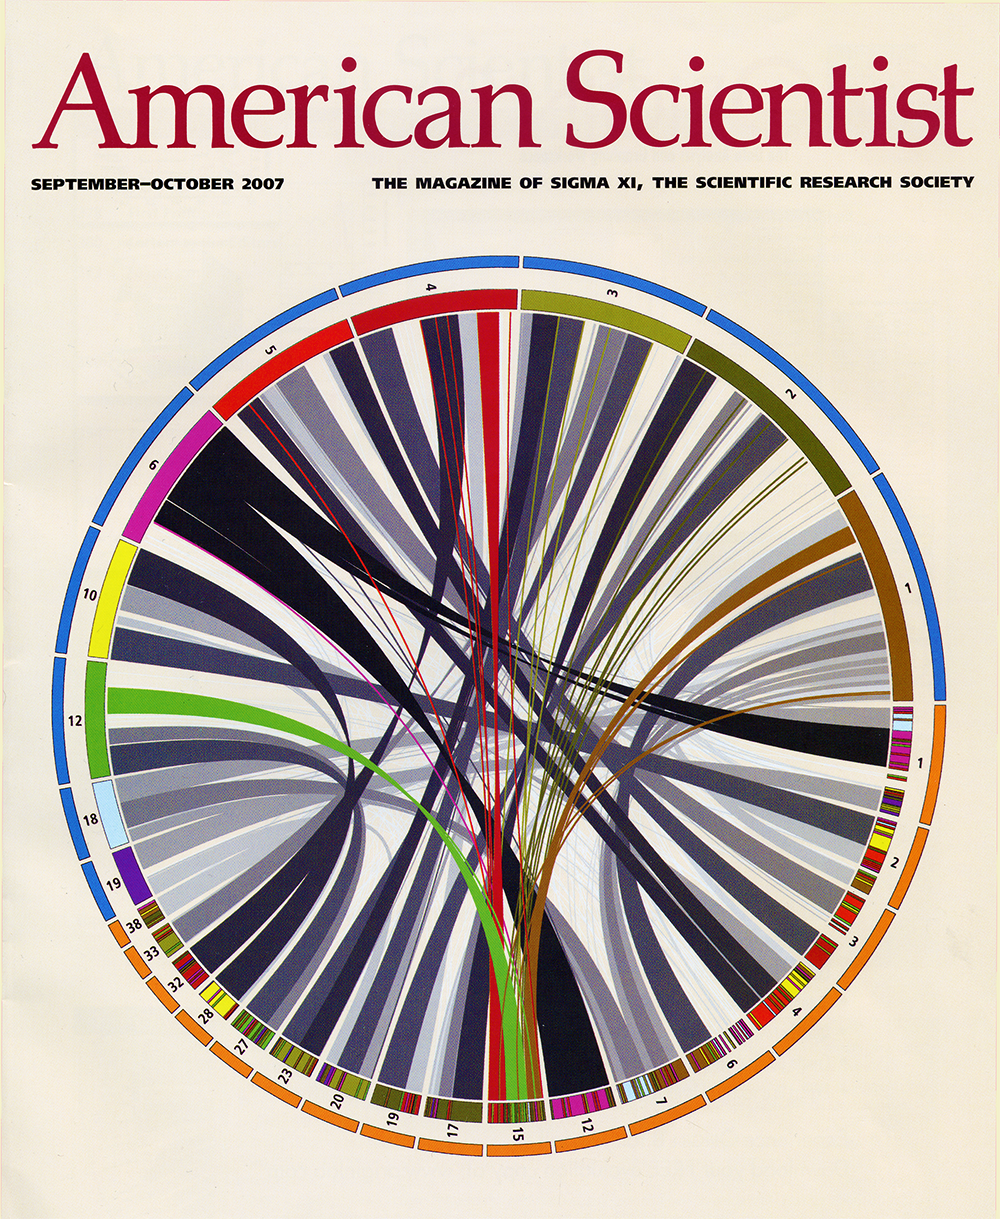
American Scientist
vol
95
issue
5
date
1 September 2007
citation
Ostrander E. Genetics and the Shape of Dogs: Studying the new sequence of the canine genome shows how tiny genetic changes can create enormous variation within a single species. (2007) American Scientist 95, 406–413.
DOI
10.1511/2007.67.406
about
The sequencing of the dog genome, completed in 2005, revealed large overlaps between the dog and human genomes. Some of the patterns in dog-human homology—similarity arising from shared ancestry—are depicted here in a Circos diagram. Selected human (top, blue outer band) and dog (bottom, orange outer band) chromosomes are arranged around the circle, with bands connecting regions of homology between the two species. Where DNA on a dog chromosome matches human DNA, color-coded stripes indicate the relevant human chromosome. In "Genetics and the Shape of Dogs," Elaine A. Ostrander describes some results from the dog genome project, including detailed work on chromosome 15. The spray of colored ribbons on the cover illustration shows the pattern of connections between this chromosome and seven human chromosomes.
details
publication
Linux Journal
issue
115
date
1 November 2003
article
citation
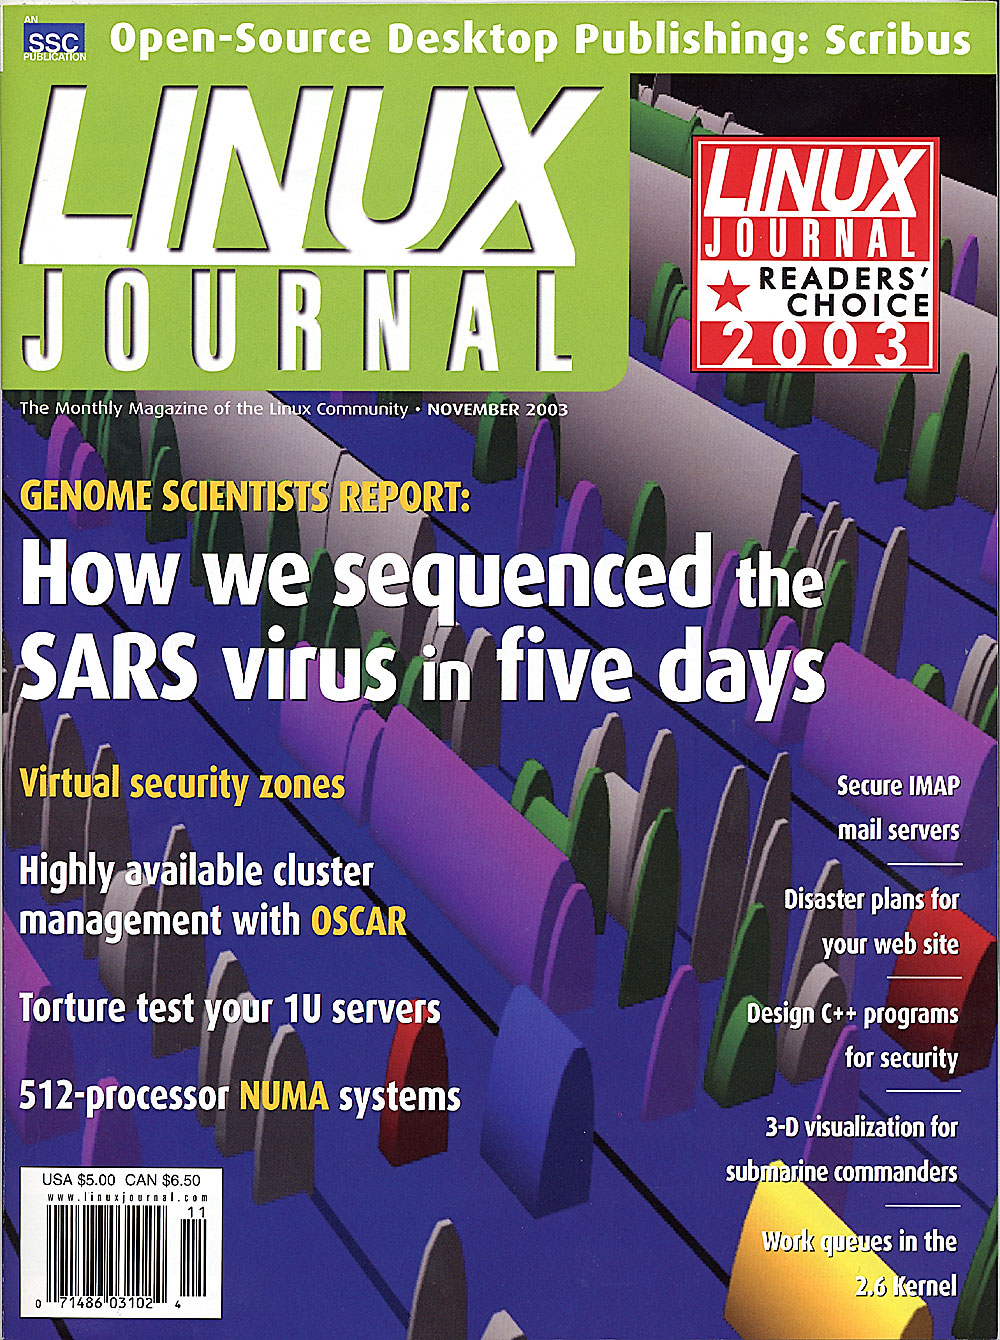
Krzywinski, M & Butterfield, Y. Sequencing the SARS Virus. (2003) Linux Journal 115, 44–52.
about
The 3D image on the cover shows a BLASTX comparison of the genome of the SARS Tor2 coronavirus against the known proteins of other similar viruses. The image was generated using the Linux version of the Sockeye 3D genome viewer, developed at Canada's Michael Smith Genome Sciences Center.
publication
PLOS Computational Biology
vol
17
issue
7
date
17 July 2021
citation
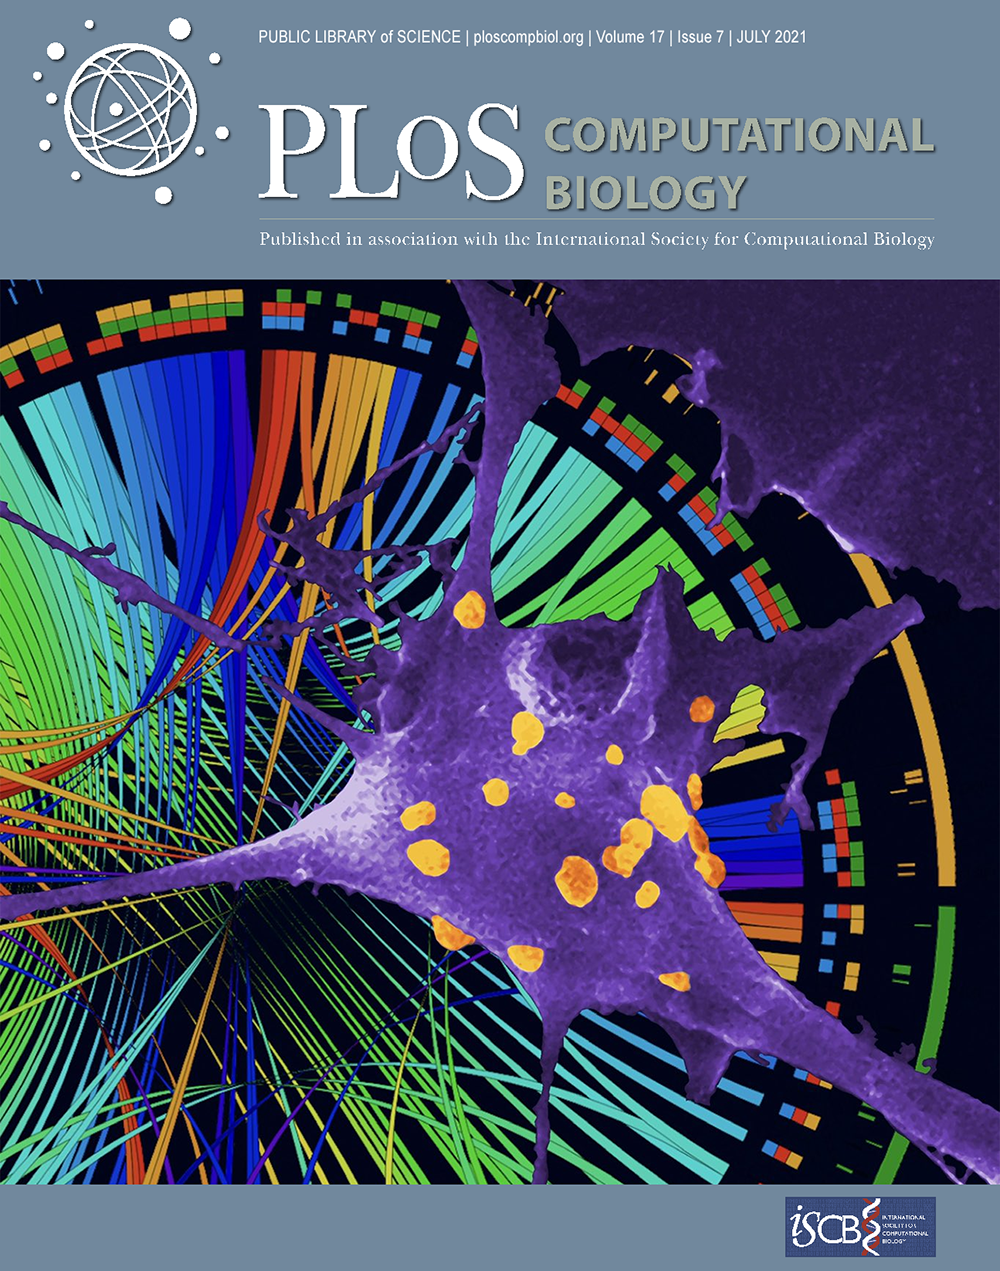
Noroy C. & Meyer D.F. The super repertoire of type IV effectors in the pangenome of Ehrlichia spp. provides insights into host-specificity and pathogenesis. (2021) PLoS Comput Biol 17(7): e1008788.
DOI
10.1371/journal.pcbi.1008788
about
Artistic representation of how pathogenomics can outline virulence factors and their contribution to overall bacterial pathogenesis. The illustration shows the comparison of repertoires of Ehrlichia spp. candidate type IV effectors, prepared using Circos software (Krzywinski et al., Genome Res 2009), and superimposed on a scanning electron microscopy picture (40 000x magnification) of Ehrlichia ruminantium (yellow) adhering to host endothelial cell (purple).
publication
PLOS Computational Biology
vol
15
issue
7
date
5 June 2019
citation
Cai C, Cooper GF, Lu KN, Ma X, Xu S, Zhao Z, et al. Systematic discovery of the functional impact of somatic genome alterations in individual tumors through tumor-specific causal inference. (2019) PLoS Comput Biol 15(7): e1007088.
DOI
10.1371/journal.pcbi.1007088
about
Cai et al present genes that are aligned according to their chromosome locations in the most inner track, with chromosome number indicated. Different types of SGA events are shown in tracks: copy number deletion (blue), copy number amplification (orange), mutation (green). The outmost track (red) shows the number of tumors in which an SGA is deemed as a candidate driver.
publication
PLOS Computational Biology
vol
15
issue
1
date
17 January 2019
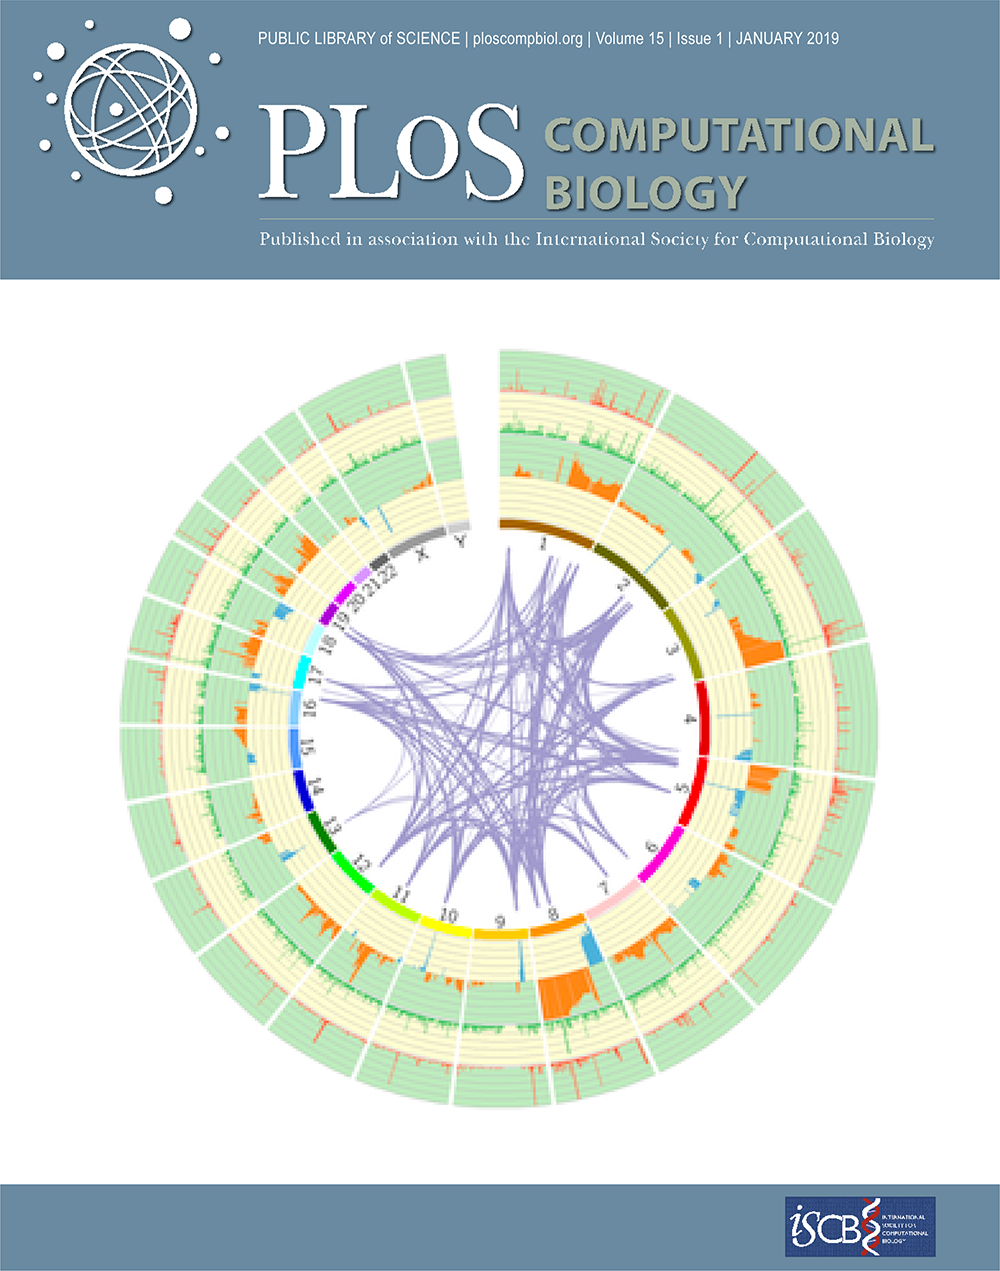
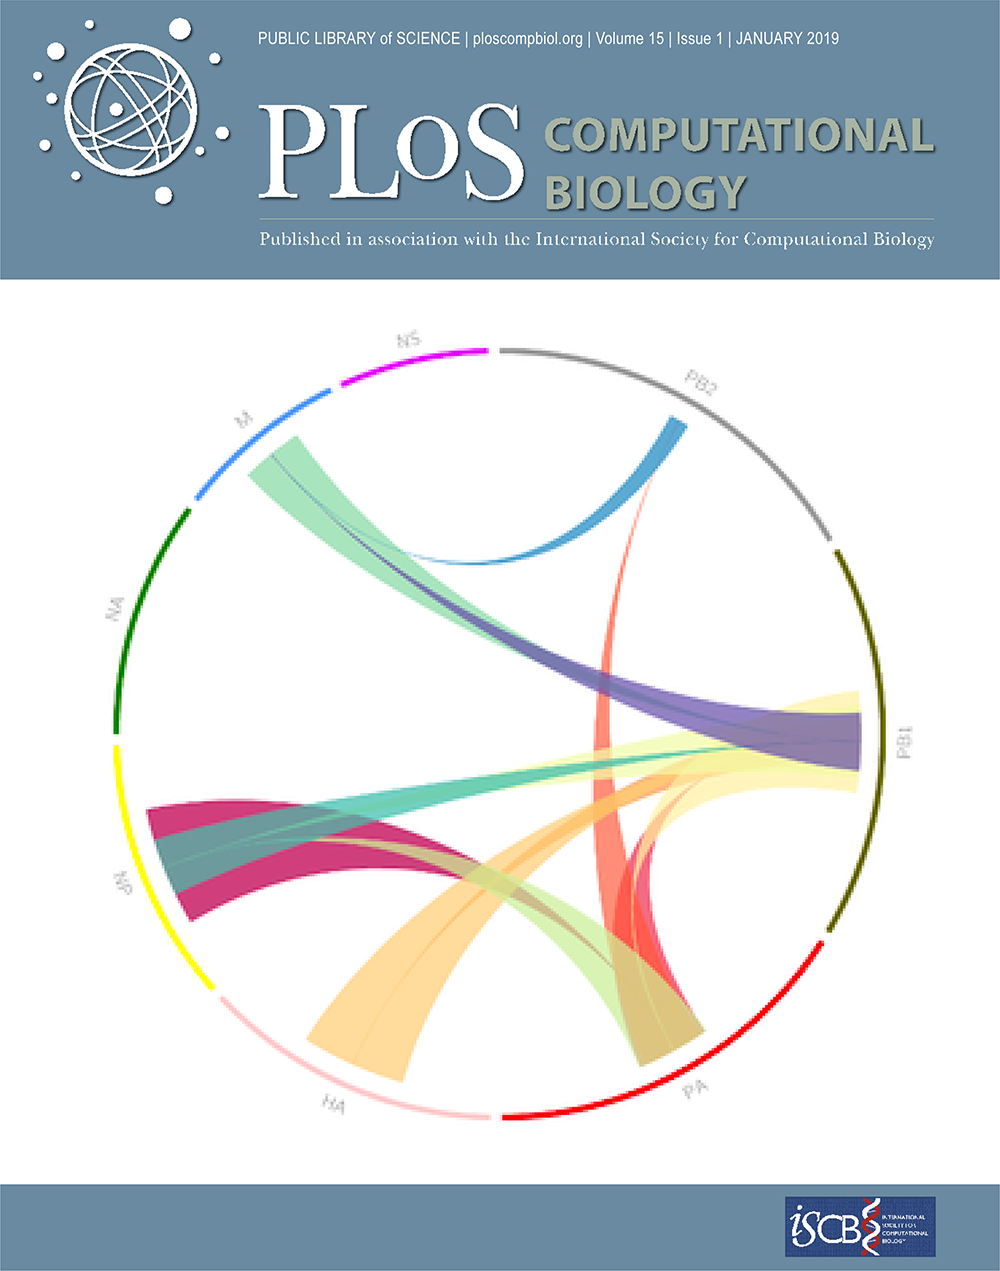
citation
Majarian T.D., Murphy R.F. & Lakdawala S.S. Learning the sequence of influenza A genome assembly during viral replication using point process models and fluorescence in situ hybridization. (2019) PLoS Comput Biol 15(1): e1006199.
DOI
10.1371/journal.pcbi.1006199
about
In influenza virus infected cells, eight viral genomic RNPs are assembled into progeny virions, which predominantly contain one copy of each. Using sets of fluorescence microscope images of four vRNPs, the likelihood that the subcellular distribution of one vRNP can be predicted from the distribution of another was estimated for all pairs of vRNPs with significant relationships. The thick base of the bands indicates the vRNP whose location can be used to predict the location of the vRNP indicated by the thin base. These pairwise and higher order relationships were used to infer the assembly network for all eight vRNPs.
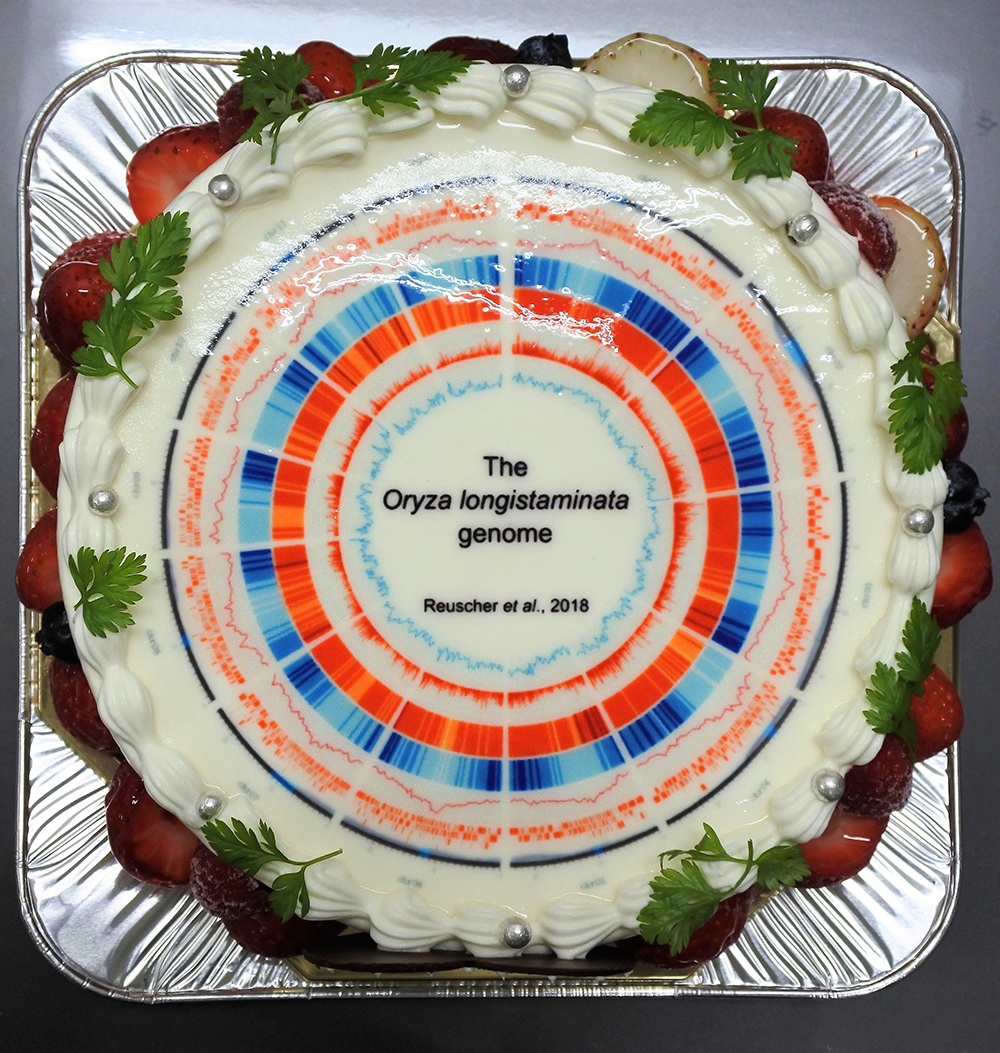
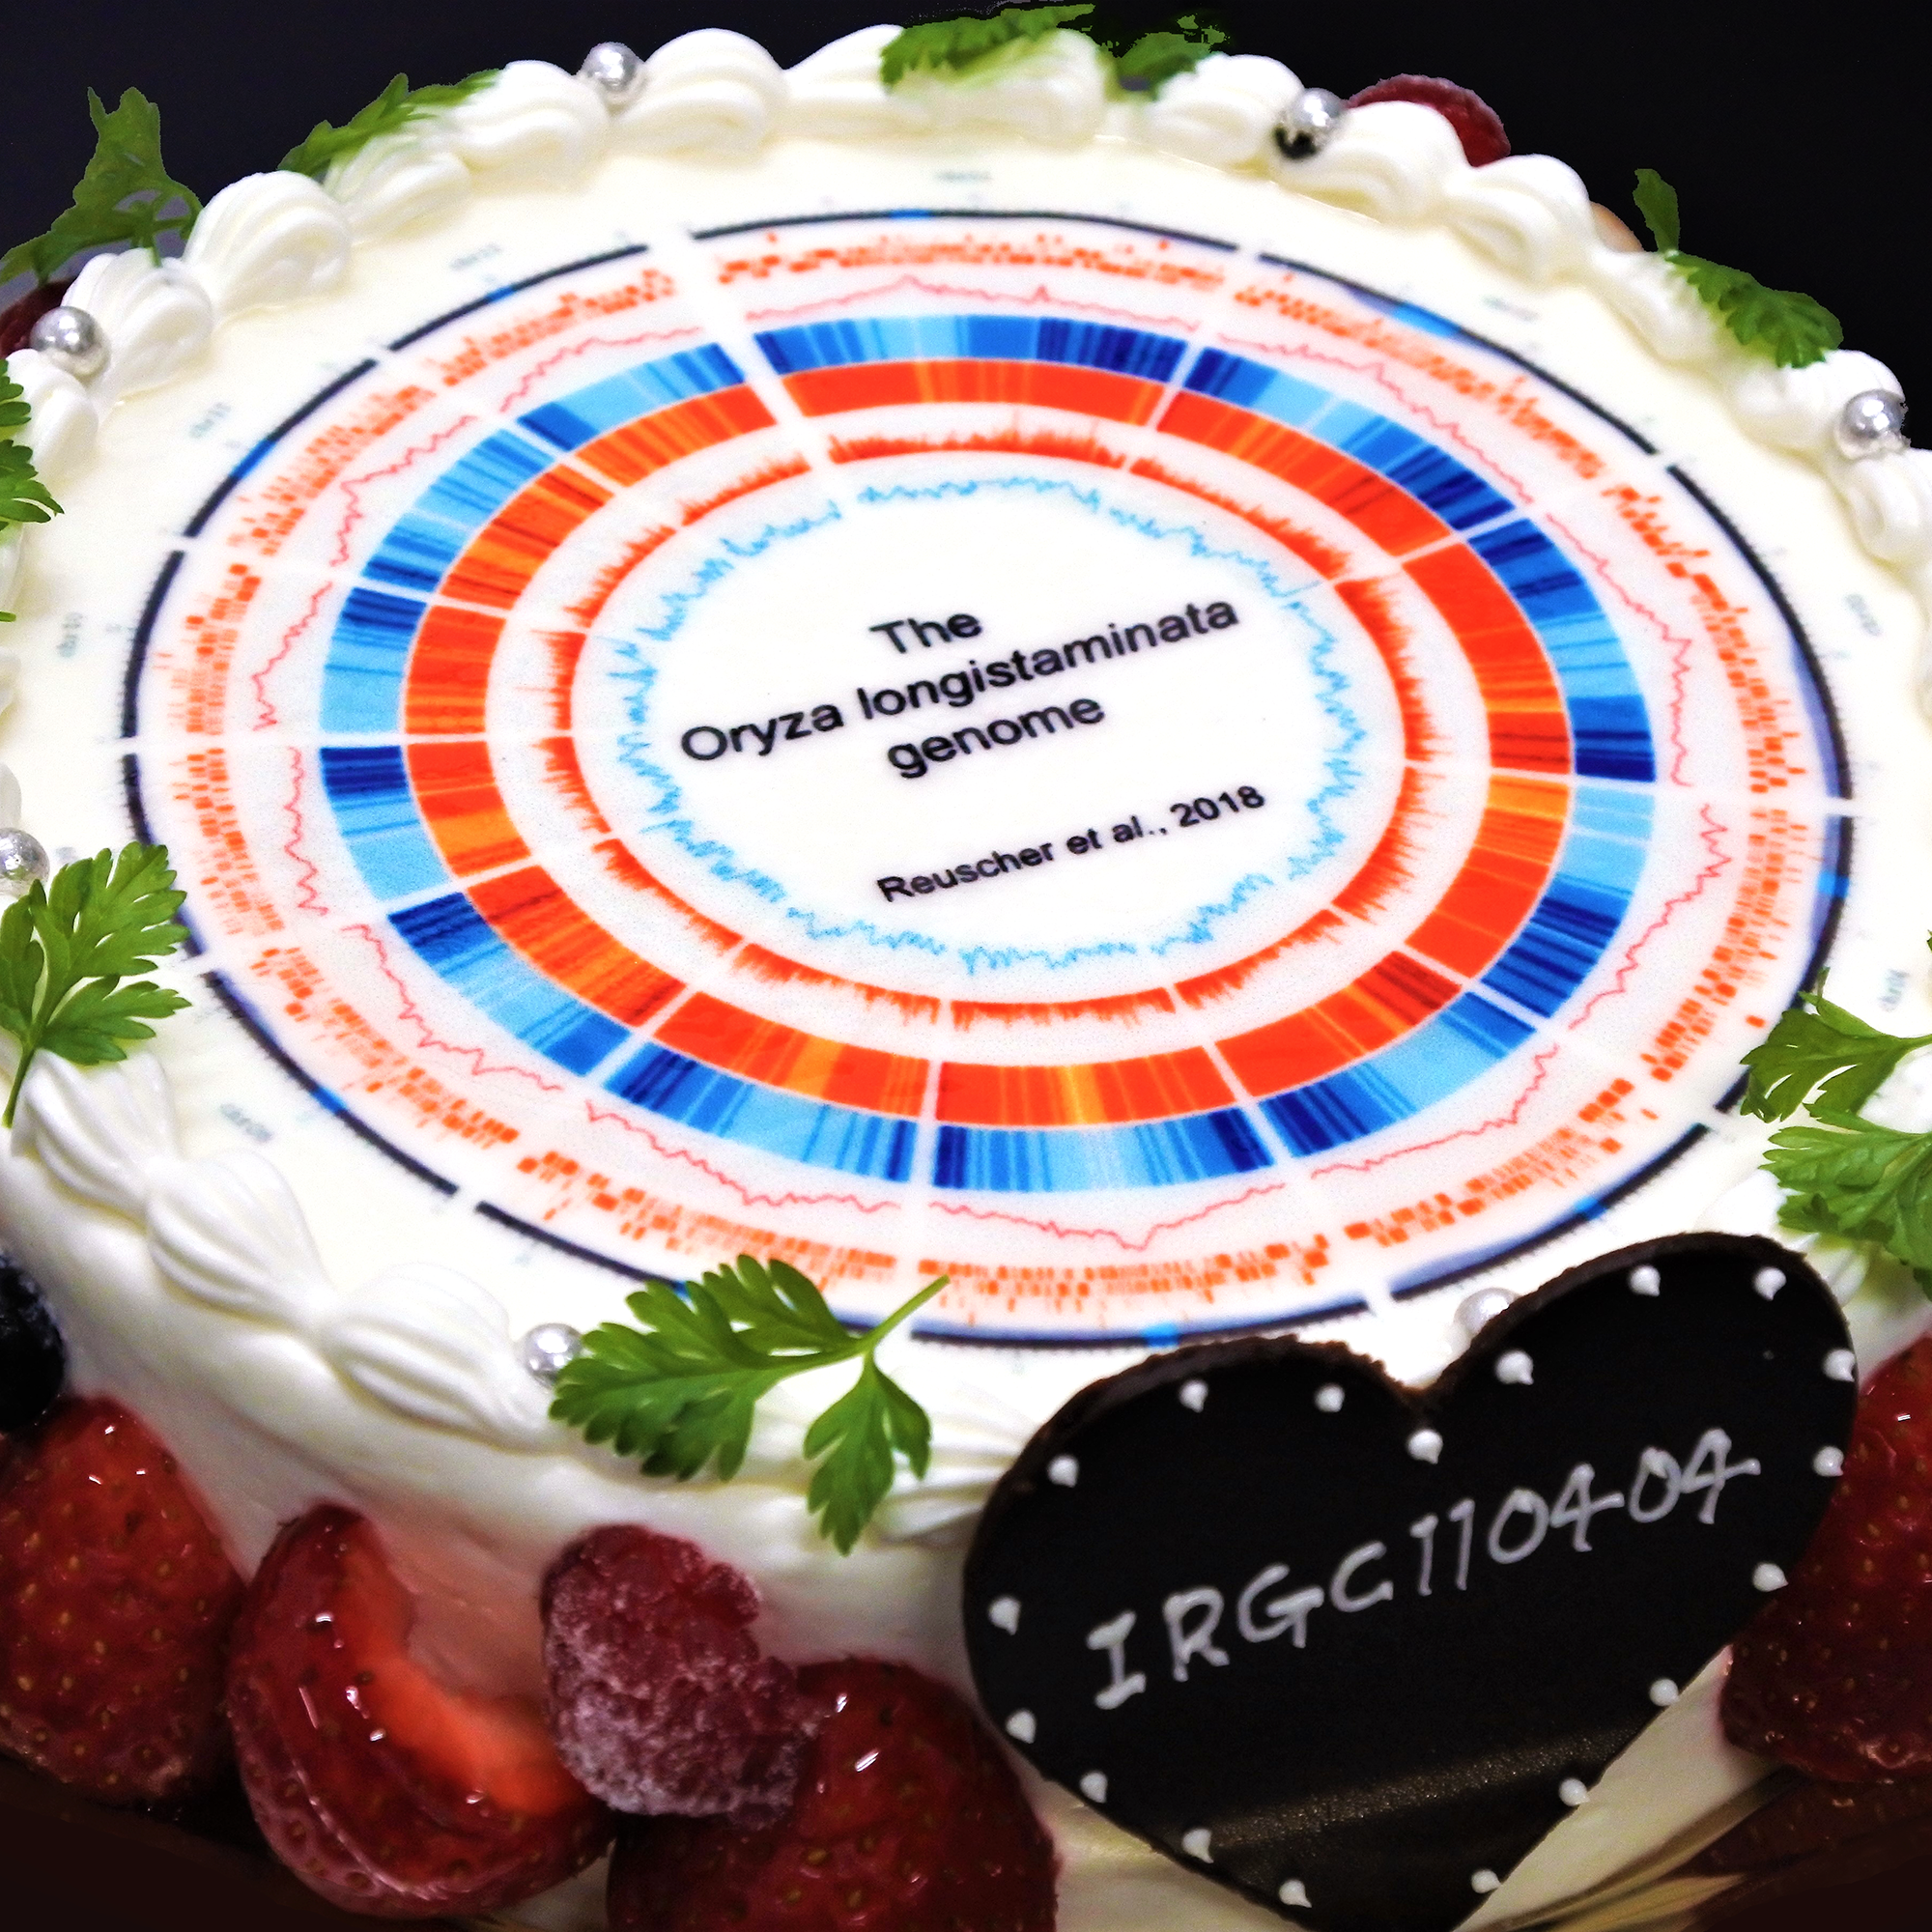
publication
It's a cake.
date
24 September 2018
citation
Reuscher, S. et al. Assembling the genome of the African wild rice Oryza longistaminata by exploiting synteny in closely related Oryza species. Commun Biol 1, 162 (2018).
DOI
10.1038/s42003-018-0171-y
about
Circular overview of the 12 assembled O. longistaminata chromosomes. Circular overview plot showing basic features across the O. longistaminata genome assembly. From outermost to innermost ring: contig coverage of the pseudo-chromosome, density of repeat elements in % of total bp, density of genes in % of total bp, mean gene expression in RPKM in eight tissues, number of SNPs between O. longistaminata and Oryza sativa ssp. japonica cv. Nipponbare, % of GC. All tracks except contig mapping show binned data with a window size of 0.5 Mb. Axis limits are shown in the center of the plot.
publication
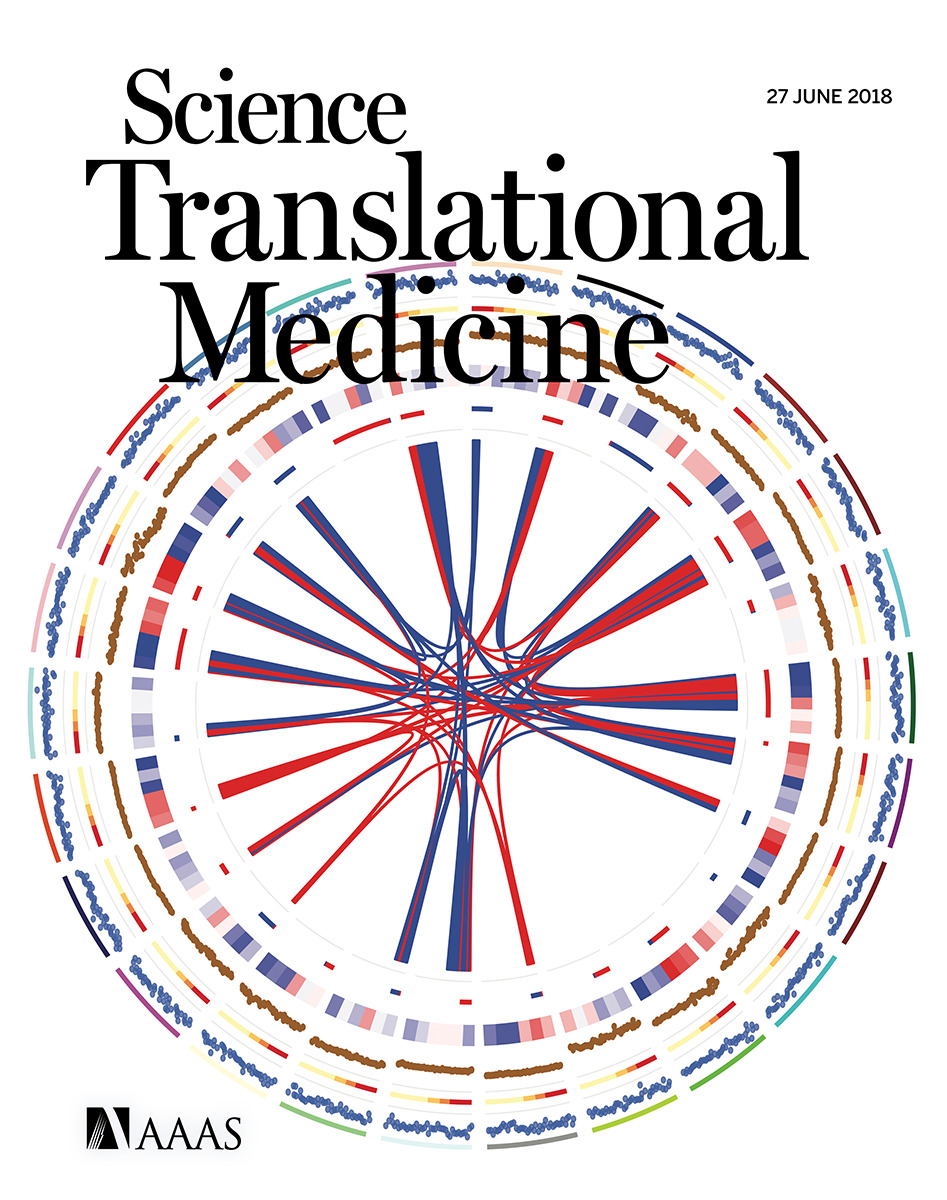
Science Translational Medicine
vol
10
issue
447
date
27 July 2018
citation
Lee H.J. et al. Integrated pathogen load and dual transcriptome analysis of systemic host-pathogen interactions in severe malaria. (2018) Sci Transl Med. 10(447):eaar3619
DOI
10.1126/scitranslmed.aar3619
about
A Deadly Duet. The molecular etiology of severe malaria is not well understood. Lee et al. sequenced the paired transcriptomes of 41 Gambian children with uncomplicated or severe malaria and their malaria-causing P. falciparum parasites. Shown here is a visualization of modules of genes with similar functional roles, as inferred by coexpression network analysis of the combined host and parasite genes from each patient. Also shown are module associations with different clinical characteristics of malaria severity. Some modules contain all human or all P. falciparum genes, whereas others contain genes from both species, reflecting possible co-regulation between host and parasite.
publication
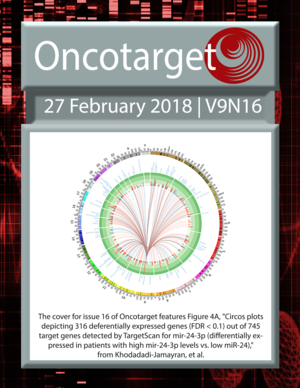
Oncotarget
vol
9
issue
16
date
27 February 2018
citation
Khodadadi-Jamayran A. et al. Prognostic role of elevated mir-24–3p in breast cancer and its association with the metastatic process. Oncotarget. 2018; 9: 12868–12878.
DOI
10.18632/oncotarget.24403
about
Circos plots depicting 316 deferentially expressed genes (FDR < 0.1) out of 745 target genes detected by TargetScan for mir-24-3p (differentially expressed in patients with high mir-24-3p levels vs. low miR-24).
publication
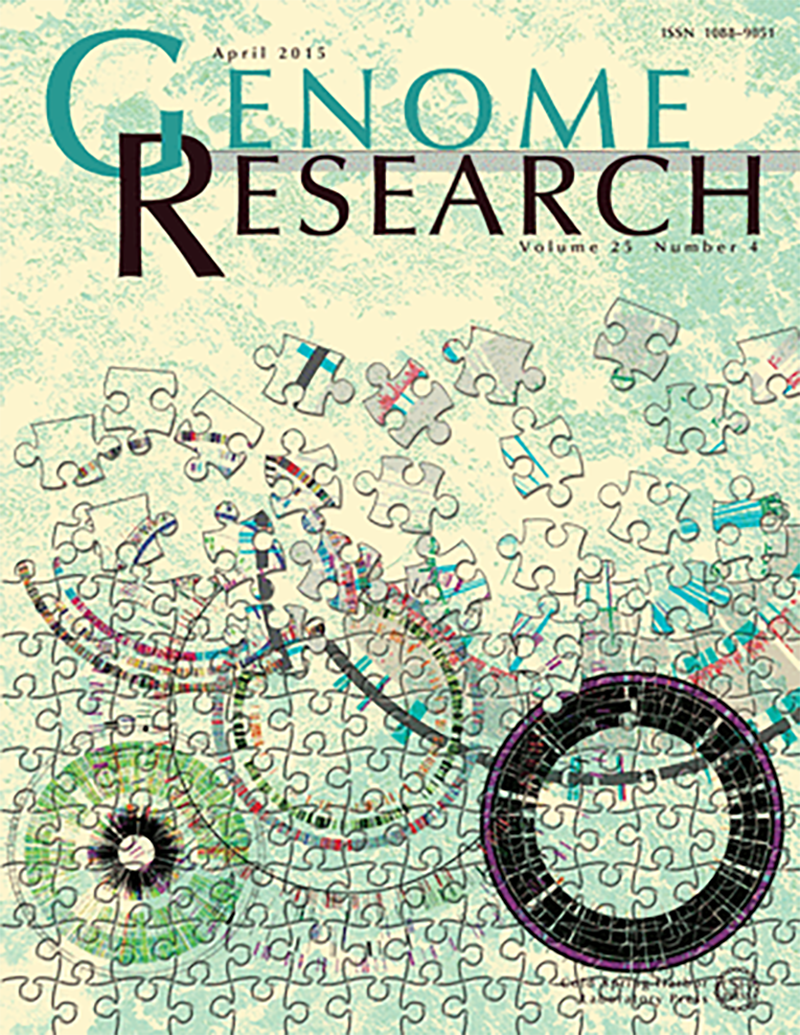
Genome Research
vol
25
issue
4
date
1 April 2015
citation
Sharon I. et al. Accurate, multi-kb reads resolve complex populations and detect rare microorganisms. (2015) Genome Res. 25(4):534–43.
DOI
10.1101/gr.183012.114
about
Metagenomics data typically consist of a huge number of DNA sequence fragments from the genomes of microbial community members collected directly from an environment. Partial and sometimes complete genomes can be reconstructed and the metabolic capabilities of specific organisms revealed. In this issue, a study demonstrates how combining short- and long-read DNA sequencing technologies can improve genome recovery and microbial community analysis. The figure is a symbolic representation of the metagenomics analysis process in which the diverse genomes are recovered using short, and now also long, DNA sequencing read data, a process that conceptually resembles one of solving jigsaw puzzles.
publication
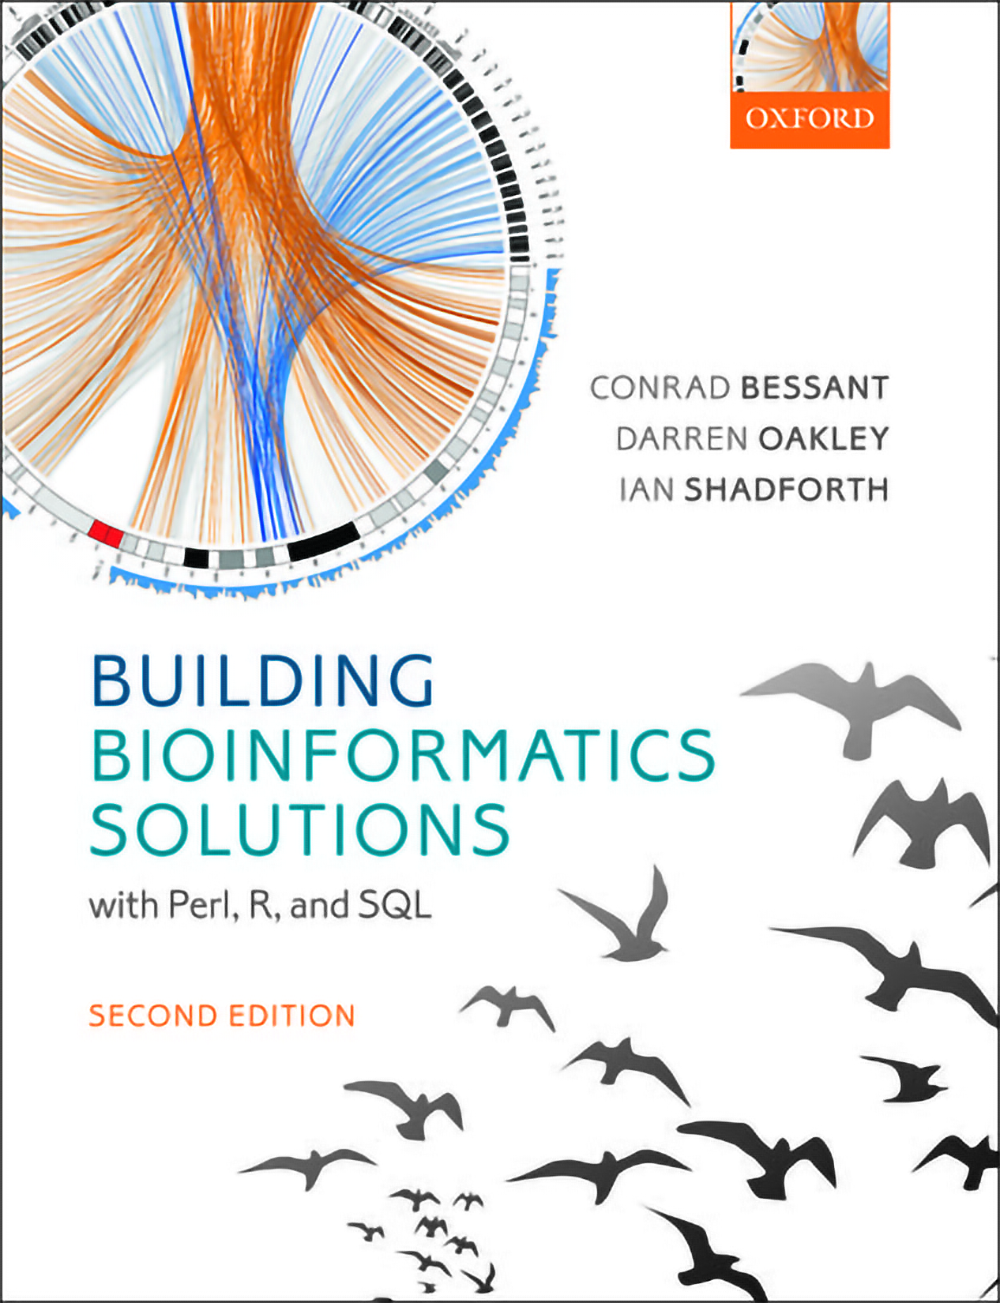
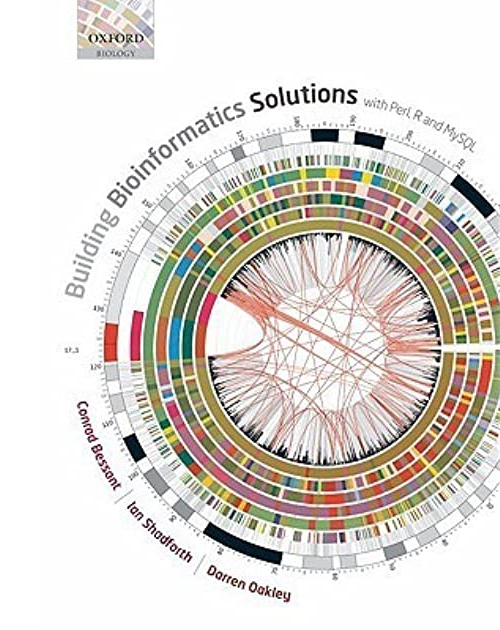
Building Bioinformatics Solutions
special issue
with Perl, R and SQL
date
1 April 2014
about
This book provides an introduction to three of the main tools used in the development of bioinformatics software — Perl, R, and MySQL — and explains how these can be used together to tackle the complex data-driven challenges that typify modern biology. The book is intended to provide the reader with the knowledge and confidence needed to create databases, to write programs to analyse and visualise data, and to develop interactive web-based applications. Platform-independent examples are provided throughout, making the book suitable for users of Windows, Mac OS or Linux.
publication
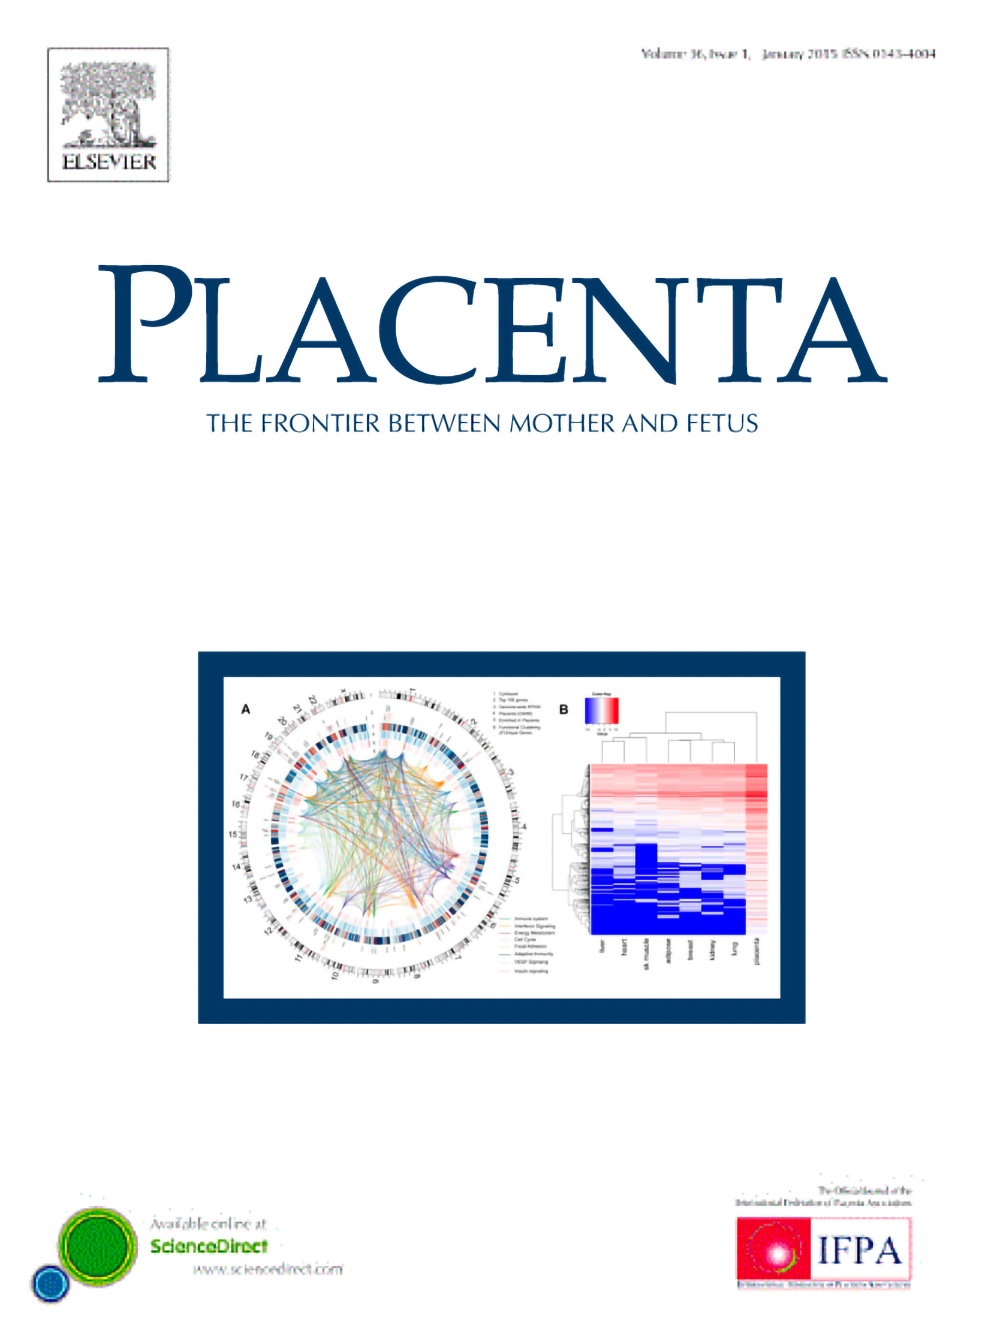
Placenta
vol
35
issue
2
date
1 February 2014
citation
Saben J, Zhong Y, McKelvey S et al. (2014) A comprehensive analysis of the human placenta transcriptome. Placenta 35, 125–131.
about
Figure 1. RNA-seq of human term placenta (n=20) A) Circos diagram depicting whole-genome RNA-seq data. Track 1: cytoband, chromosomes are depicted qter to pter. Track 2: Genomic location of top 100 highly expressed genes in placenta based on average RPKM values. Gene names in red represent genes specifically enriched in placenta. Track 3: Average RPKM values summarized over 6 MB regions showing regions of high gene expression. Track 4: Locations of genes related to placenta in the OMIM database. Track 5: Genes specifically enriched in placenta (3-fold over 7 other tissues); Track 6: Biological functions enriched among placenta-enriched genes. High-resolution images are provided in supplementary material. B) Hierarchical clustering of the 288 genes that were at least 3-fold higher and had an RPKM >1 in the placenta compared to liver, heart, smooth muscle, adipose, breast, kidney, and lung. High expression is represented in red and low expression in blue.
publication
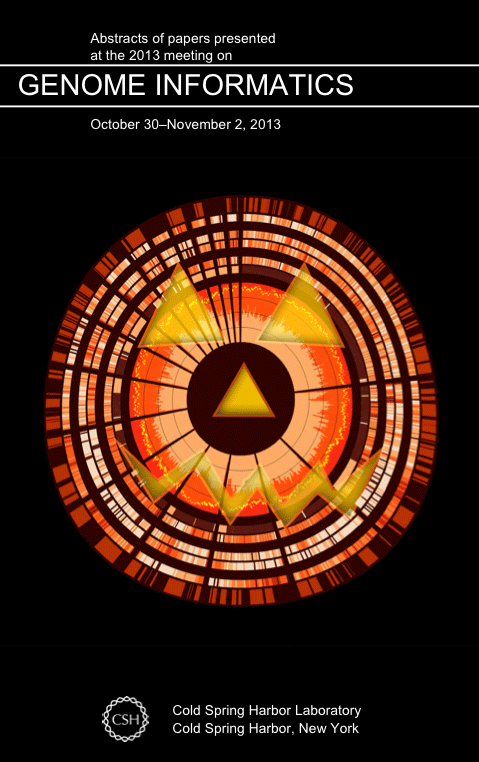
CSHL Meeting on Genome Informatics
special issue
Conference abstracts
date
30 October 2013
citation
Ming R. et al. Genome of the long-living sacred lotus (Nelumbo nucifera Gaertn.) (2013) Genome Biol 14:R41.
DOI
10.1186/gb-2013-14-5-r41
about
The pleasing roundness of Circos is used by Ming et al. to depict the Sacred Lotus genome. The Sacred lotus has religious significance in both Buddhism and Hinduism and has been used as a food and herbal medicine product in Asia for over 7,000 years. Its seeds have exceptional longevity, remaining viable for as long as 1,300 years. The plant is known for its exceptional water repellency, known as the lotus effect. The latter property is due to the nanoscopic closely packed protuberances of its self-cleaning leaf surface, which have been adapted for the manufacture of a self-cleaning industrial paint, Lotusan.
publication
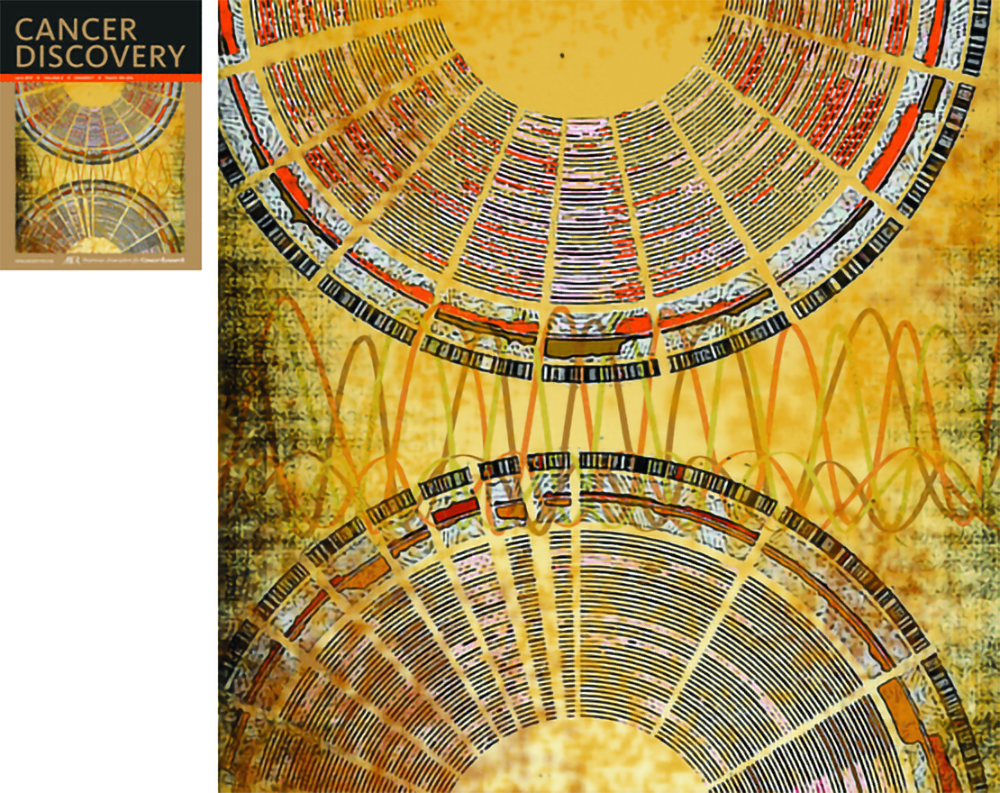
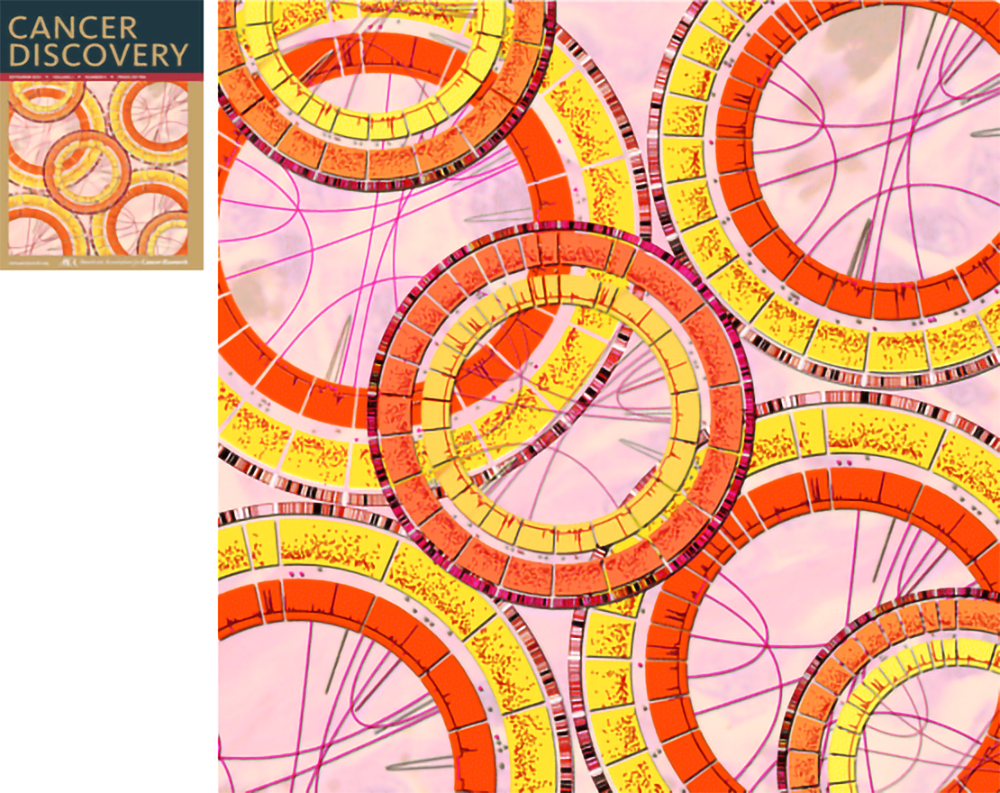
Cancer Discovery
vol
3
issue
7
date
1 July 2013
citation
Pickering CR, Zhang J, Yoo SY, Bengtsson L et al. Integrative Genomic Characterization of Oral Squamous Cell Carcinoma Identifies Frequent Somatic Drivers. (2013). Cancer Discovery 3, 770–781
about
Head and neck squamous cell carcinomas (HNSCC) are a genetically heterogeneous group of cancers with a poor survival rate. Lui and colleagues evaluated the mutation frequency of mitogenic pathways in HNSCCs and found that 30.5% of tumors harbored PI3K pathway mutations. Patient-derived tumorgrafts with hotspot and noncanonical PIK3CA mutations were highly sensitive to PI3K inhibitors. Pickering and colleagues performed integrated genomic analyses of oral squamous cell carcinomas (OSCC), a particularly lethal, poorly characterized HNSCC sub-type. The Notch pathway was deregulated in 66% of OSCCs, and inactivation of NOTCH1 was shown to drive OSCC growth. Common inactivating mutations of FAT1 and CASP8 were also identified. Together, these findings provide insight into the etiology of HNSCC and identify potential therapeutic targets.
publication
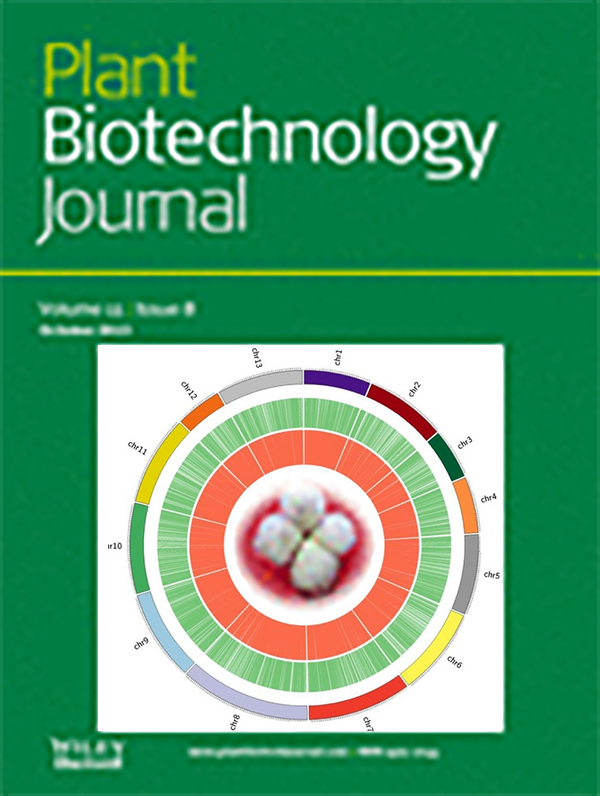
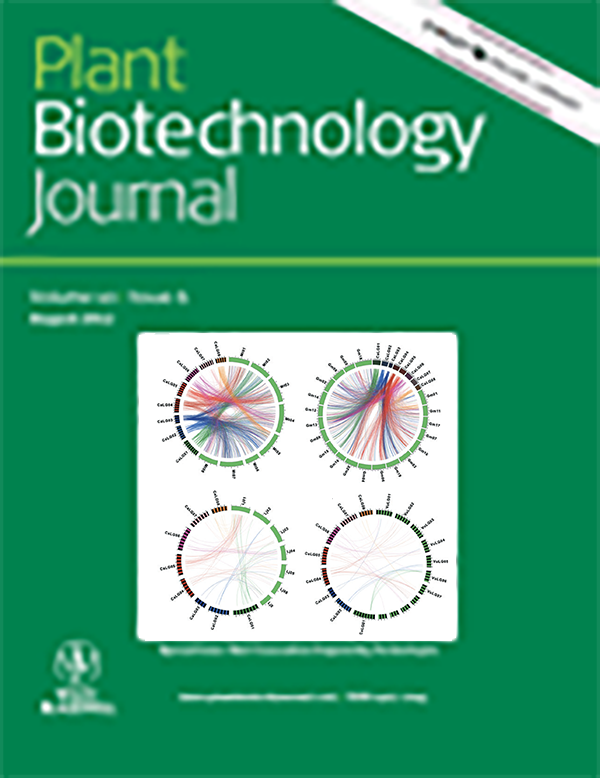
Plant Biotechnology
vol
11
issue
8
date
19 June 2013
citation
Rai K.M. et al. Large-scale resource development in Gossypium hirsutum L. by 454 sequencing of genic-enriched libraries from six diverse genotypes. (2013) Plant Biotechnol J. Oct;11(8):953–63.
DOI
10.1111/pbi.12088
about
Distribution of Gossypium hirsutum simple sequence repeats (SSRs) and single nucleotide polymorphisms (SNPs) containing sequences on G. raimondii reference genome. SSRs and SNPs containing sequences from our study were mapped on both versions of G. raimondii genome using gsReferenceMapper v2.5.3. (Figure 4a)
publication
Asian J Andrology
vol
15
issue
3
date
18 March 2013
citation
Wyatt A.W. et al. The diverse heterogeneity of molecular alterations in prostate cancer identified through next-generation sequencing. (2013) Asian J Androl. May;15(3):301–8.
DOI
10.1038/aja.2013.13.
about
Significantly recurrent molecular alterations in prostate cancer. Circos plot showing the 90 significantly aberrant copy number aberrations from an analysis of 372 prostate tumours (green=loss; red=gain).21 Significantly mutated genes from studies of large tumour cohorts are annotated by black dots around the outside, with dot size proportional to the level of significance.29,55 Recurrent fusion genes involving ETS transcription factors are shown in the centre of the plot, as are recently identified non-ETS fusions genes.
publication
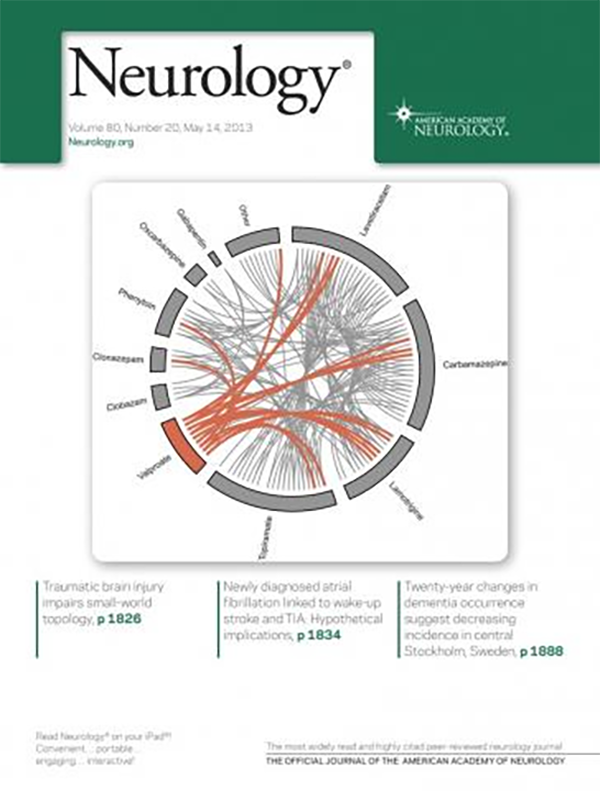
Neurology
vol
80
issue
20
date
14 March 2013
citation
Pardoe H.R. et al. Sodium valproate use is associated with reduced parietal lobe thickness and brain volume. (2013) Neurology 80(20):1895–1900.
DOI
10.1212/WNL.0b013e318292a2e5
about
Antiepileptic drug combinations in intractable focal epilepsy cases (group A). Valproate cases are shown in orange, and nonvalproate cases are shown in gray. A line between the 2 drugs indicates the individual was taking the drugs as polytherapy. The “other” category includes nonantiepileptic medications.
publication
Pathology
vol
230
issue
2
date
27 February 2013
citation
Weier C. et al. Nucleotide resolution analysis of TMPRSS2 and ERG rearrangements in prostate cancer. (2013) J Pathol. Jun;230(2):174–83.
DOI
10.1002/path.4186
about
Genomic architecture and in situ confirmation of rearrangements involving TMPRSS2 and/or ERG (A) Circos plot depicting 26 rearrangements between TMPRSS2 and ERG identified in 25 out of 83 prostate cancer tissues analyzed. Each inner line represents a TMPRSS2-ERG rearrangement. Outer lines represent intragenic rearrangements within the TMPRSS2 or ERG loci. Red links represent rearrangements identified with standard orientation (5’ sense fragment of TMPRSS2 fused to a 3’ sense fragment of ERG). Orange links represent nonstandard rearrangements as noted in the text. Rearrangement hotspots are noted in brackets. (B) Circos plot showing inter-chromosomal rearrangements involving TMPRSS2 or ERG with other genes. The gene name of the overlapping or closest fusion partner gene is indicated. Blue and green lines indicate rearrangements involving TMPRSS2 or ERG, respectively.
publication
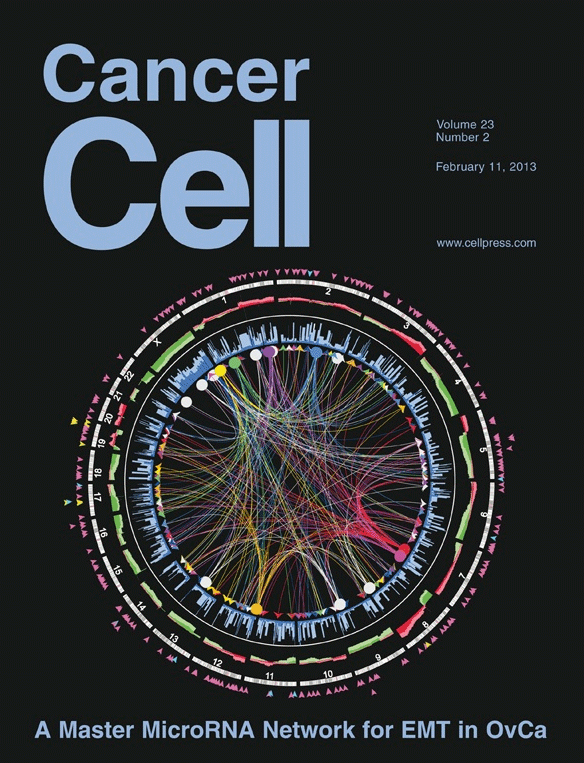
Cancer Cell
vol
23
issue
2
date
11 February 2013
citation
Yang D. et al. Integrated analyses identify a master microRNA regulatory network for the mesenchymal subtype in serous ovarian cancer. Cancer Cell (2013) 23:186–199.
DOI
10.1016/j.ccr.2012.12.020
about
Integrated View of Mesenchymal Signature Genes Regulated by Copy Number, Methylation, and MiRNA (Figure 1).
publication
Nature Reviews Cancer
special issue
2013 Calendar
date
1 January 2013
about
Calendar compiled and edited by Gemma Alderton, Darren Burgess, Nicola McCarthy and Sarah Seton-Rogers. Copy-edited by Catriona Rodwell. Designed and illustrated by Lara Crow
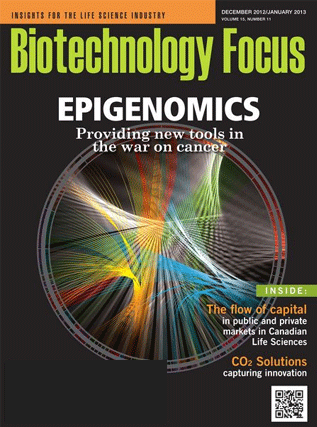
publication
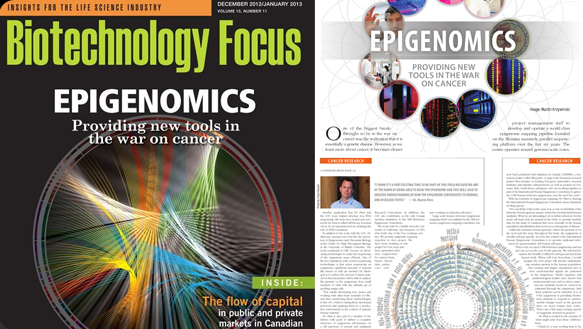
Biotechnology Focus
date
1 December 2012
publication
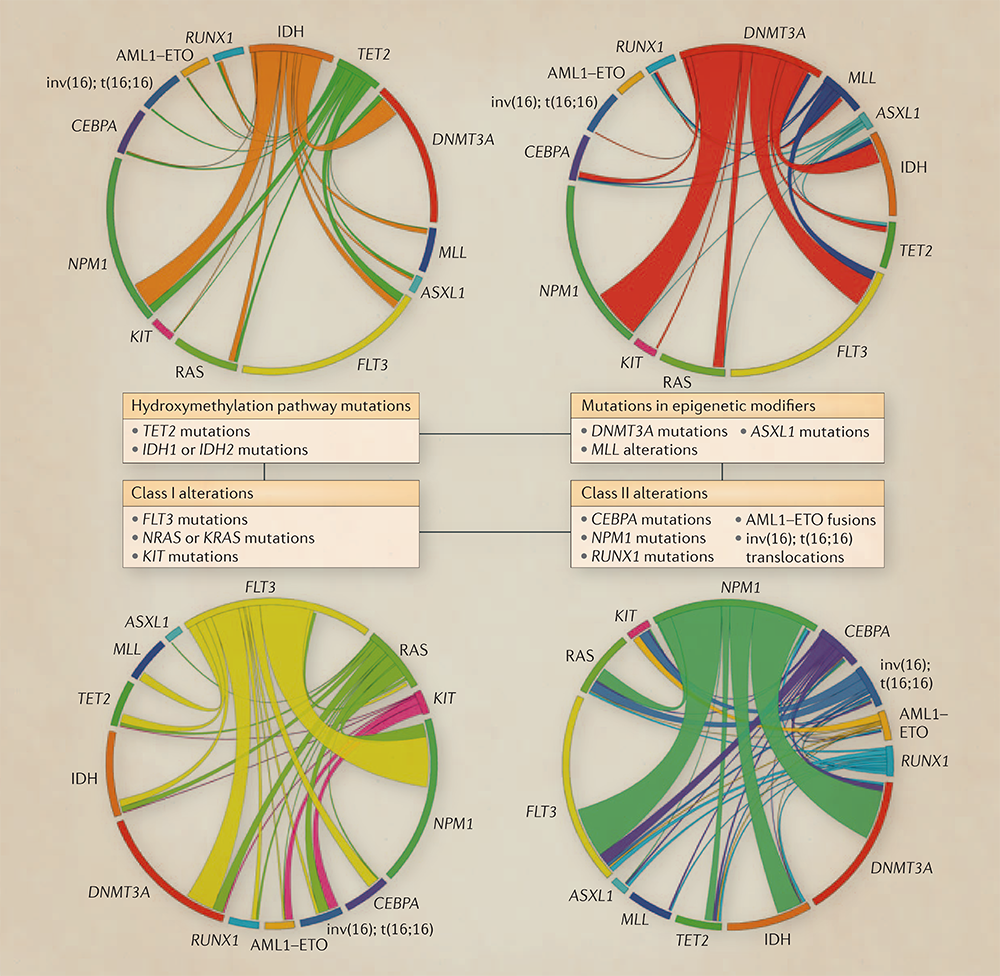
Cancer Discovery
vol
2
issue
9
date
1 September 2012
citation
Brown-Dahlman K, Xia J, Hutchinson K, Ng C et al. BRAFL597 Mutations in Melanoma Are Associated with Sensitivity to MEK Inhibitors (2012) Cancer Discovery 2, 791–797.
about
Dahlman and colleagues identified a BRAFL597R mutation in an aggressive BRAFV600E-negative melanoma, and found that as many as 8% of melanomas classified clinically as “BRAF wild type” may actually harbor other less common BRAF exon 15 mutations. Importantly, these mutants led to increased MEK/ERK signaling that was readily suppressed by MEK inhibitors, suggesting that patients with these less common BRAF mutations may also benefit from MEK inhibitor therapy. Indeed, one such patient with metastatic melanoma enrolled in a phase I trial of an allosteric MEK inhibitor experienced a sustained partial response, indicating that expanded BRAF mutational testing may benefit additional patients.
publication
Plant Biotechnology
special issue
Nextgen Sequencing Technologies special issue
vol
10
issue
6
date
7 August 2012
citation
Hiremath P.J. et al. Large-scale development of cost-effective SNP marker assays for diversity assessment and genetic mapping in chickpea and comparative mapping in legumes. (2012) Plant Biotechnol J. 10(6):716–732.
DOI
10.1111/j.1467-7652.2012.00710.x
about
Genome relationships of chickpea with closely related legume species. Homologous relationship of chickpea genome with four legume spe-cies, that is,Medicago truncatula(a), soybean (b),Lotus japonicus(c) and cowpea (d), has been shown by comparing sequence data of 1064 mappedmarkers of chickpea with genome sequence ofMedicago(Mt 3.5),L. japonicus(Lj 2.5 pseudomolecules), soybean (Glyma1 genome assembly) andcowpea genetic map (Mucheroet al., 2009). Maximum similarity was observed withMedicago(1558), followed with soybean genome (1798),Lotus(438) and least with cowpea (55). The percentage of matches in each species is in congruence with their phylogenetic distances.
publication
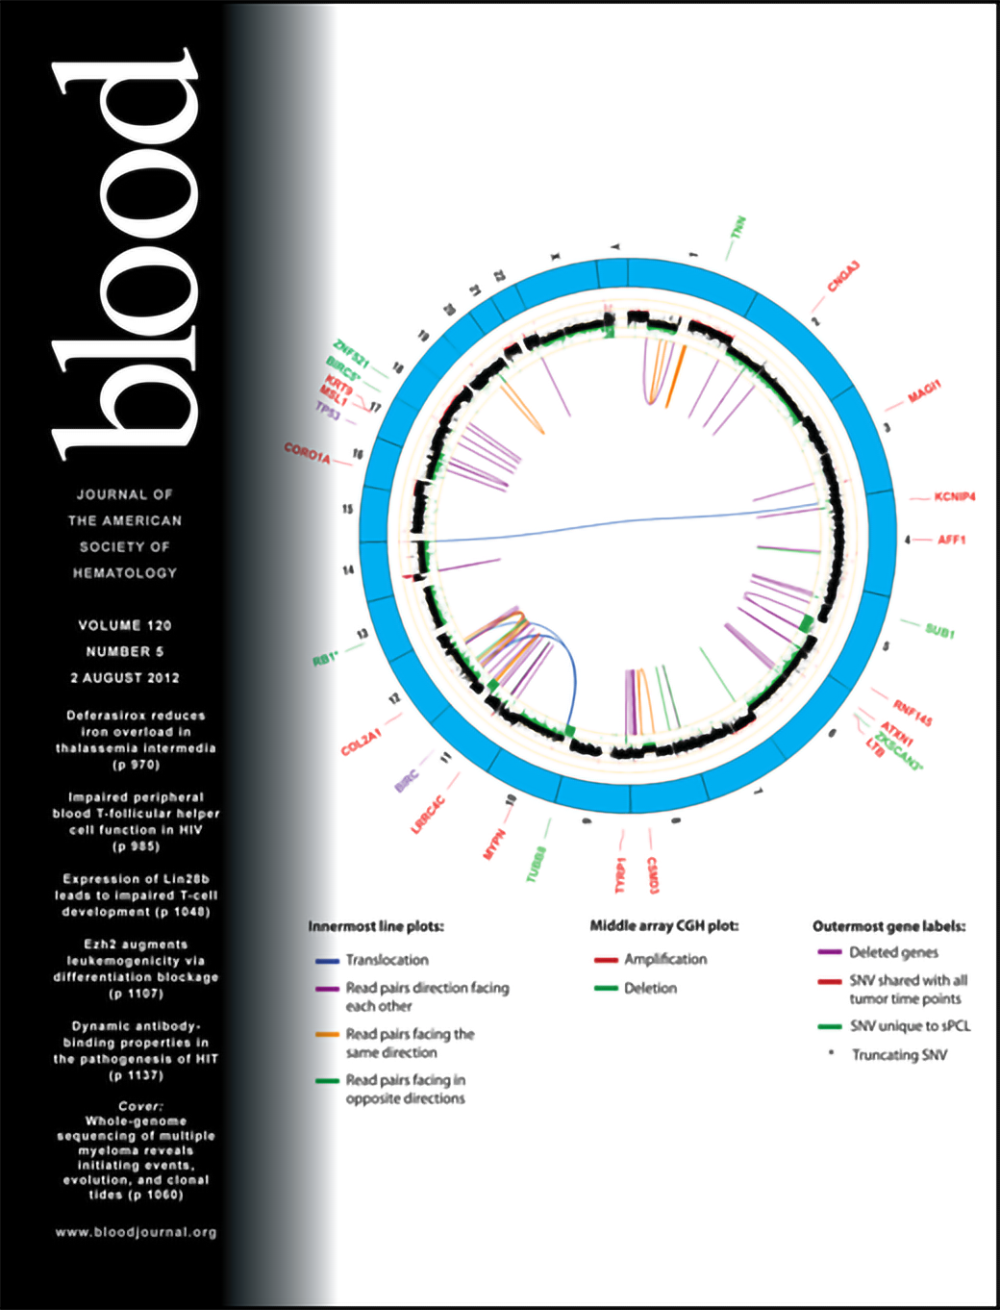
Blood
vol
120
issue
5
date
2 August 2012
citation
Egan JB, Shi CX, Tembe W, Christoforides A et al. Whole-genome sequencing of multiple myeloma from diagnosis to plasma cell leukemia reveals genomic initiating events, evolution, and clonal tides. (2012) Blood 120, 1060–1066.
about
Circos plot depicting the summary of structural variation in the sPCL. The center, line plots indicate the presence of discordant read pairs. The middle ring contains the array CGH plot, and the outermost ring indicates mutated or deleted genes.
publication
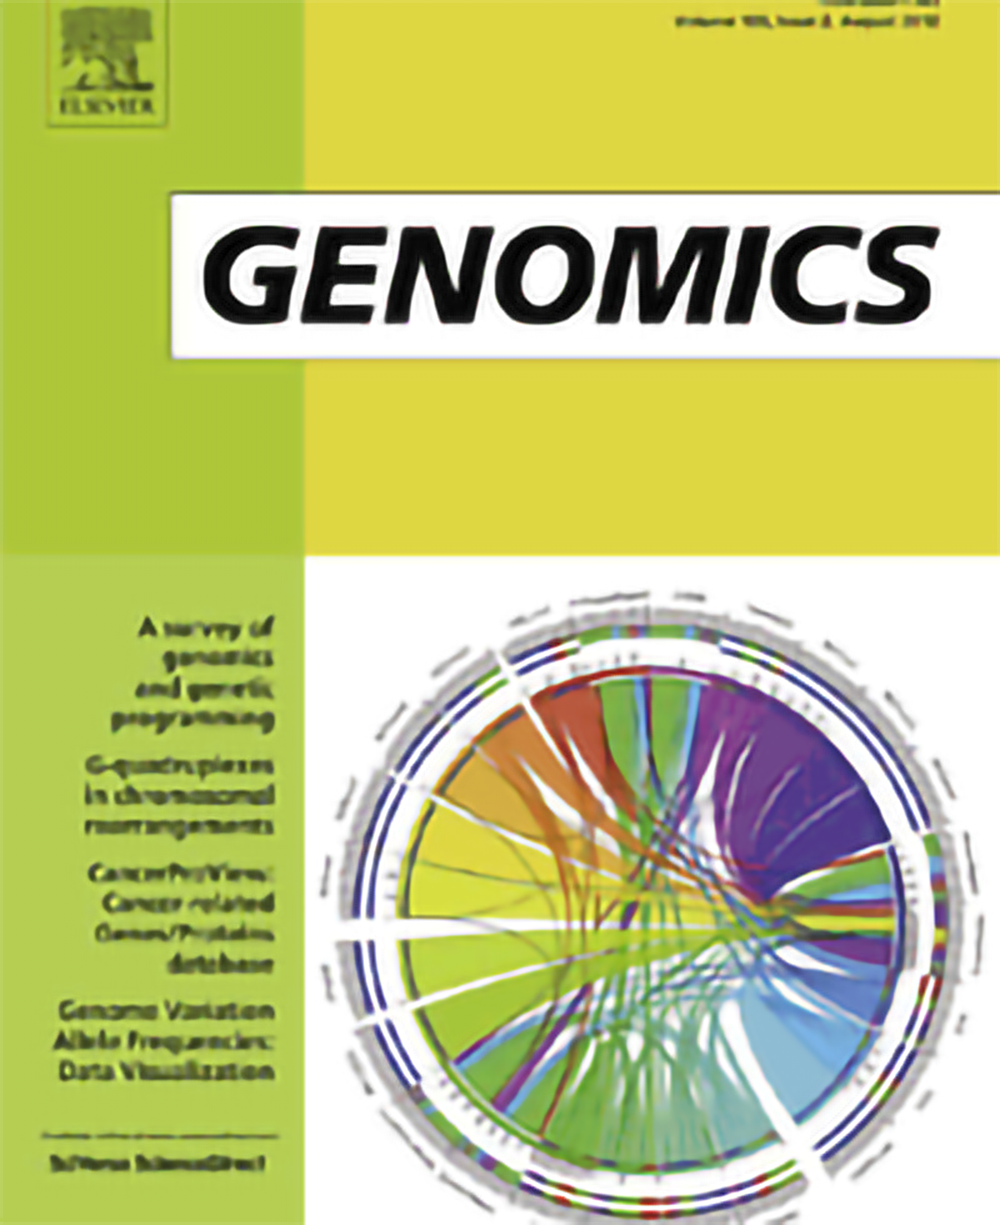
Genomics
vol
100
issue
2
date
1 August 2012
citation
Katapadi VK, Nambiar M, Raghavan SC, Potential G-quadruplex formation at breakpoint regions of chromosomal translocations in cancer may explain their fragility. (2012) 100, 72–80.
DOI
10.1016/j.ygeno.2012.05.008
about
Graphical representation of human genes involved in translocations of both lymphoid and non-lymphoid cancers, harboring different types of non-B DNA structures. The circos plot depicts different genes involved in human cancers in the inner ring and various non-B DNA structures in the outer ring. Each gene has been assigned a color. The arcs originate from different genes and terminate at different types of non-B DNA structures. The area of each colored ribbon depicts the frequency of that non-B DNA structure in the particular gene.
publication
Genome Research
vol
21
issue
12
date
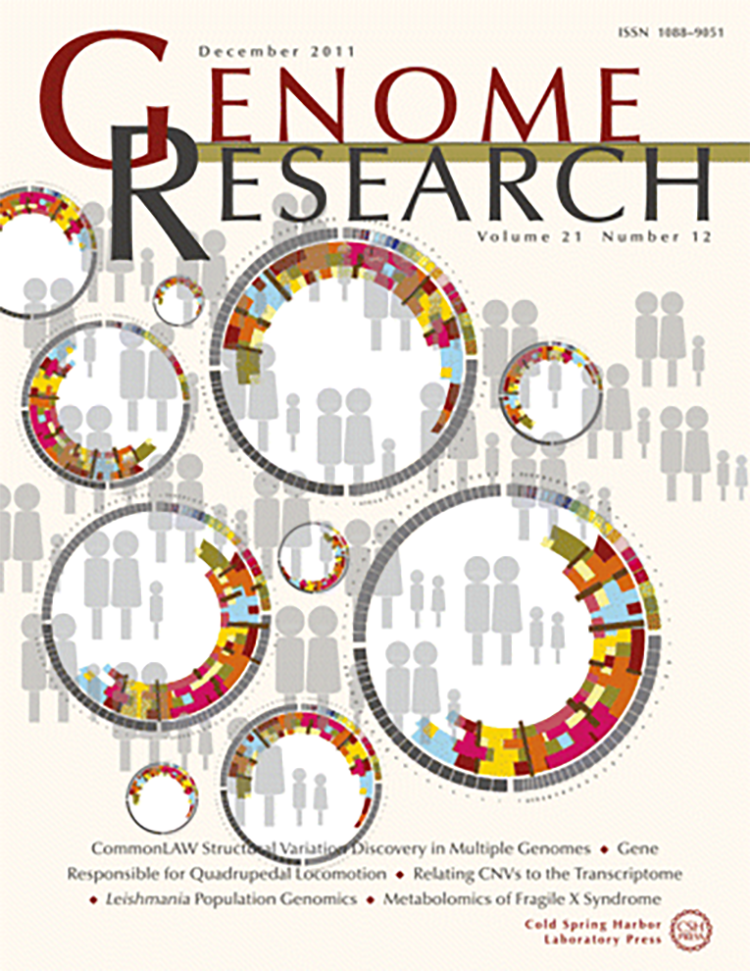
1 December 2011
citation
Hormozdiari F, Hajirasouliha I, McPherson A, Eichler EE, Sahinalp SC. Simultaneous structural variation discovery among multiple paired-end sequenced genomes. (2011) Genome Res 21(12):2203–2212.
DOI
10.1101/gr.120501.111
about
Human reference genomes, represented by circles; the arcs inside each circle symbolize highly related sequenced genomes (i.e., individuals from the same family or population). The colorful abstract segments on each arc show common and rare structural variation events among individual genomes. The CommonLAW package presented in this issue introduces novel combinatorial formulations and algorithms for structural variation discovery among a number of sequenced donor genomes, with the help of a complete reference genome. CommonLAW significantly reduces the false positive rate in detecting structural variation events when compared with conventional methods.
publication
Science Translational Medicine
vol
3
issue
111
date
30 November 2011
citation
Roychowdhury S. et al. Personalized oncology through integrative high-throughput sequencing: a pilot study. (2011) Sci Transl Med. 30;3(111):111ra121
DOI
10.1126/scitranslmed.3003161
about
Circle of Cancer. This picture of a tumor genome is at the heart of the personalized cancer treatment described by Roychowdhury et al. in this issue. By quickly sequencing normal and tumor DNA and RNA (in 3 to 4 weeks) from patients with colorectal and prostate cancer, the authors could summarize the key genetic defects of the tumor (blue lines, intrachromosomal rearrangements; yellow lines, inversions; orange lines, interchromosomal rearrangements). A board of experts then recommended suitable therapy, tailored for the specific mutations identified.
publication
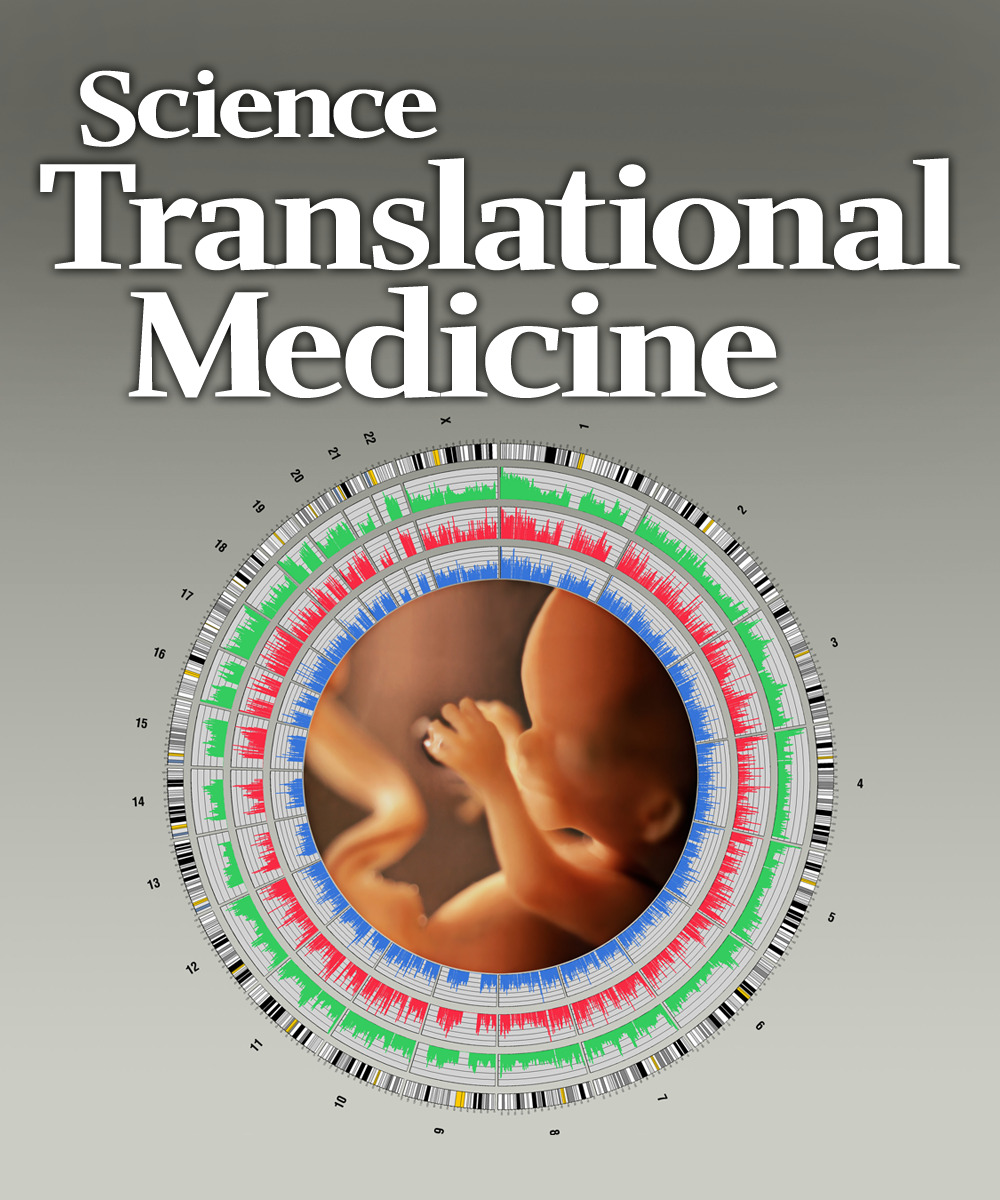
Science Translational Medicine
vol
2
issue
61
date
8 December 2010
article
citation
Lo YMD, Chan KCA, Sun H, Chen EZ et al. Maternal Plasma DNA Sequencing Reveals the Genome-Wide Genetic and Mutational Profile of the Fetus. (2010) Science Translational Medicine, 2, 61ra91.
DOI
10.1126/scitranslmed.3001720
about
Scanning Fetal DNA. During pregnancy, a fetus releases its DNA as short fragments into the blood of its mother. In this issue, Lo et al. report that by sequencing billions of DNA molecules from the plasma of a pregnant woman they were able to assemble the full genome of the fetus prenatally and noninvasively and identify a mutation in the fetal DNA for the inherited blood disease β-thalassemia. The outermost ring of this week’s cover image depicts human chromosomes arranged in a circle. The green, red, and blue rings show the sequence composition (GC content) and the extent of sequencing for total (mainly maternally-derived) DNA and fetal-specific DNA in maternal plasma, respectively.
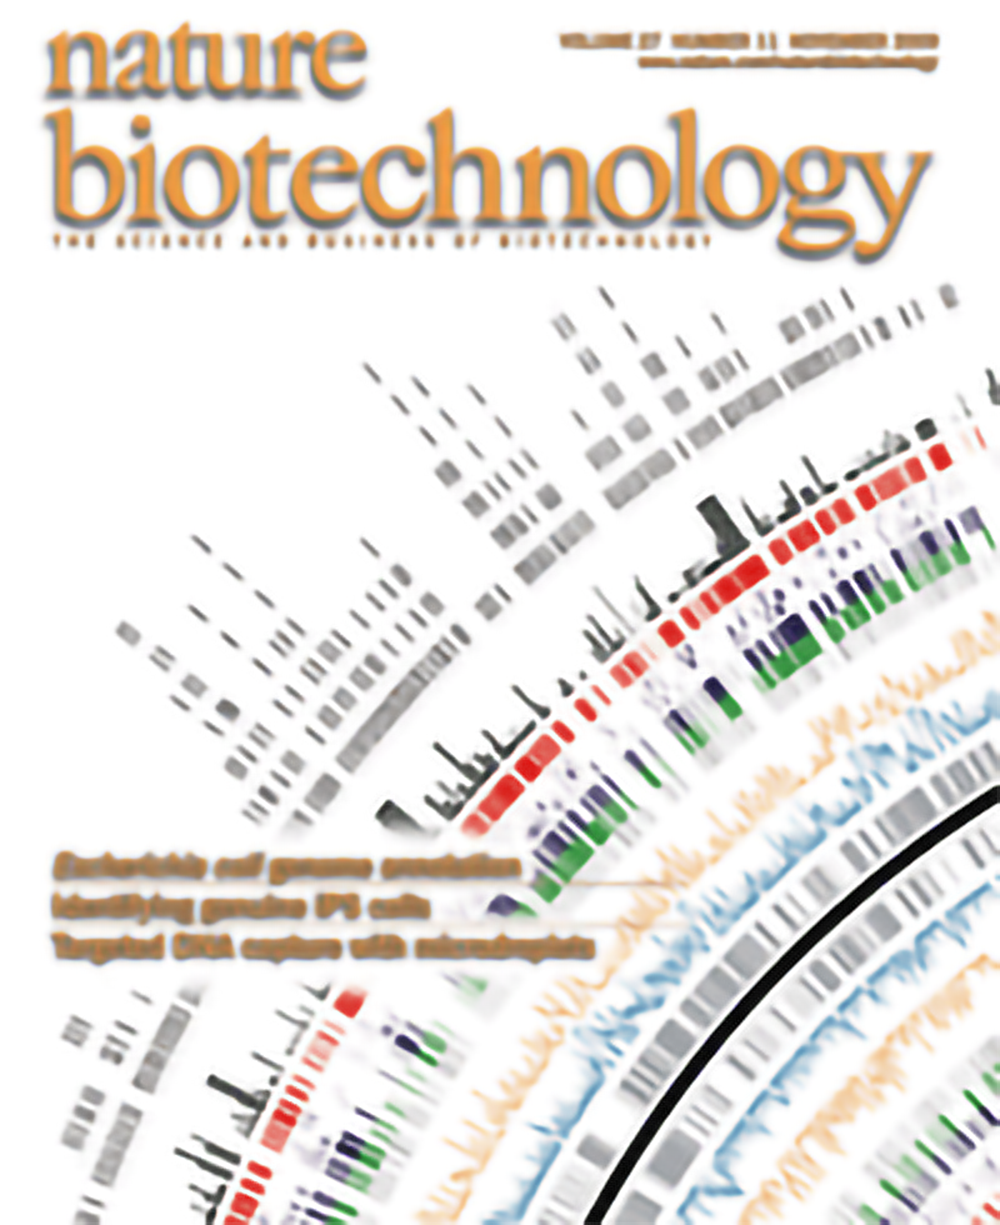
publication
Nature Biotechnology
vol
27
issue
11
date
1 November 2009
citation
Byung-Kwan Cho B-K, Zengler K, Qiu Y, Park YS et al. The transcription unit architecture of the Escherichia coli genome. (2009) Nature Biotechnology 27, 1043–1049.
DOI
doi.org/10.1038/nbt.1582
about
Graphical representation of part of the Escherichia coli genome. Cho et al. integrate several genomewide measurements of transcription and translation with the current annotation to elucidate the genome&s architecture (p 1043). Credit: Byung- Kwan Cho/Kimberly Caesar.
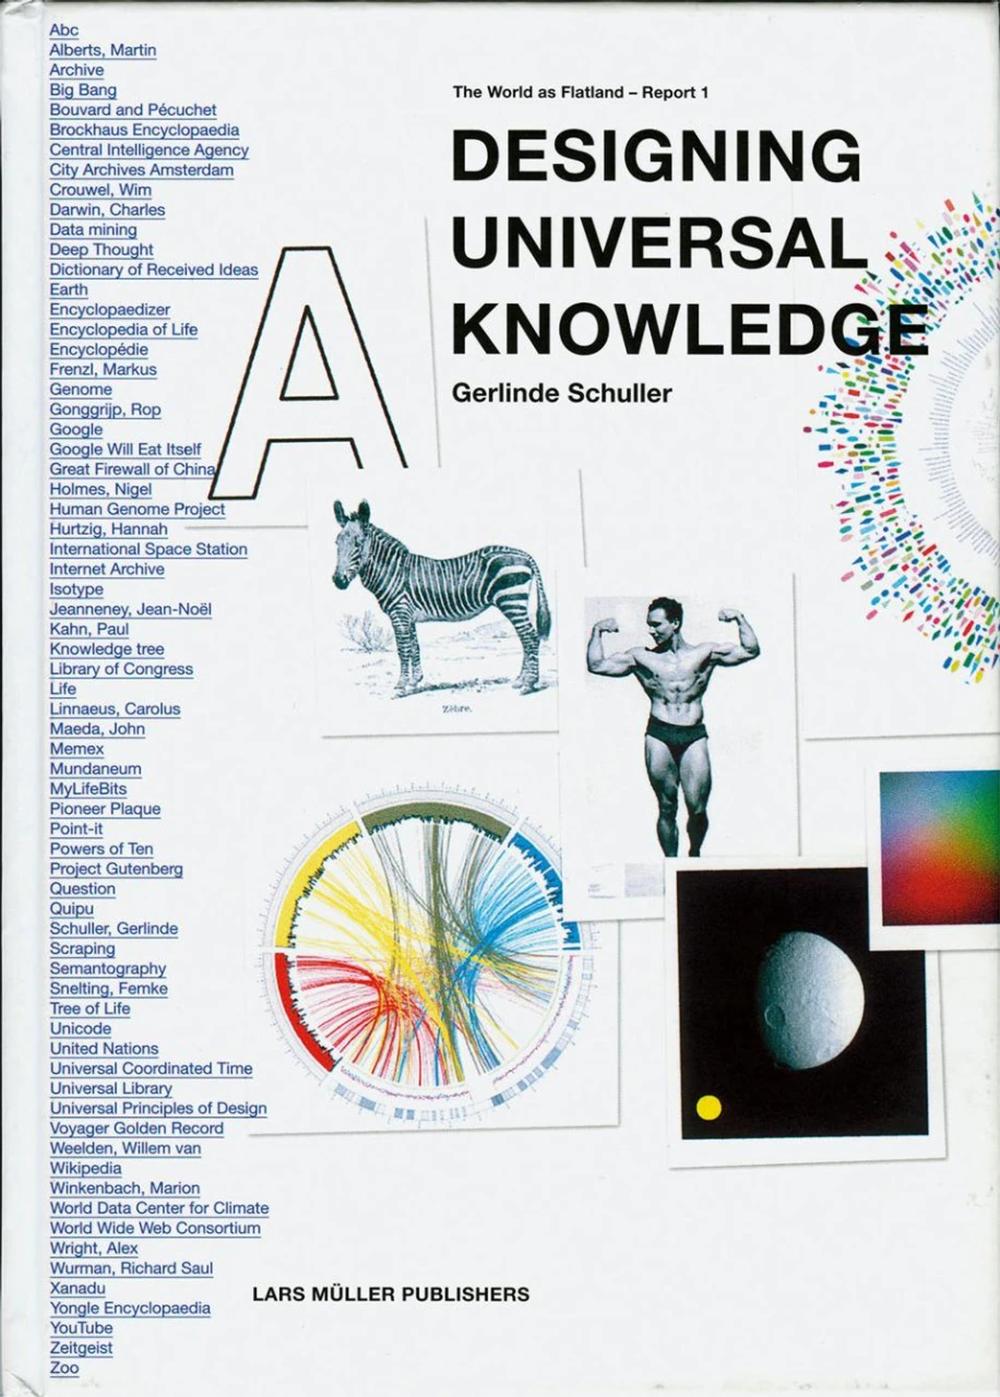
publication
Designing Universal Knowledge
special issue
The World as Flatland – Report 1
date
1 January 2009
article
about
The development of modern communication and information technologies like the Internet and globalization have not only changed access and spread of the available knowledge but also the speed of collecting. The author examines collections of knowledge such as archives, encyclopedias, data collections, and libraries that make knowledge accessible worldwide. Who is collecting the world’s knowledge? How is it structured and designed? Who determines the access of knowledge? Designers and researchers from different fields have set standards for the classification and design of complex data collections and thus exerted an enormous influence on how knowledge is communicated. This facilitates knowledge transfer, but it also increases the danger of manipulation. Along with these aspects, the book also explores the possibilities of “universal design” and presents new approaches to visualizing complex information.
publication
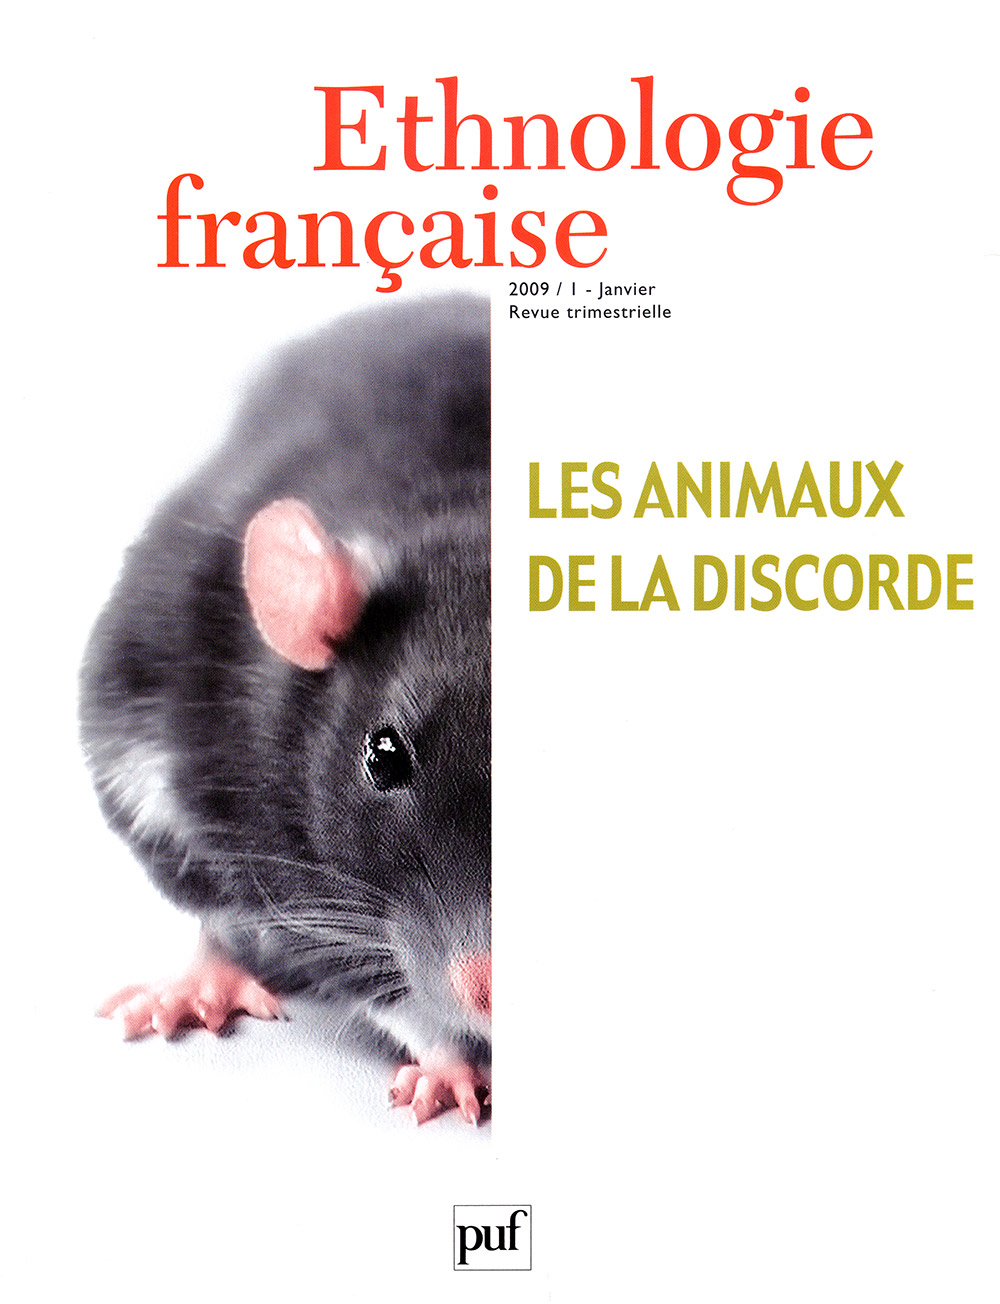
Ethnologie Francaise
special issue
Animals of Discord
vol
39
issue
1
date
1 January 2009
about
On the cover: Alex, world's most popular rat.
publication
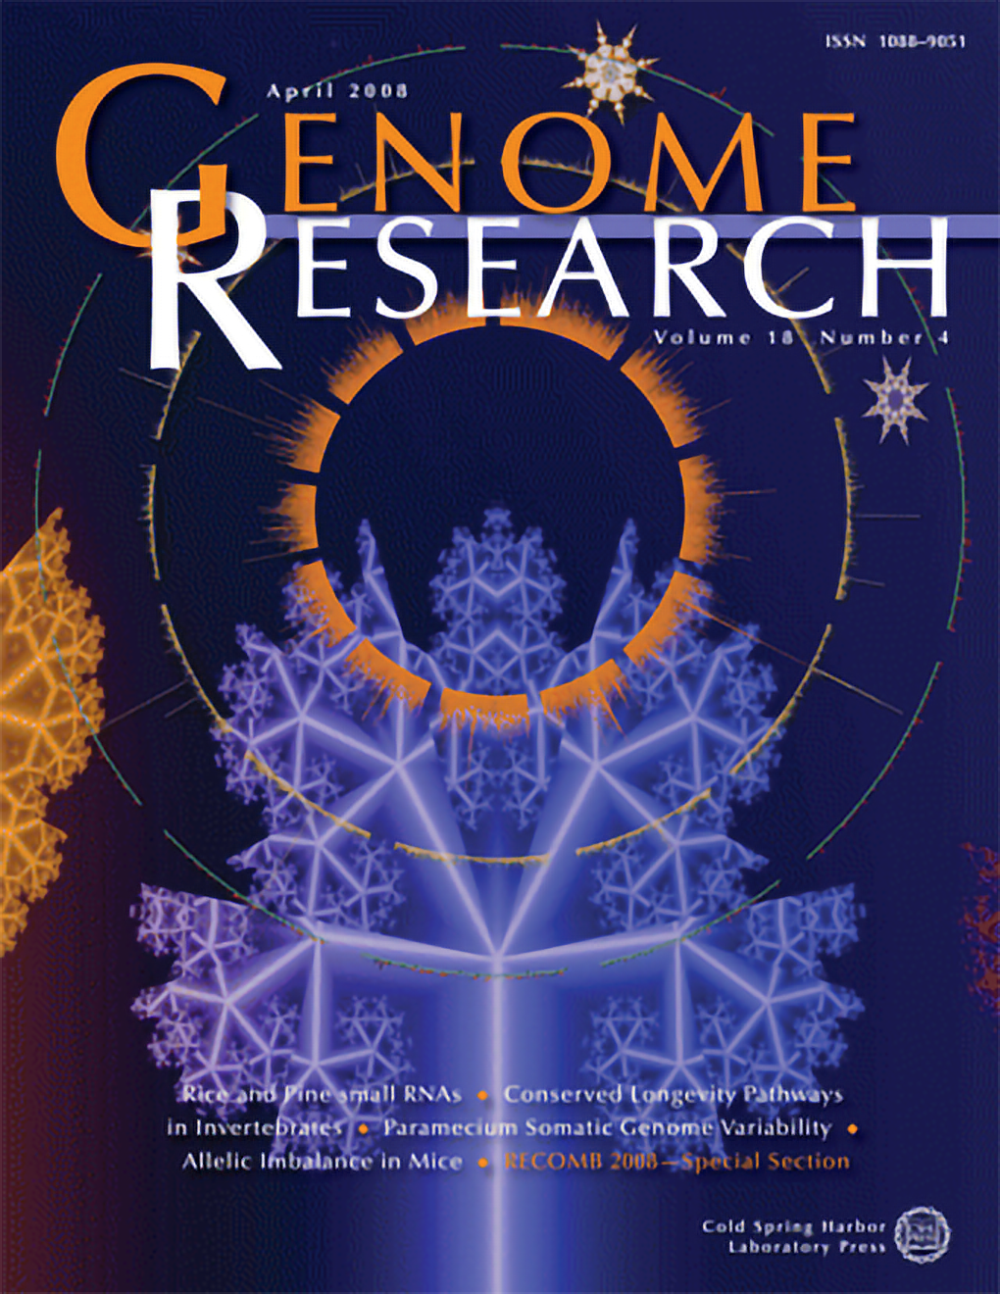
Genome Research
vol
18
issue
4
date
1 April 2008
citation
Morin RD, Aksay G, Dolgosheina E, Ebhardt HA et al. Comparative analysis of the small RNA transcriptomes of Pinus contorta and Oryza sativa. (2008) 18, 571–584.
DOI
10.1101/gr.6897308
about
A circular representation of small RNA alignment frequency for 21-nt and 24-nt small RNAs along the length of each of the 12 nuclear Oryza sativa chromosomes (green), starting with the first chromosome at 12 o’clock. The yellow and orange consecutive rings represent degenerate alignments of 21-nt and 24-nt small RNAs, respectively, to the corresponding chromosomes. Small RNA alignments are nonuniform with hot spots of 24-nt sequences aligning to the heterochromatic regions, including most centromeres and some clusters of ribosomal RNA genes. The fractal trees conceptually represent our use of sequence-based hierarchical clustering and graph theory algorithms to identify novel microRNA families in Pinus contorta. (Cover illustration by Ryan Morin using Circos, fractal image created by Maia.)
publication
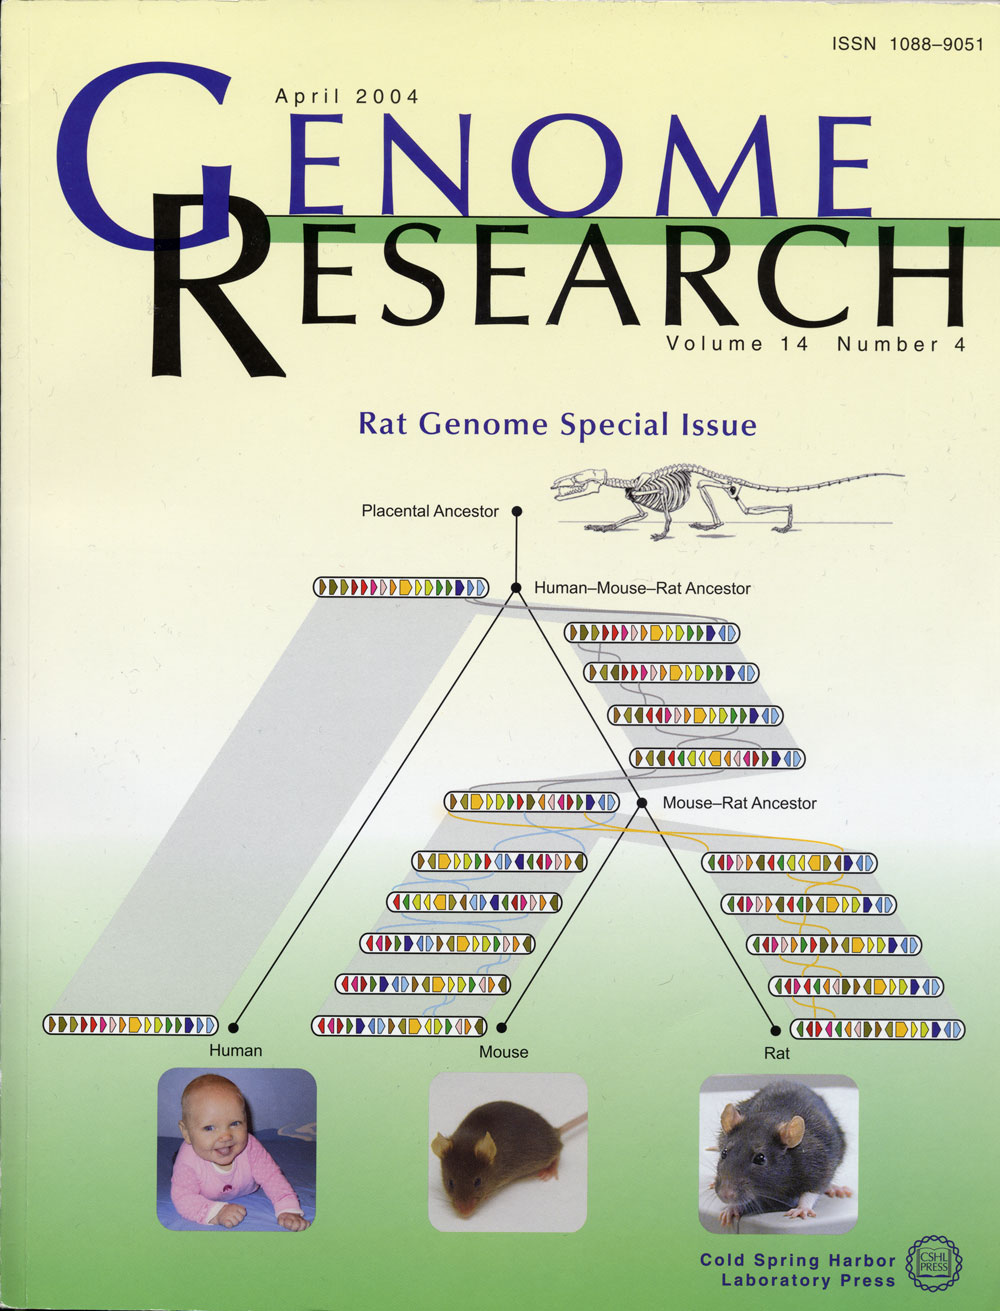
Genome Research
special issue
The Rat Genome special issue
issue
4
date
1 April 2004
about
Rearrangement history of the mammalian X chromosome in human, mouse, and rat lineages. The arrangement of the 16 human-mouse-rat large-scale orthologous segments (each containing at least 300,000 nucleotides) located on the X chromosome is shown for the human, mouse, and rat genomes. Possible arrangements of the last common ancestor of mouse and rat ("Mouse-Rat Ancestor") were computed from these. The computations prove that the arrangement shown is the only one that minimizes the number of inversions of these segments on the paths to it from human, mouse, and rat. A possible order of those inversions is illustrated, but the actual order will not be determined until future studies allow us to add more species to this tree. Previous studies found that the arrangement of markers in the human X chromosome was unchanged since before the "Human-Mouse-Rat Ancestor," and our use of outgroup data from dog, cat, and cow is consistent with this (although we cannot rule out the possibility that the second segment from the right in human was inverted on the human lineage). The drawings of creatures at the ancestral nodes are probably similar to the last common ancestors of the species indicated at the nodes. (For details, see Bourque et al., pp.507–516. ). The cover uses my photo of Alex, the world's most popular rat.
Martin Krzywinski | contact | Canada's Michael Smith Genome Sciences Centre ⊂ BC Cancer Research Center ⊂ BC Cancer ⊂ PHSA
{ 10.9.234.151 }