
Color proportions in country flags
contents
Country flags are pretty colorful and some are even pretty.
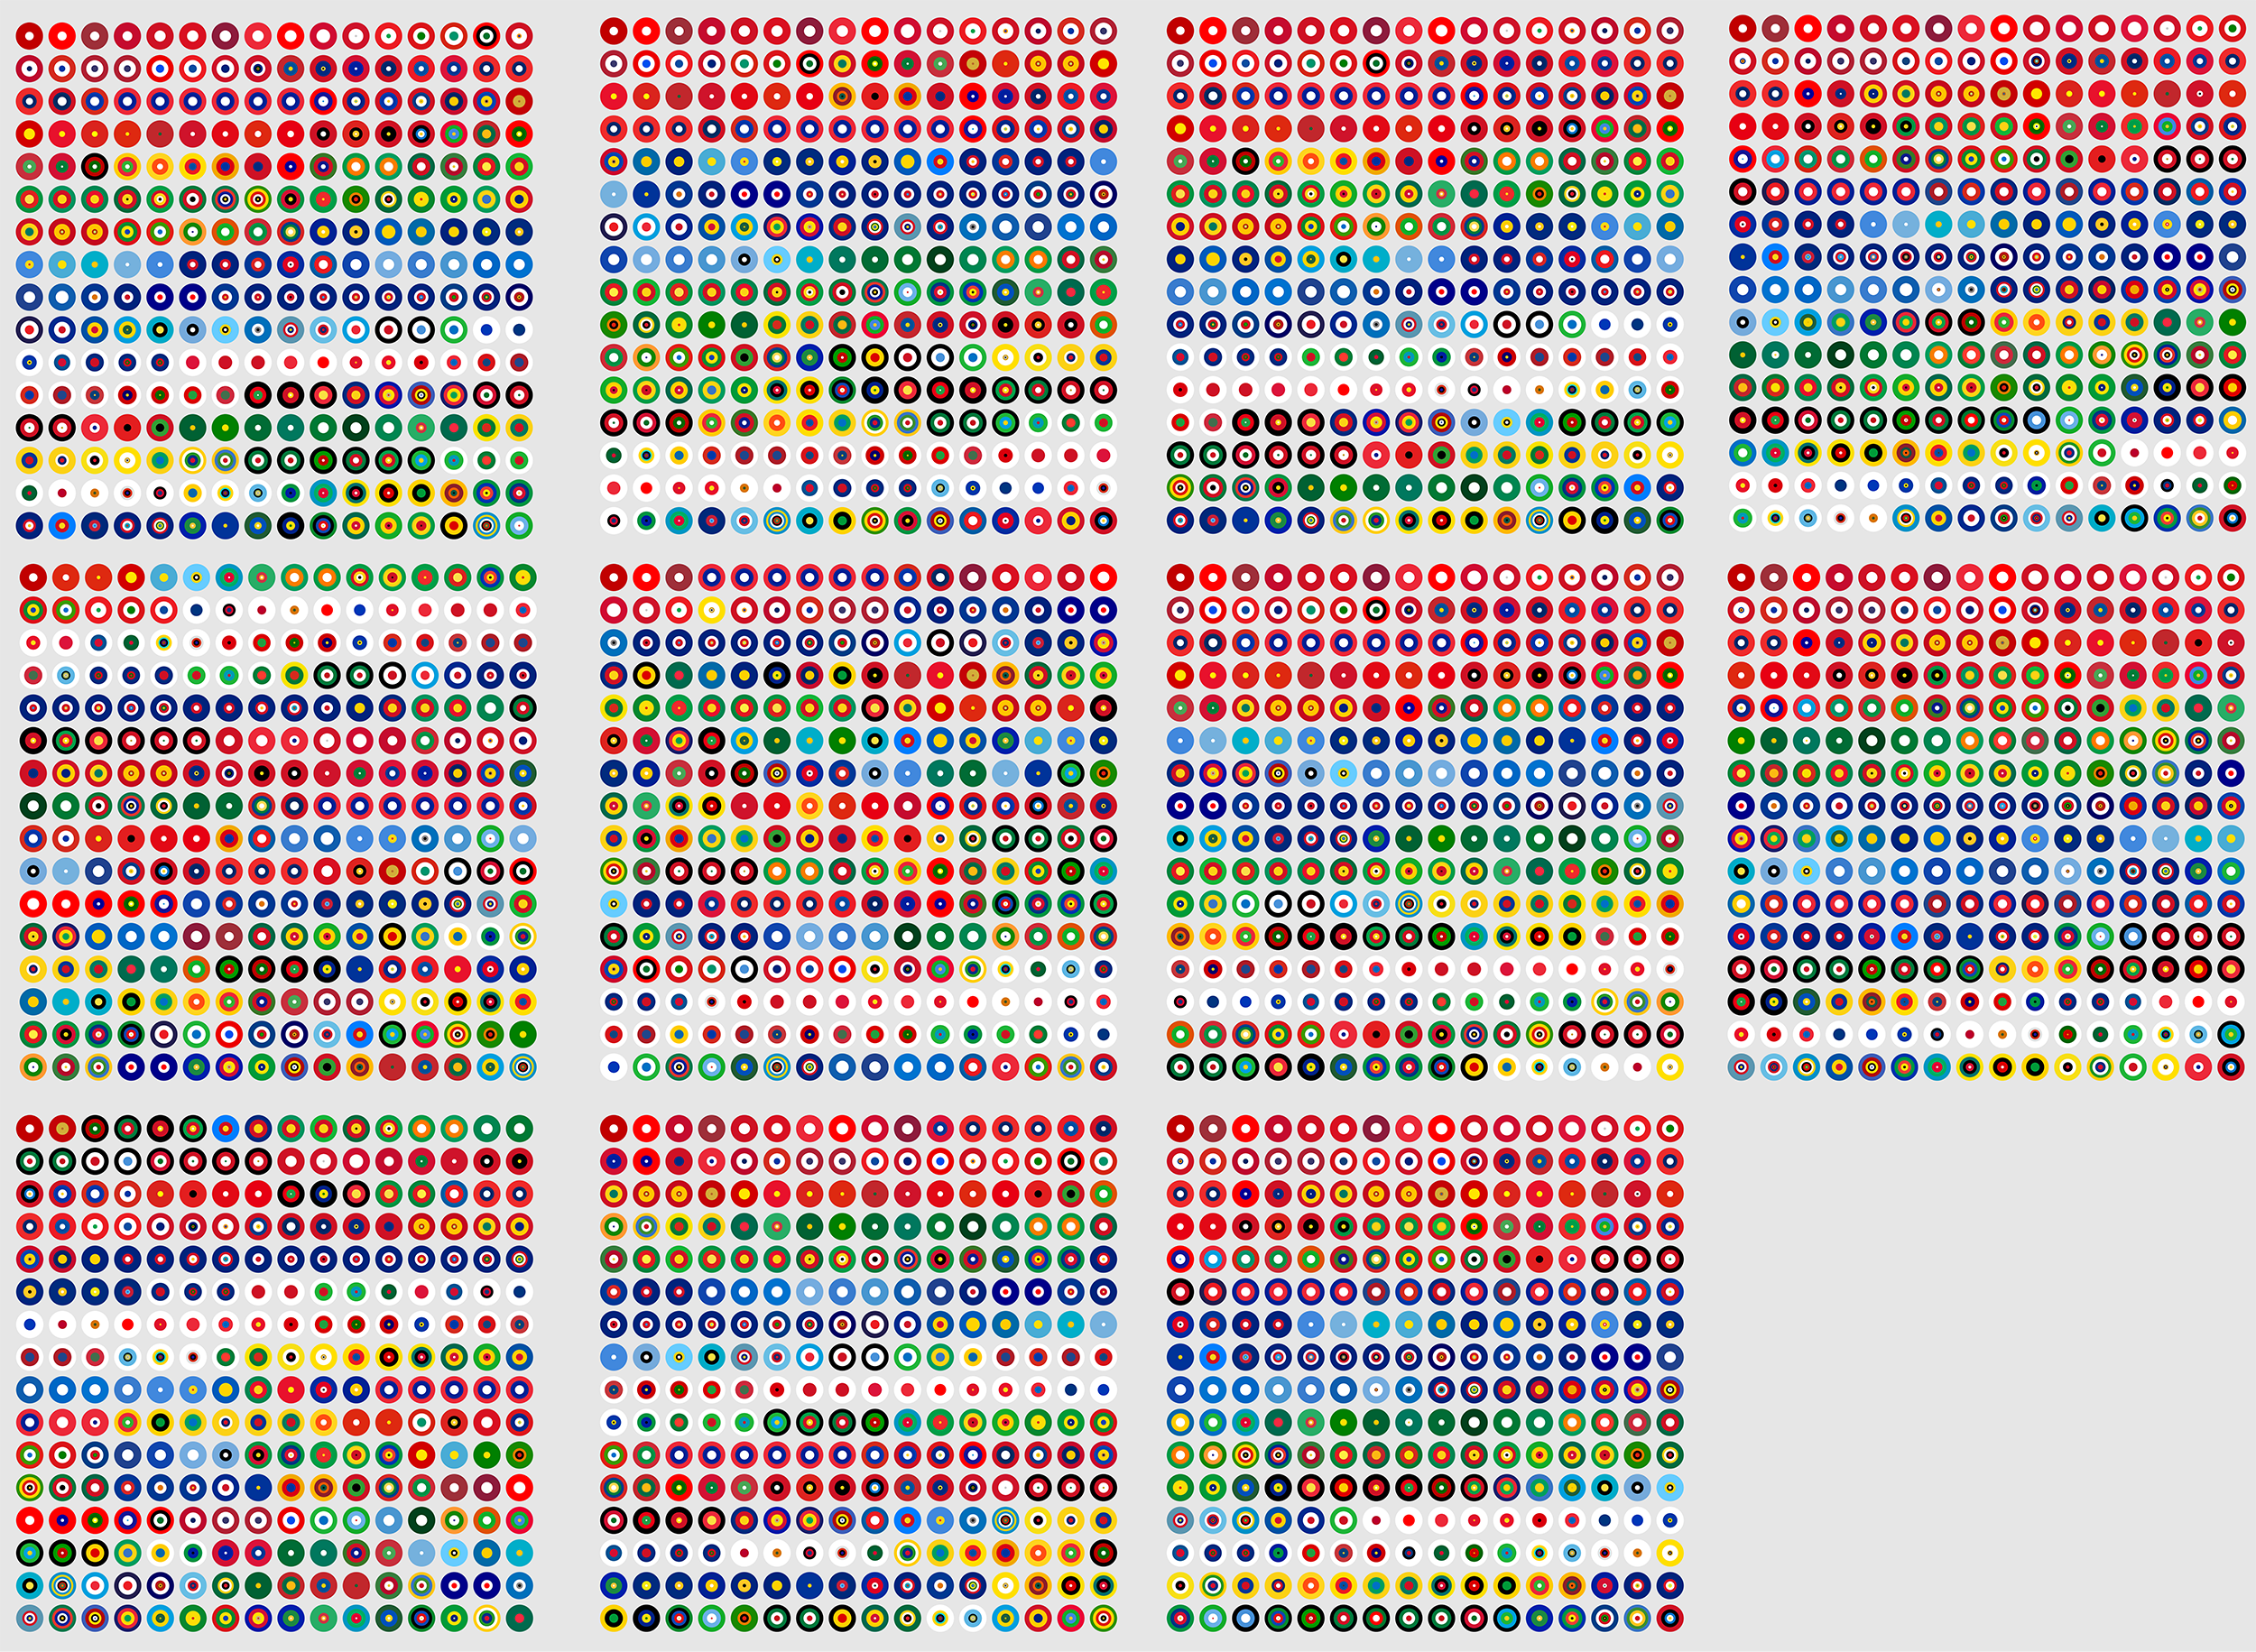
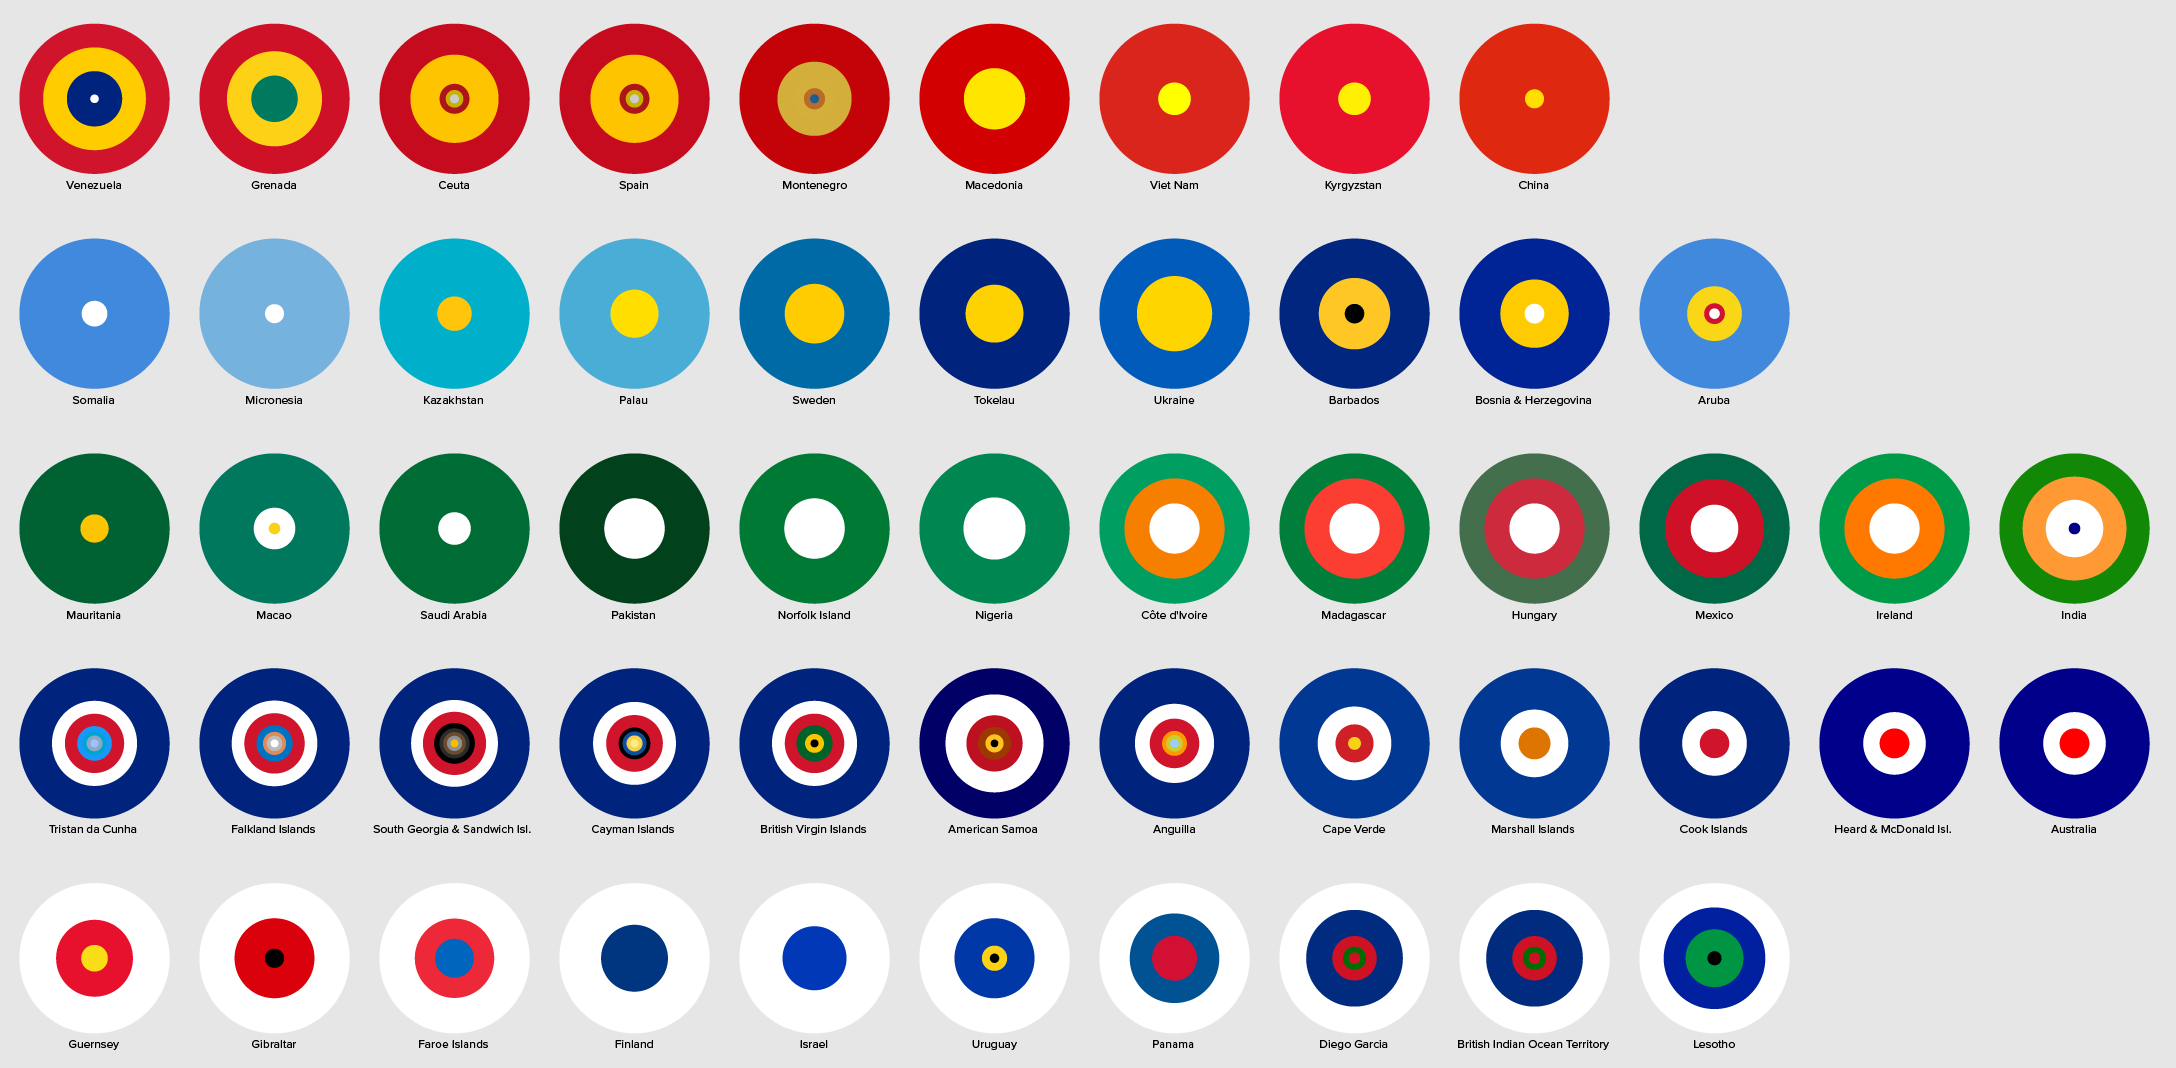
Instead of drawing the flag in a traditional way (yawn...), I wanted to draw it purely based on the color proportions in the flag (yay!). There are lots of ways to do this, such as stacked bars, but I decided to go with concentric circles. A few examples are shown below.
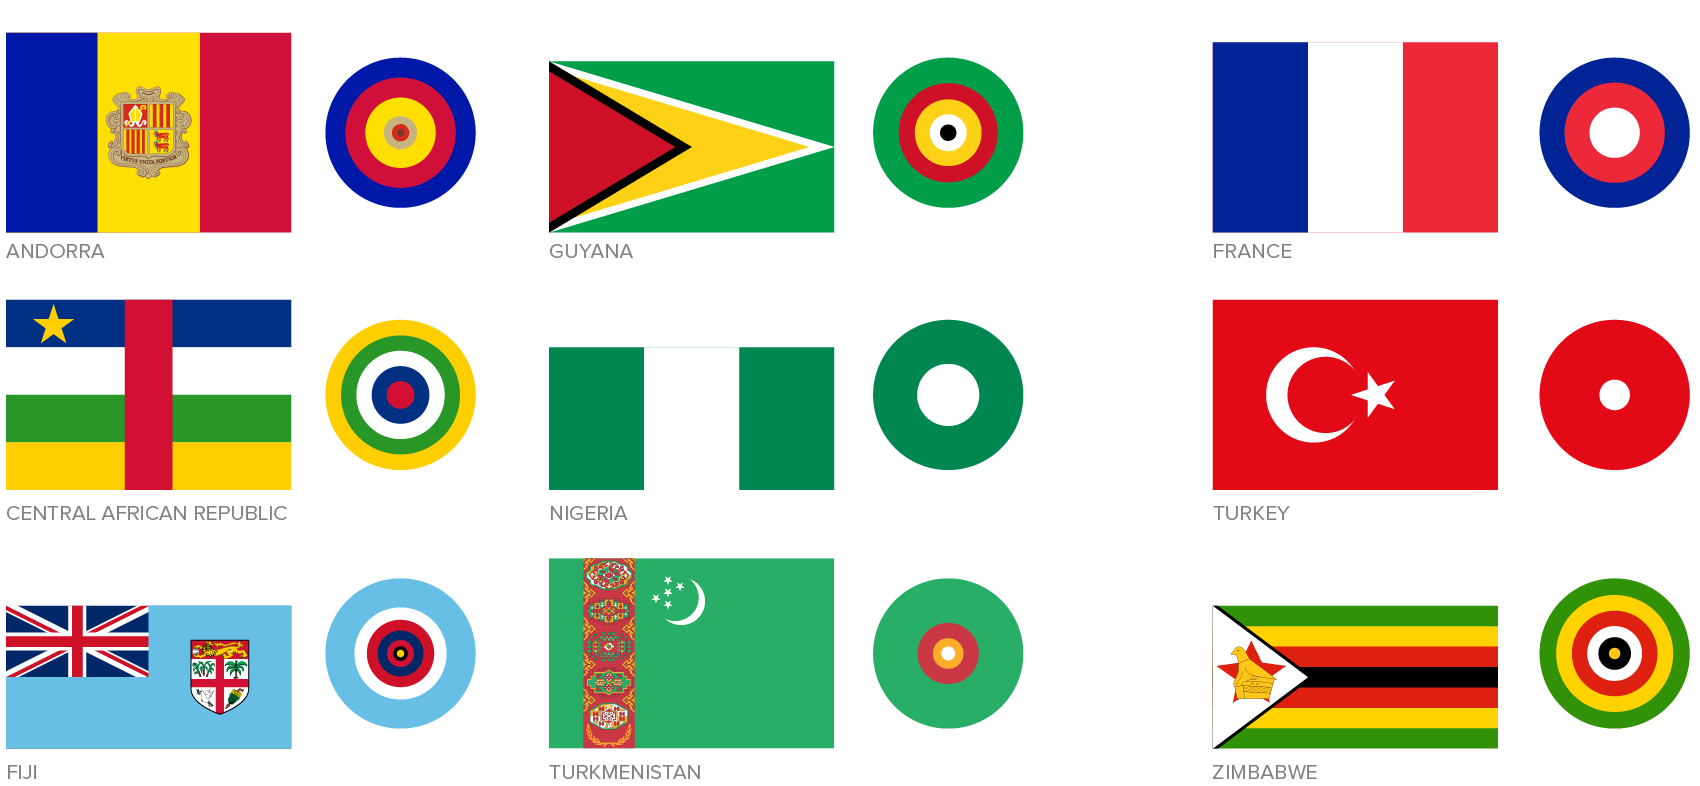
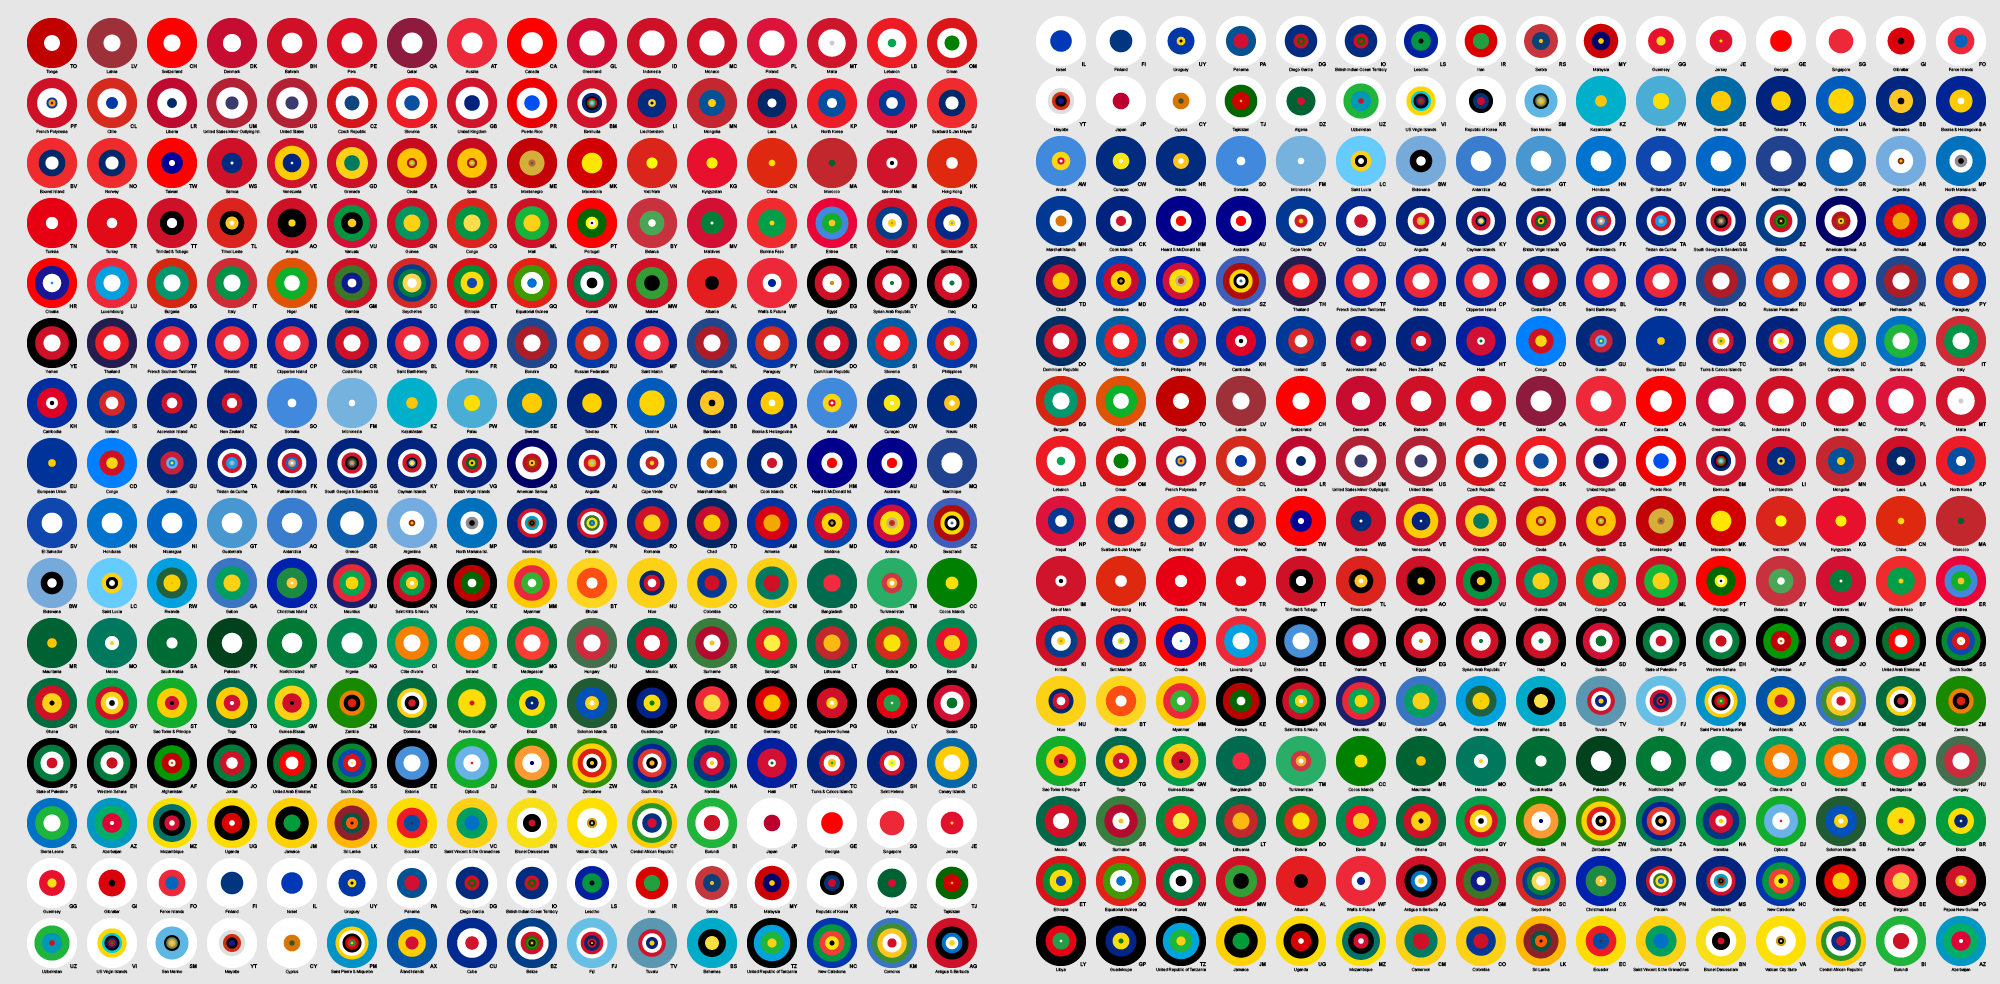
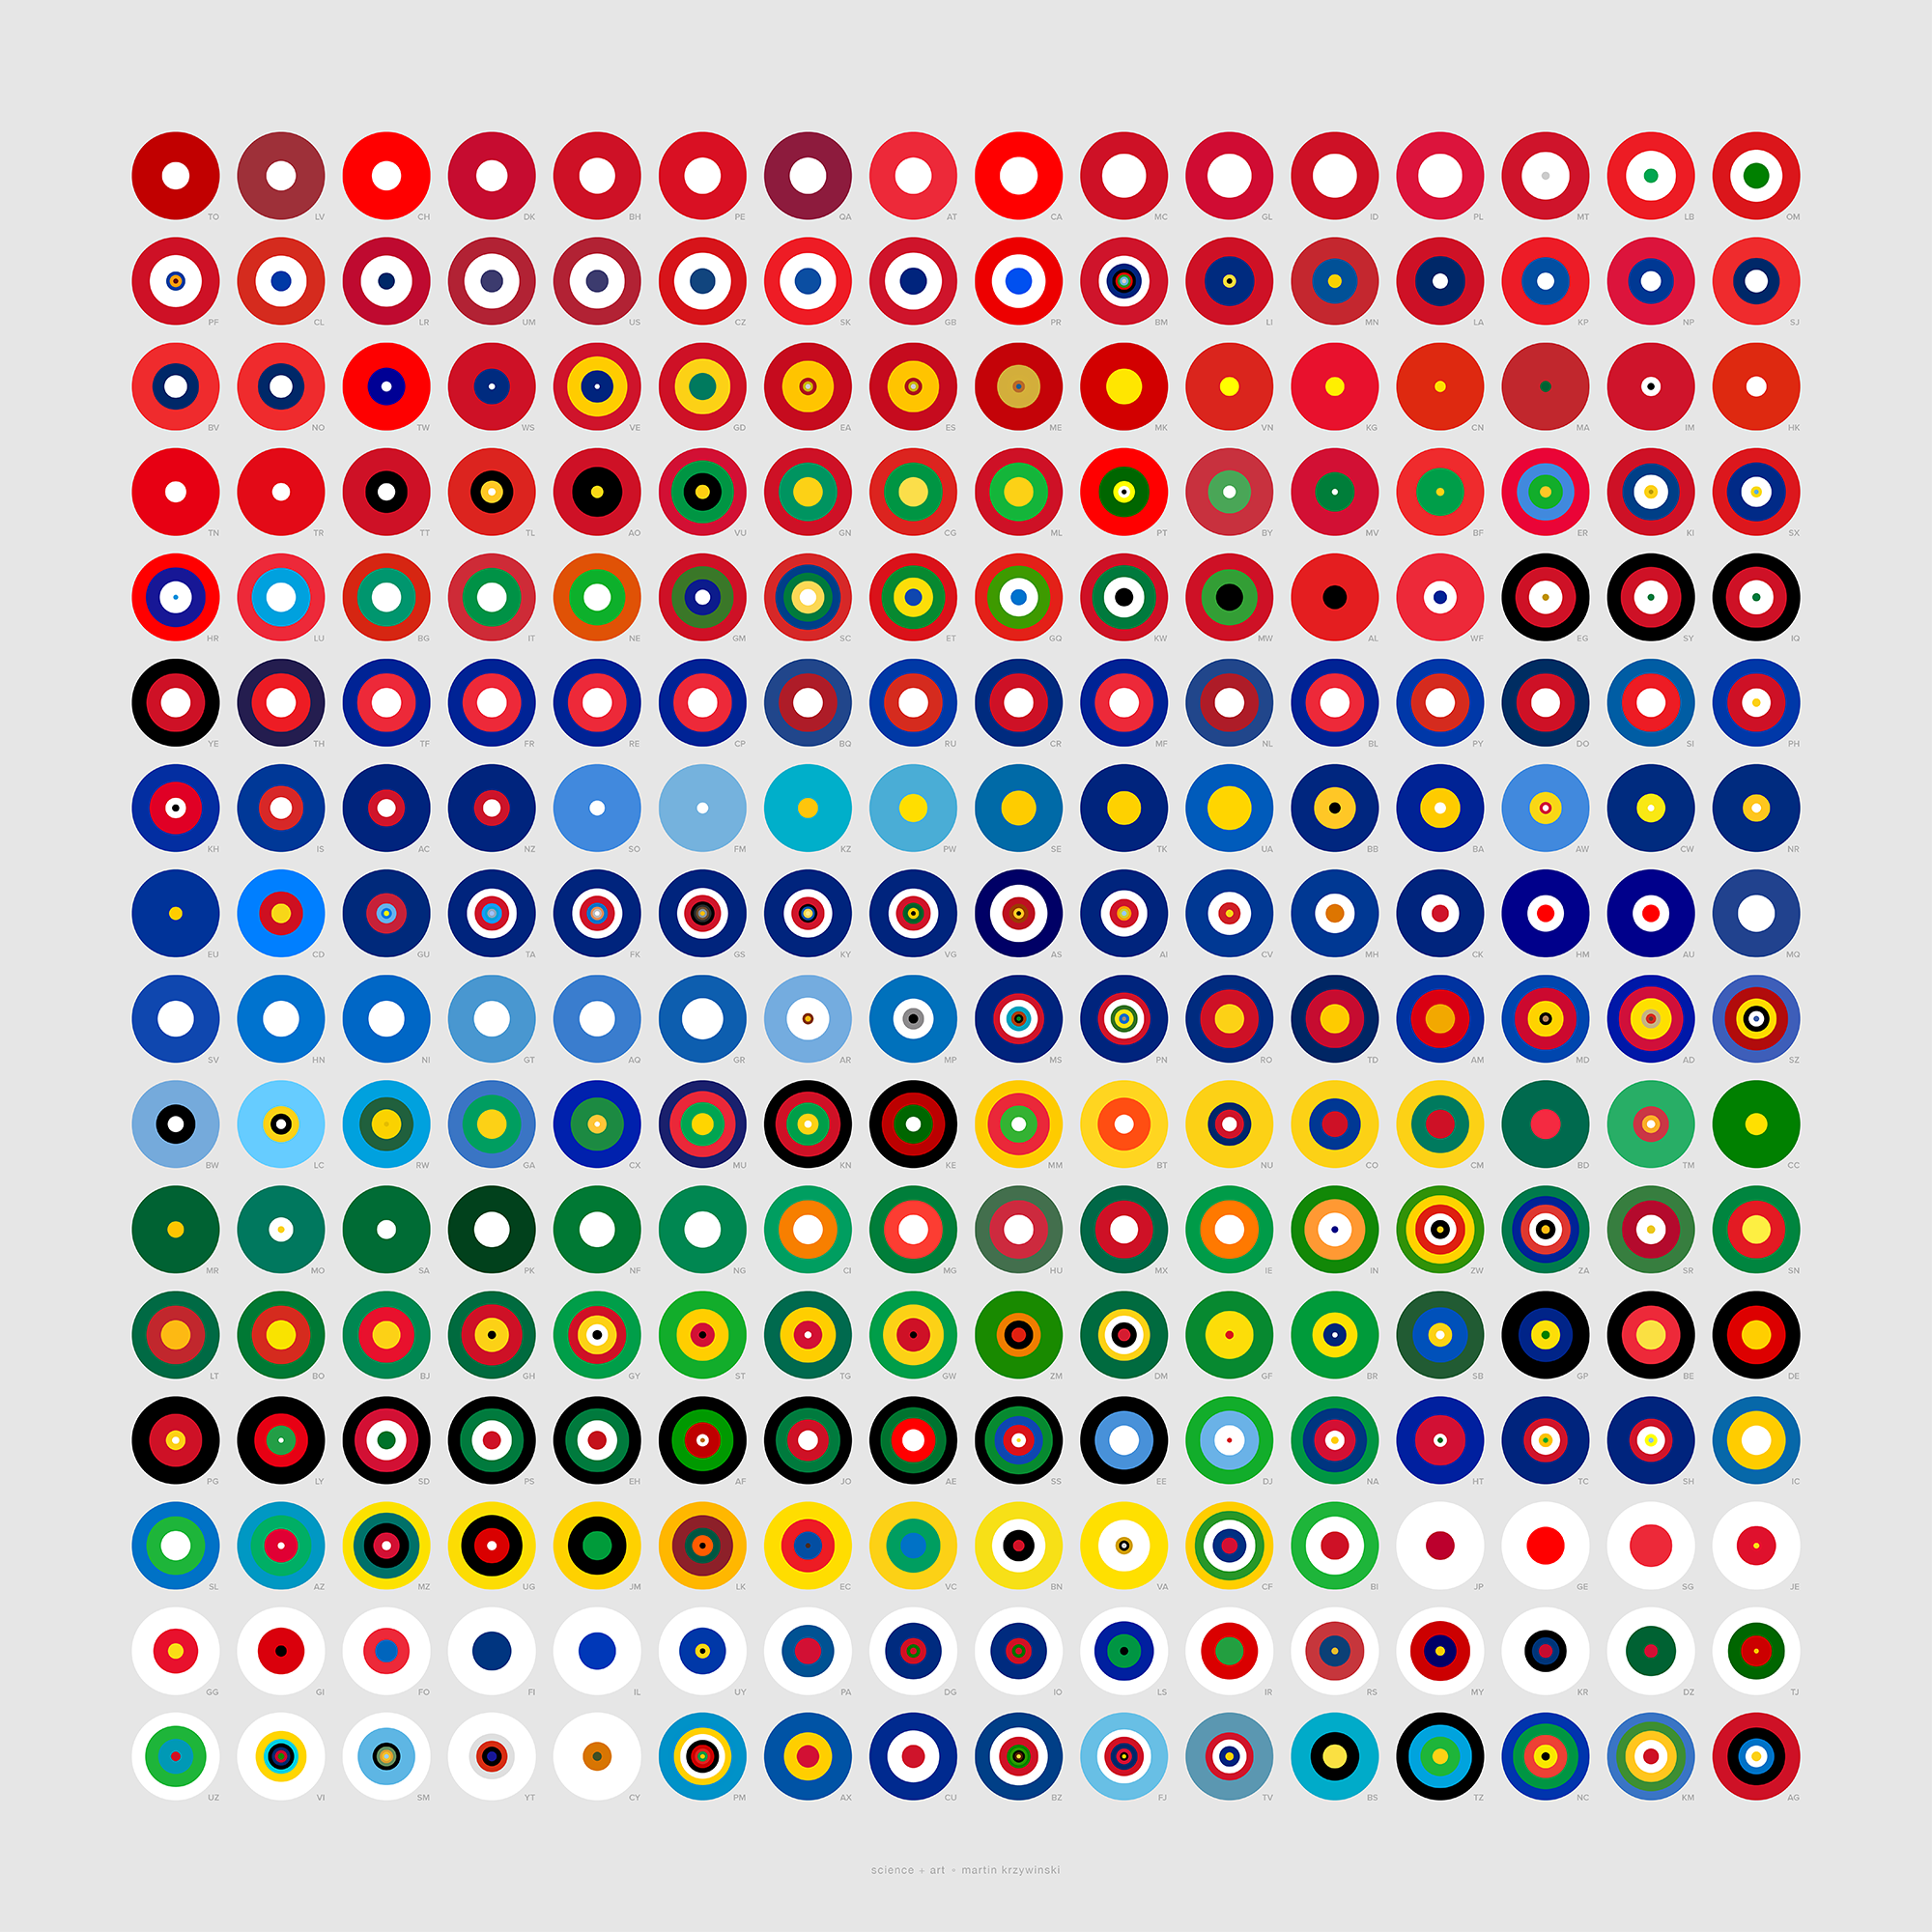
Once flags are drawn this way, they can be grouped by similarity in the color proportions.
Check out the posters or read about the method below.
Or, download my country flag color catalog to run your own analysis.
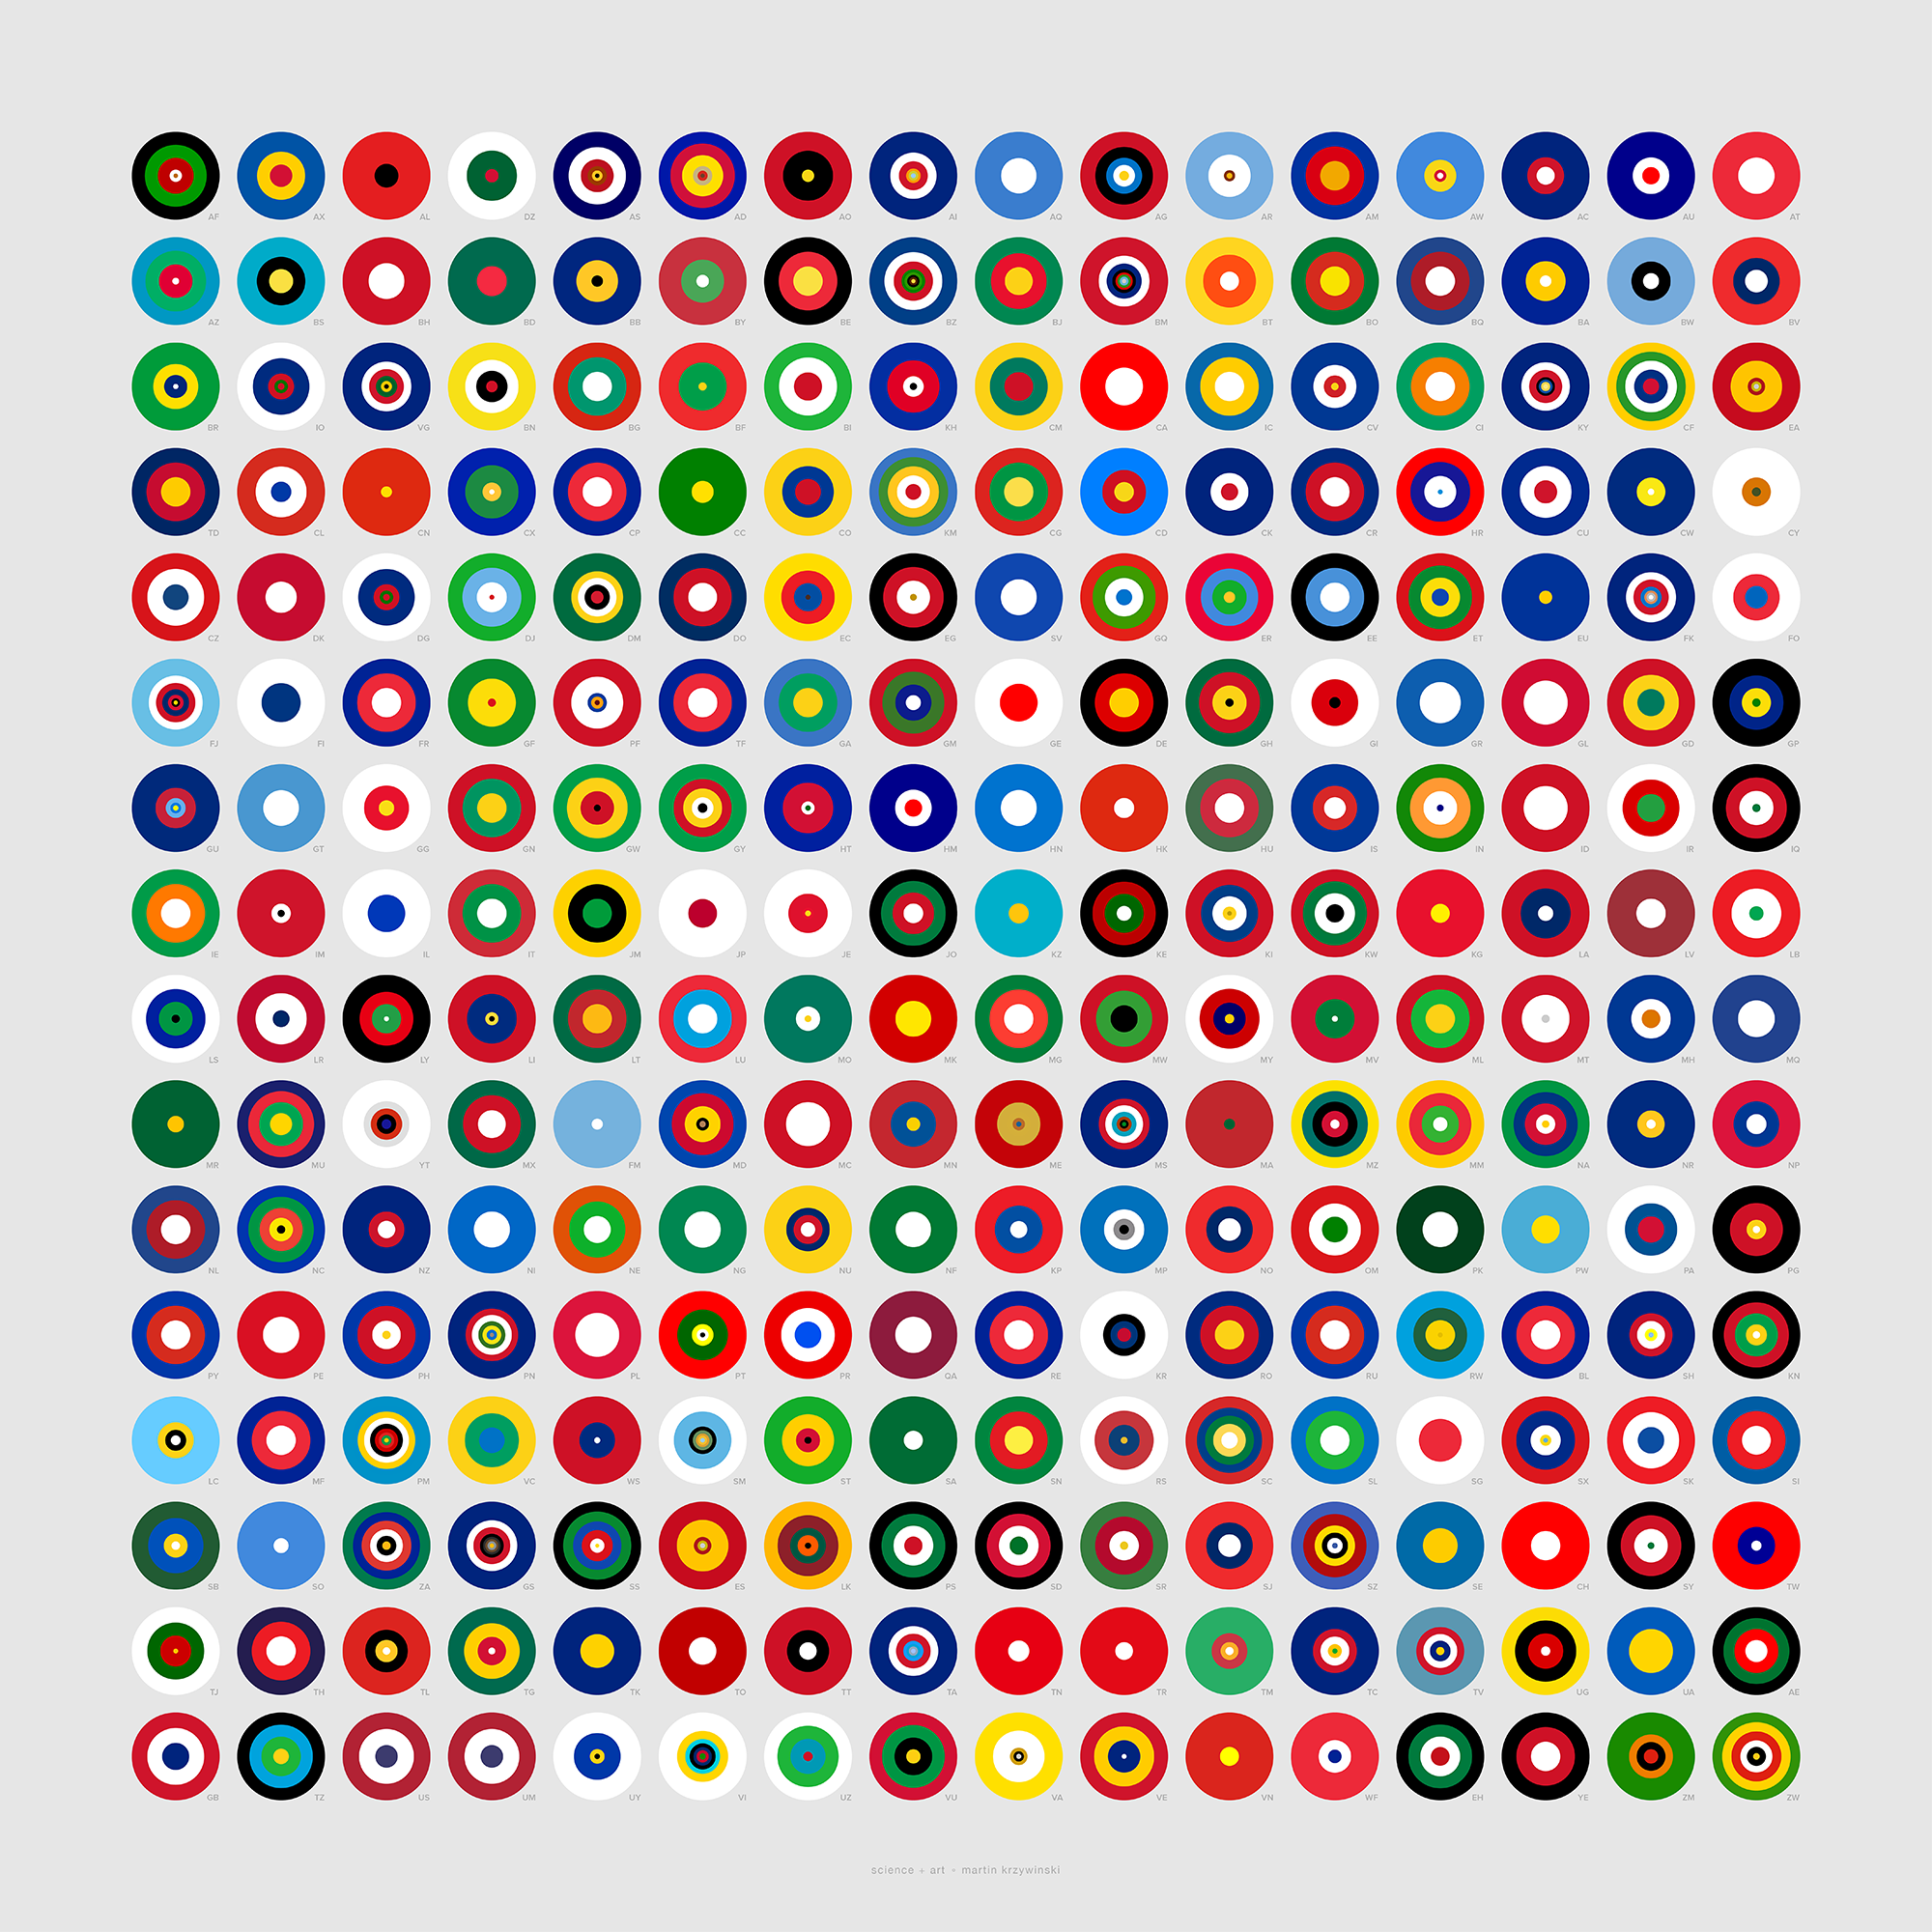
To determine the proportions of colors in each flag, I started with the collection of all country flags in SVG from Wikipedia. The flags are conveniently named using the countries' ISO 3166-2 code. At the time of this project (21 Mar 2017), this repository contained 312 flags, of which I used 256.
I originally wanted to use the flag-icon-css collection, but ran into problems with it. It had flags in only either 1 × 1 or 4 × 3 aspect ratio, which distorted and clipped many flags. Many flags were also inaccurately drawn and had inconsistent use of colors. For example, in Turkey's flag the red inside the white crescent was slightly different than elsewhere in the flag.
 buy artwork
I converted the SVG files to high resolution PNG (2,560 pixels in width) and sampled the colors in each flag, keeping only those colors that occupied at least 0.01% of the flag. I apply this cutoff to avoid blends between colors due to anti-aliasing applied in the conversion. When drawing the flags as circles, I only use colors that occupy at least 1% of the flag—this impacts flags that have detailed emblems, such as Belize. I apply some rounding off of the proportions and colors with the same proportion are ordered so that lighter colors (by Lab luminance) are in the center of the circle.
There are various ways to represent the proportions of the flag colors as concentric rings—in other words, to use symbols of different size to encode area.
The accurate way is to have the area of the ring be proportional to the area of the color on the map. The inaccurate way is to encode the area by the the width of the ring. These two cases are the `k=0.5` and `k=1` columns in the figure below, where `k` is the power in `r = a^k` by which the radius of the ring, `r`, is scaled relative to the area, `a`. A perceptual mapping using `k=0.57` has been suggested by some.
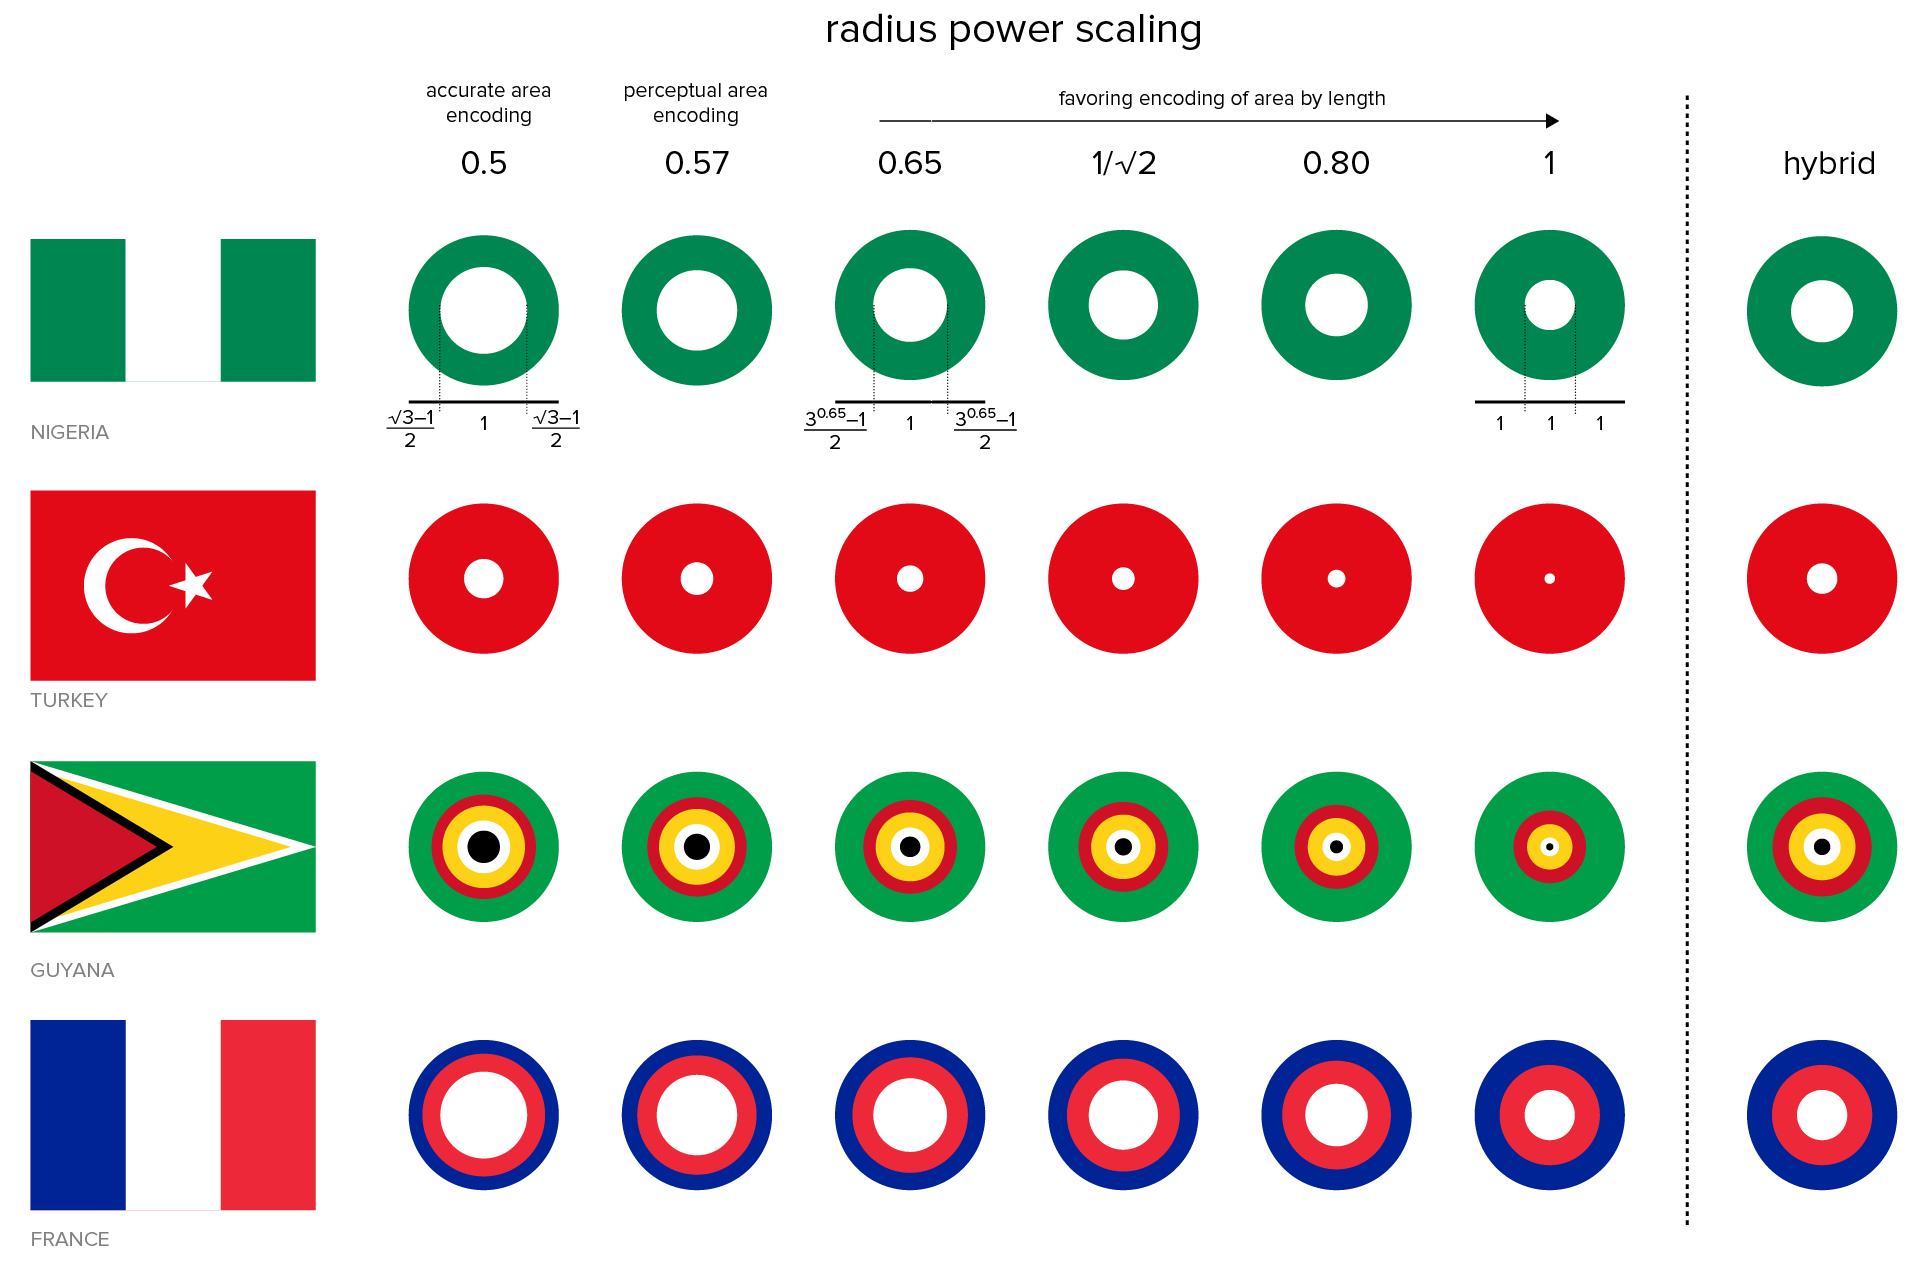
My goal here is not to encode the proportions so that they can be read off quantitatively. To find a value of `k`, I drew some flags and looked at their concentric ring representation. For example, with `k=0.57` the Nigerian flag's white center is too large for my eye while for `k=1` it is definitely too small. I liked the proportions for `k=1/\sqrt{2}` but wasn't happy with the fact that flags like France's, which have colors in equal areas, didn't have equal width rings.
In the end I decided on a hybrid approach in which the out radius of color `i` whose area is `a_i` is `r_i = a_i^k + \sum_{j=0}^{i-1} a_j^k` where the colors are sorted so that `a_{i-1} \le a_i`. If I use `k=0.25`, I manage to have flags like France have equal width rings but flags like Nigeria in which the proportions are not equal are closer to the encoding with `k=1/\sqrt{2}`. In this hybrid approach smaller areas, such as the white in the map of Turkey, are exaggerated. Notice that here `k` plays a slightly different role—it's used as the power for each color individually, `\sum a^k`, rather than their sum, `\left({\sum a}\right)^k`.
For the purists this choice of encoding might appear as the crime of the worst sort, representing neither correct (`k=0.5`) nor the conventionally incorrect encoding associated with `k=1`. Think of it this way—I know what rule I'm breaking.
The similarity between two flags is calculated by forming an intersection between the radii positions of the concentric rings of the flags.
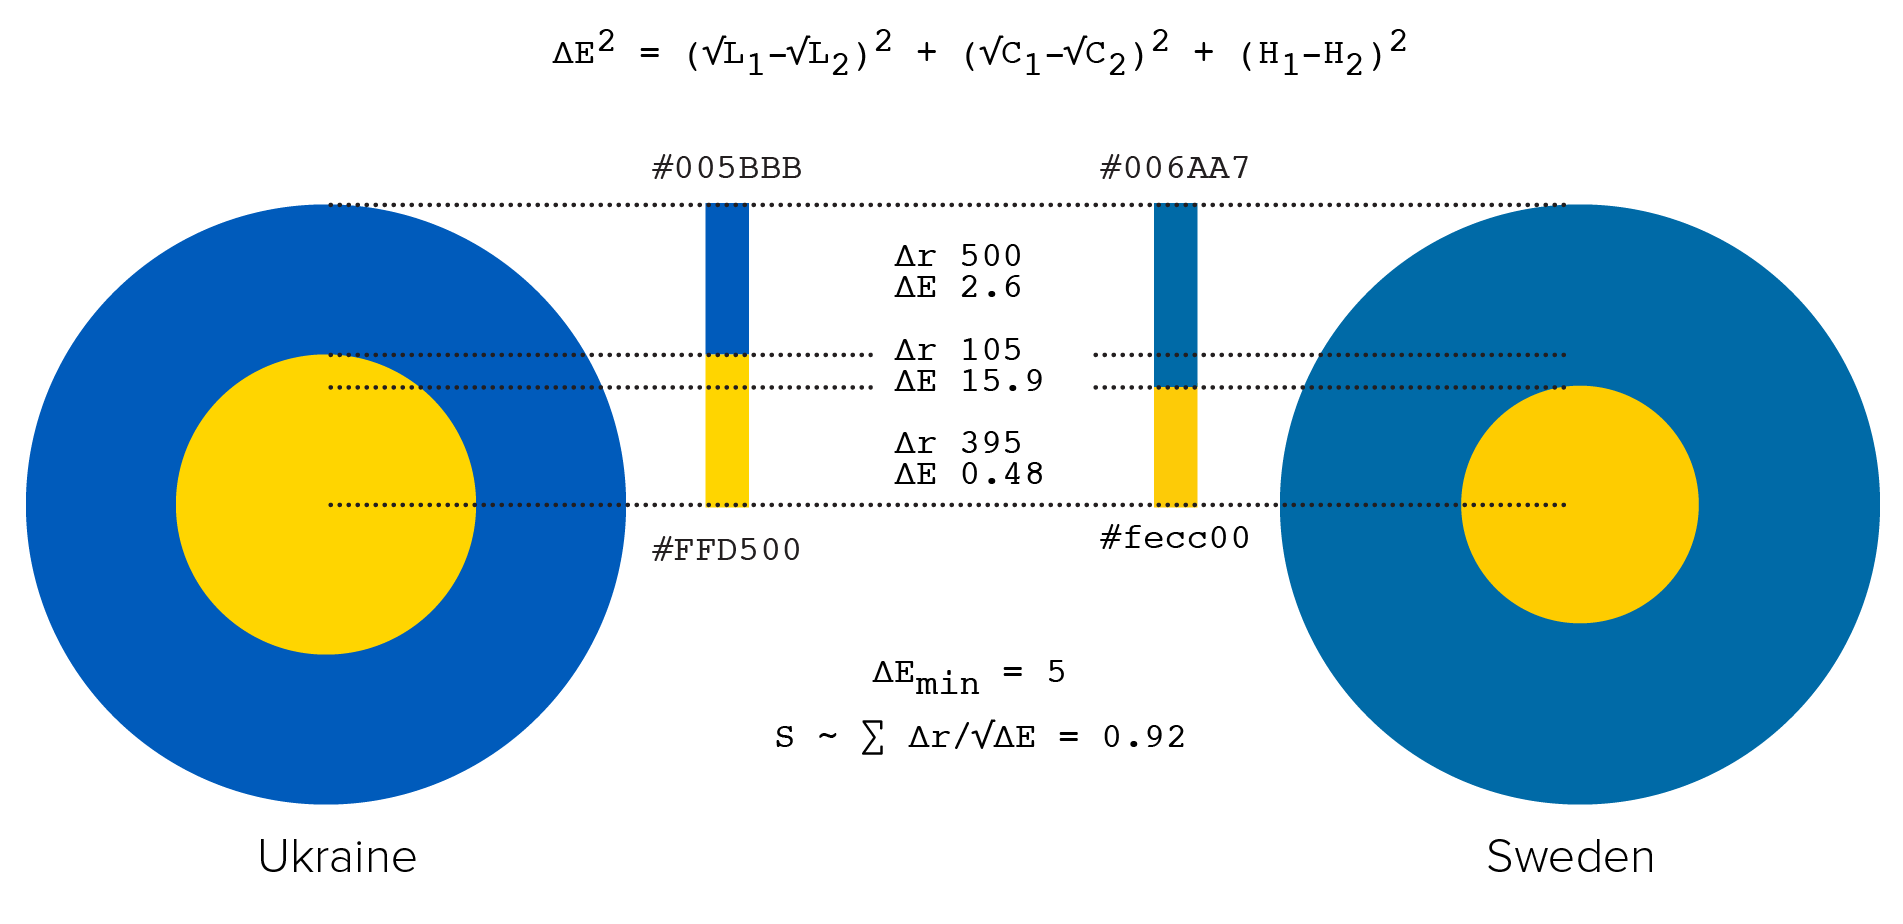
For each intersection, the similarity of colors is determined using `\Delta E`, which is the Euclidian distance of the colors in LCH space. I placed less emphasis on luminance and chroma in the similarity calculation by fist transforming the coordinates to `(\sqrt L,\sqrt C, H)`) before calculating color differences. The similarity score is $$ S = \sum \frac{\Delta r}{\sqrt{\Delta E}} $$
Color pairs with `\Delta E < \Delta E_{min} = 5` are considered the same and have an effective `\Delta E = 1`.
I explored different cutoffs and combinations of transforming the color coordinates. This process was informed based on how the order of the flags looked to me.
I decided to start the order with Tonga, since it had the highest average similarity score to all other flags in some of my trials. The flag that is most different from other flags, as measured by the average similarity score, is Israel.
 buy artwork
I couldn't find a list of colors in the flags of countries, so I provide my analysis here. Every country's SVG flag was converted into a 2,560 × 1,920 PNG file (4,915,200 pixels). Colors that occupied at least 0.01% of the pixels are listed in their HEX format, followed by the number of pixels they occupy. The fraction of the flag covered by sampled colors is also shown.
DOWNLOAD

#code img_pixels sampled_pixels fraction_sampled_pixels hex:pixels,hex:pixels,...
...
cm 4366506 4364514 0.999544 FCD116:1513103,007A5E:1456071,CE1126:1395340
cn 4369920 4364756 0.998818 DE2910:4260992,FFDE00:103764
co 4364800 4364800 1.000000 FCD116:2183680,003893:1090560,CE1126:1090560
...
DOWNLOAD

#code1 code2 similarity_score
ad ae 0.0108360578506763
ad af 0.0288161214840692
ad ag 0.0510922121861494
ad ai 0.42746294322472
...
zw ye 0.473278765746989
zw yt 0.238101673130705
zw za 0.810589244643825
zw zm 0.573265751850587
Nasa to send our human genome discs to the Moon
We'd like to say a ‘cosmic hello’: mathematics, culture, palaeontology, art and science, and ... human genomes.


Comparing classifier performance with baselines
All animals are equal, but some animals are more equal than others. —George Orwell
This month, we will illustrate the importance of establishing a baseline performance level.
Baselines are typically generated independently for each dataset using very simple models. Their role is to set the minimum level of acceptable performance and help with comparing relative improvements in performance of other models.

Unfortunately, baselines are often overlooked and, in the presence of a class imbalance5, must be established with care.
Megahed, F.M, Chen, Y-J., Jones-Farmer, A., Rigdon, S.E., Krzywinski, M. & Altman, N. (2024) Points of significance: Comparing classifier performance with baselines. Nat. Methods 20.
Happy 2024 π Day—
sunflowers ho!
Celebrate π Day (March 14th) and dig into the digit garden. Let's grow something.

How Analyzing Cosmic Nothing Might Explain Everything
Huge empty areas of the universe called voids could help solve the greatest mysteries in the cosmos.
My graphic accompanying How Analyzing Cosmic Nothing Might Explain Everything in the January 2024 issue of Scientific American depicts the entire Universe in a two-page spread — full of nothing.

The graphic uses the latest data from SDSS 12 and is an update to my Superclusters and Voids poster.
Michael Lemonick (editor) explains on the graphic:
“Regions of relatively empty space called cosmic voids are everywhere in the universe, and scientists believe studying their size, shape and spread across the cosmos could help them understand dark matter, dark energy and other big mysteries.
To use voids in this way, astronomers must map these regions in detail—a project that is just beginning.
Shown here are voids discovered by the Sloan Digital Sky Survey (SDSS), along with a selection of 16 previously named voids. Scientists expect voids to be evenly distributed throughout space—the lack of voids in some regions on the globe simply reflects SDSS’s sky coverage.”
voids
Sofia Contarini, Alice Pisani, Nico Hamaus, Federico Marulli Lauro Moscardini & Marco Baldi (2023) Cosmological Constraints from the BOSS DR12 Void Size Function Astrophysical Journal 953:46.
Nico Hamaus, Alice Pisani, Jin-Ah Choi, Guilhem Lavaux, Benjamin D. Wandelt & Jochen Weller (2020) Journal of Cosmology and Astroparticle Physics 2020:023.
Sloan Digital Sky Survey Data Release 12
Alan MacRobert (Sky & Telescope), Paulina Rowicka/Martin Krzywinski (revisions & Microscopium)
Hoffleit & Warren Jr. (1991) The Bright Star Catalog, 5th Revised Edition (Preliminary Version).
H0 = 67.4 km/(Mpc·s), Ωm = 0.315, Ωv = 0.685. Planck collaboration Planck 2018 results. VI. Cosmological parameters (2018).
constellation figures
stars
cosmology
Error in predictor variables
It is the mark of an educated mind to rest satisfied with the degree of precision that the nature of the subject admits and not to seek exactness where only an approximation is possible. —Aristotle
In regression, the predictors are (typically) assumed to have known values that are measured without error.
Practically, however, predictors are often measured with error. This has a profound (but predictable) effect on the estimates of relationships among variables – the so-called “error in variables” problem.

Error in measuring the predictors is often ignored. In this column, we discuss when ignoring this error is harmless and when it can lead to large bias that can leads us to miss important effects.
Altman, N. & Krzywinski, M. (2024) Points of significance: Error in predictor variables. Nat. Methods 20.
Background reading
Altman, N. & Krzywinski, M. (2015) Points of significance: Simple linear regression. Nat. Methods 12:999–1000.
Lever, J., Krzywinski, M. & Altman, N. (2016) Points of significance: Logistic regression. Nat. Methods 13:541–542 (2016).
Das, K., Krzywinski, M. & Altman, N. (2019) Points of significance: Quantile regression. Nat. Methods 16:451–452.
Convolutional neural networks
Nature uses only the longest threads to weave her patterns, so that each small piece of her fabric reveals the organization of the entire tapestry. – Richard Feynman
Following up on our Neural network primer column, this month we explore a different kind of network architecture: a convolutional network.
The convolutional network replaces the hidden layer of a fully connected network (FCN) with one or more filters (a kind of neuron that looks at the input within a narrow window).

Even through convolutional networks have far fewer neurons that an FCN, they can perform substantially better for certain kinds of problems, such as sequence motif detection.
Derry, A., Krzywinski, M & Altman, N. (2023) Points of significance: Convolutional neural networks. Nature Methods 20:1269–1270.
Background reading
Derry, A., Krzywinski, M. & Altman, N. (2023) Points of significance: Neural network primer. Nature Methods 20:165–167.
Lever, J., Krzywinski, M. & Altman, N. (2016) Points of significance: Logistic regression. Nature Methods 13:541–542.