Designing for Color blindness
Color choices and transformations for deuteranopia and other afflictions
Here, I help you understand color blindness and describe a process by which you can make good color choices when designing for accessibility.
The opposite of color blindness is seeing all the colors and I can help you find 1,000 (or more) maximally distinct colors.
You can also delve into the mathematics behind the color blindness simulations and learn about copunctal points (the invisible color!) and lines of confusion.
In an audience of 8 men and 8 women, chances are 50% that at least one has some degree of color blindness1,2. When encoding information or designing content, use colors that is color-blind safe.
1About 8% of males and 0.5% of females are affected with some kind of color blindness in populations of European descent (wikipedia, Worldwide prevalence of red-green color deficiency, JOSAA). The rate for other races is lower Asians and Africans is lower (Caucasian Boys Show Highest Prevalence of Color Blindness Among Preschoolers, AAO).
2The probability that among `N=8` men and `N=8` women at least one person is affected by color blindness is `P(men,women) = P(8,8) = 1 - (1-0.08)^8(1-0.005)^8 = 0.51`. For `N=34` (i.e., 68 people in total), this probability is `P(34,34)=0.95`. Because the rate of color blindness in women is so low, for most groups of mixed gender we can approximate the probability by only counting the men. For example, in a group of 17 women the probability that at least one of them is color blind is `P(0,17) = 0.082`, which is the same probability as for 1 man, `P(1,0)`.
color receptors are reduced or absent in color blindness
The normal human eye is a 3-channel color detector3. There are three types of photoreceptors, each sensitive to a different part of the spectrum. Their combined response to a given wavelength produces a unique response that is the basis of the perception of color.
3Compared to hearing, the color vision is a primitive detector. While we can hear thousands of distinct frequencies and process them simultaneously, we have only three independent color inputs. While the ear can distinguish pure tones from complex sounds that have multiple frequencies the eye is relatively unsophisticated in separating a color sensation into its three constituent primary stimuli.
People with color blindness have one of the photo receptor groups either reduced in number or entirely missing. With only two groups of photoreceptors, the perception of hue is drastically altered.
For example, in deuteranopia, the most common type of color blindness, the medium (M) wavelength photoreceptors are reduced in number or missing. This results in the loss of perceived difference between reds and greens because only one group of photoreceptors (L) are sensitive to the wavelengths of these colors. The spectrum appears to be split into two hues along the blue-green boundary (see figure below), which is roughly where the photoreceptor sensitivities curves cross.
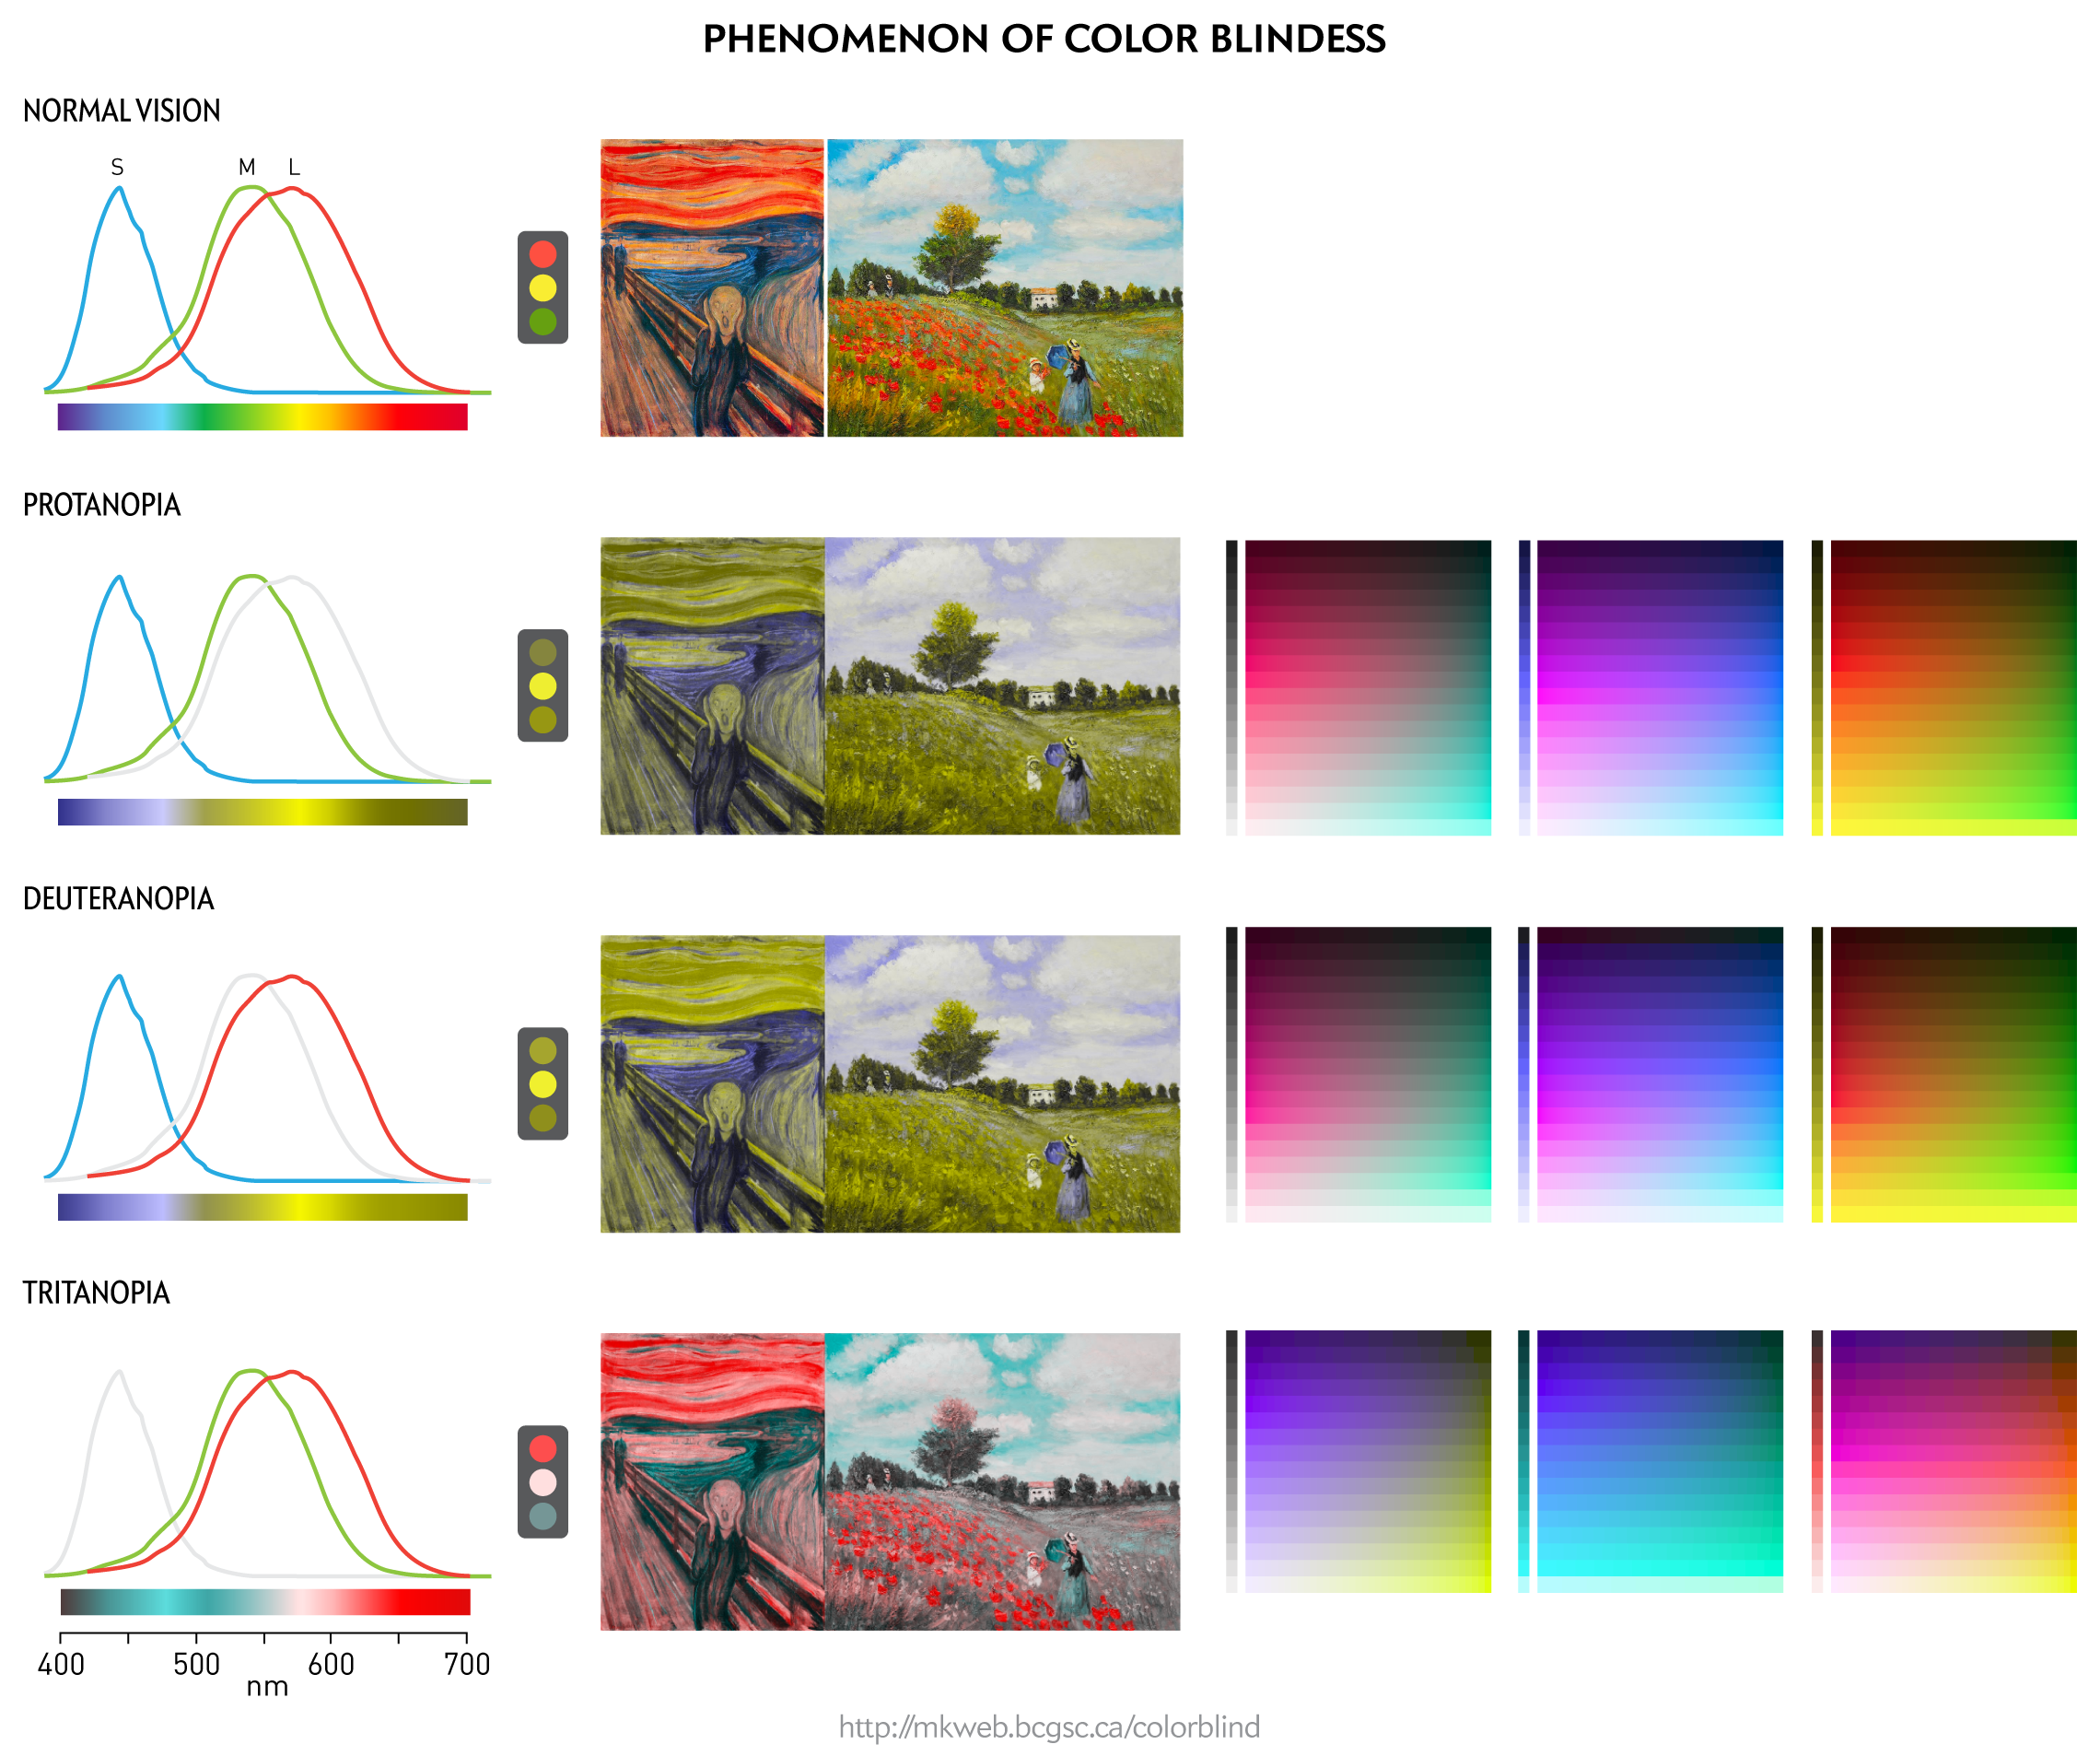
Visible light is in the range of 390–700 nm. The exact definition of the upper limit varies, with some sources giving as high as 760 nm. Shorter wavelengths are absorbed by the cornea (<295nm) and lens (315–390nm). Some near infrared light also reaches the retina (760–1,400nm).
it's all the same to me
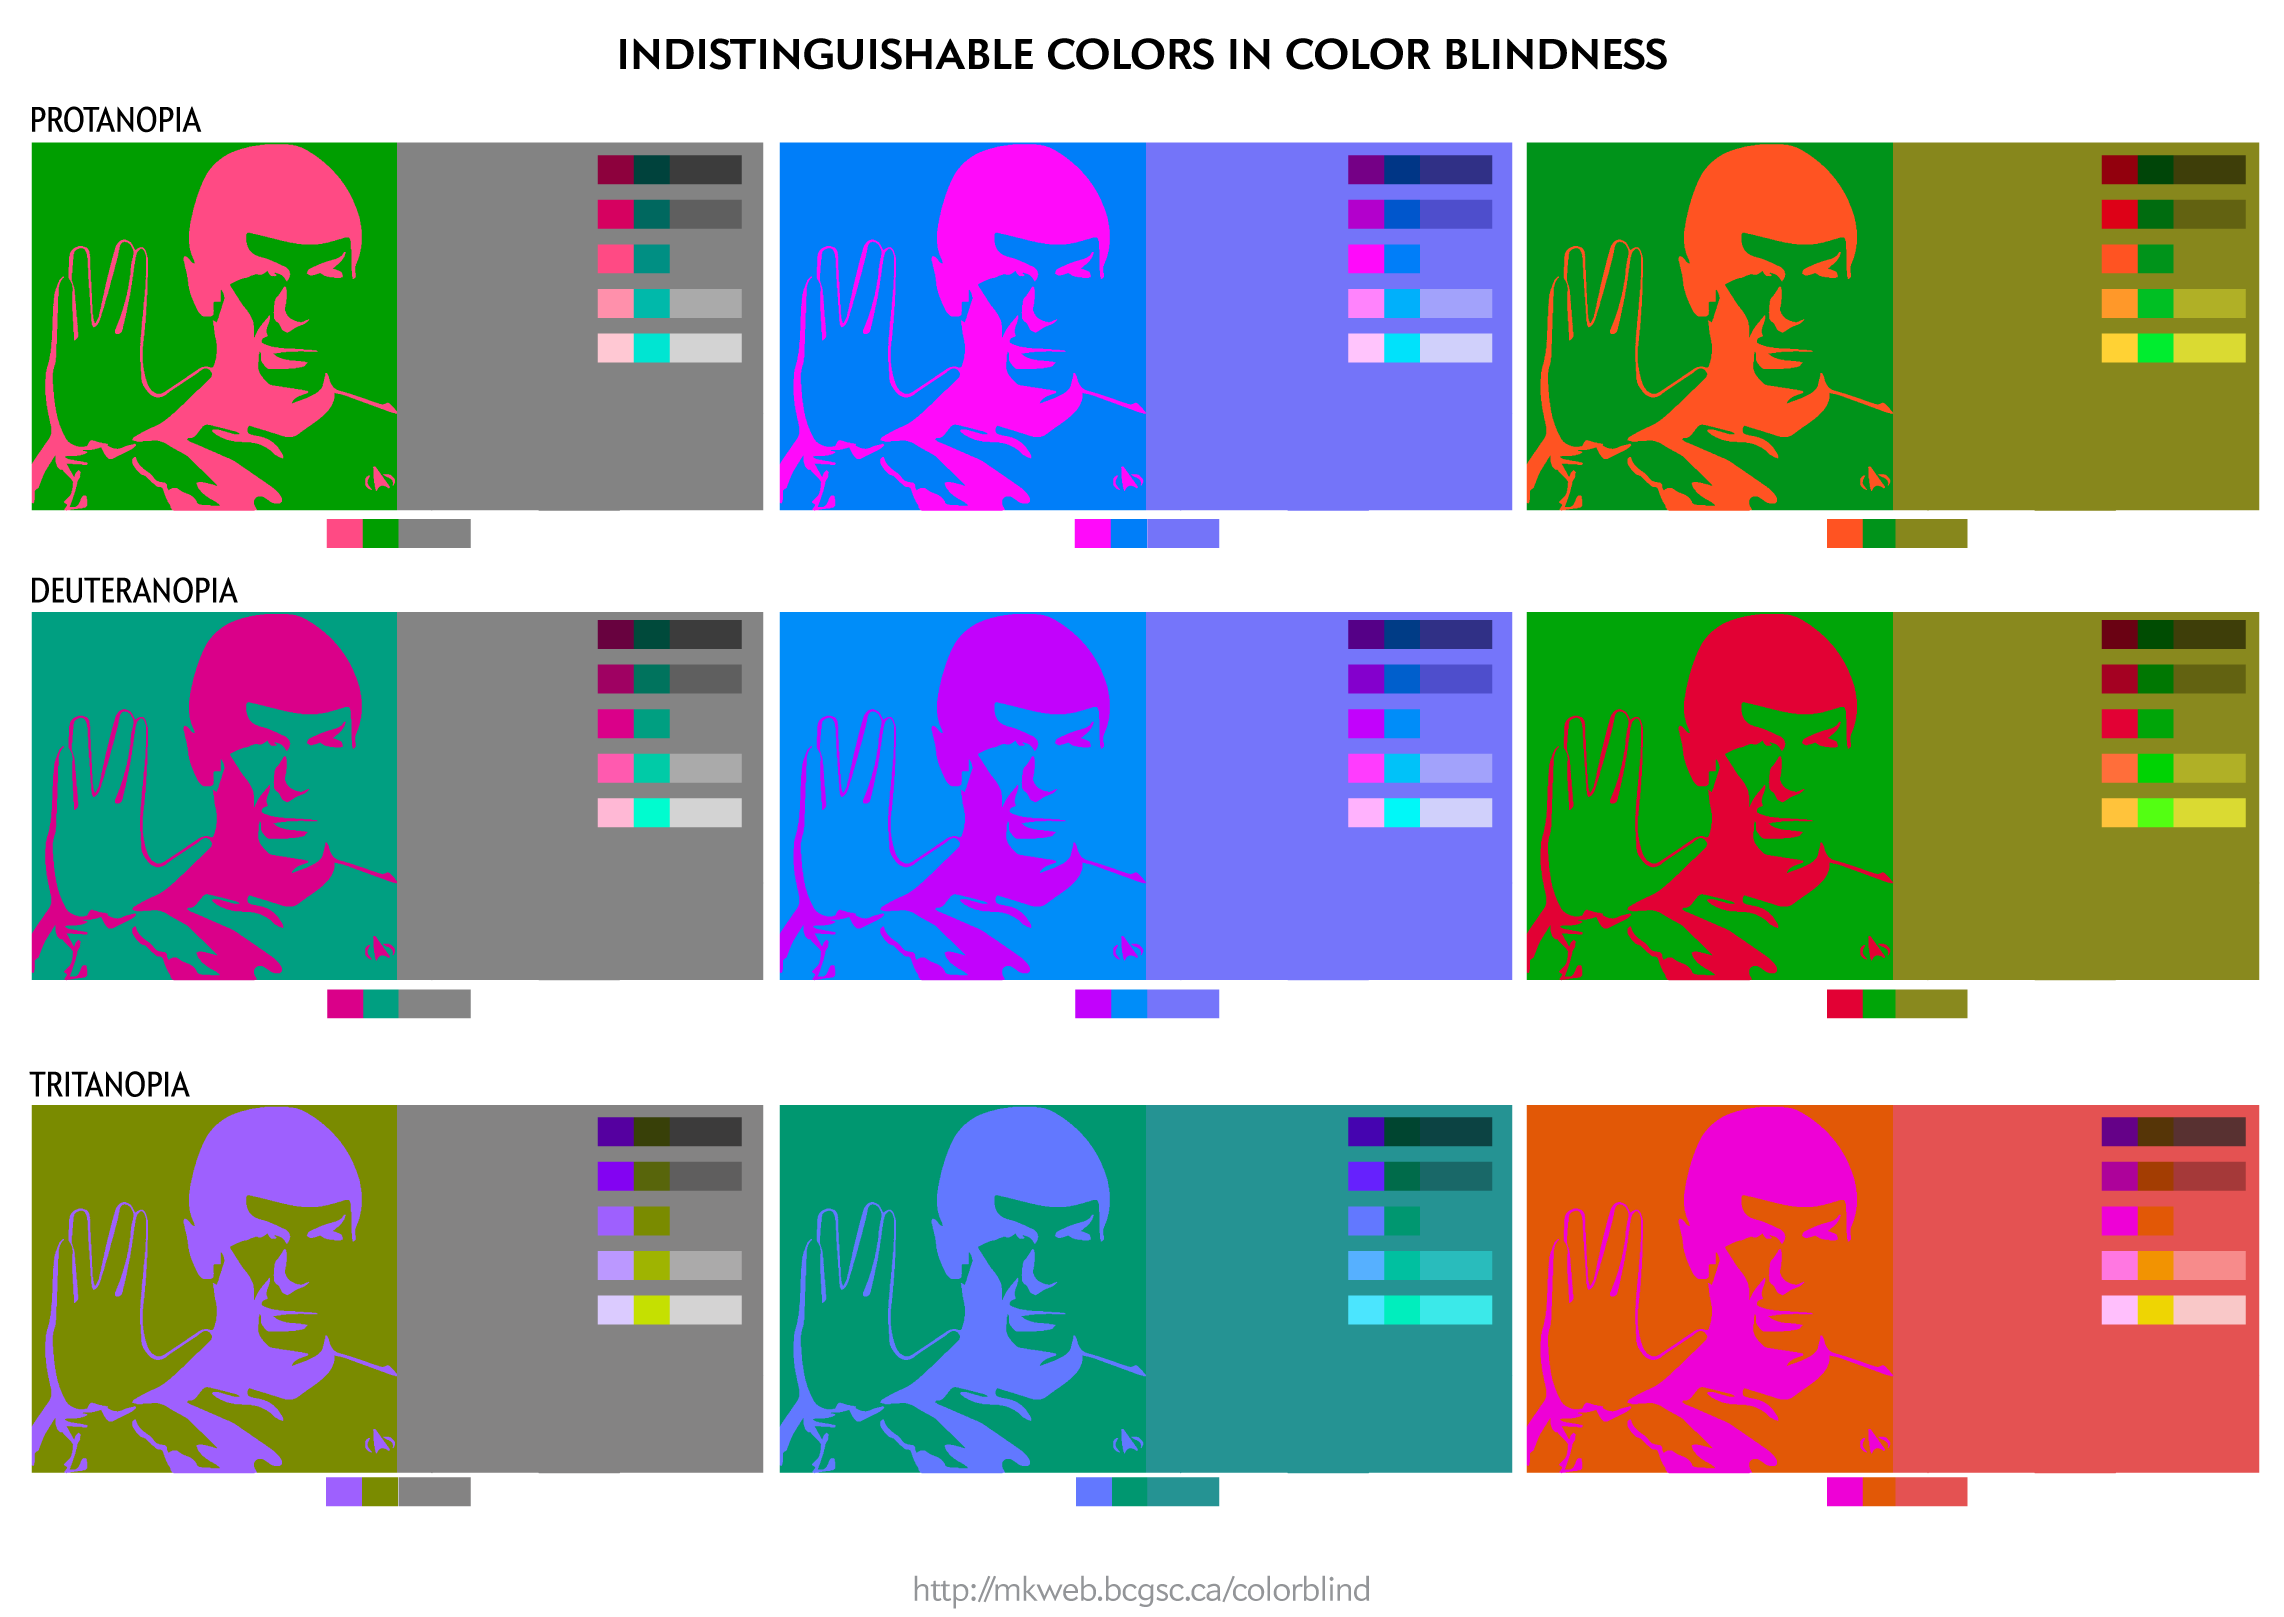
The Ishihara test is a color perception test for protanopia and deuteranopia. Think of the Rorschach test, except with a different diagnosis if you can't see a pattern.
Traditionally, the Ishihara test is performed with digits but why not use Mr. Spock4. He knows all the digits and is much more insteresting.
4In tribute to Leonard Nimoy, 1931–2015
simulating color blindness
Color blindness comes in varying degrees and types. Let's consider total deuternanopia—where the M receptors are missing or completely dysfunctional. Because they only have two kinds of color receptors, someone with this condition will see only two dimensions of color.
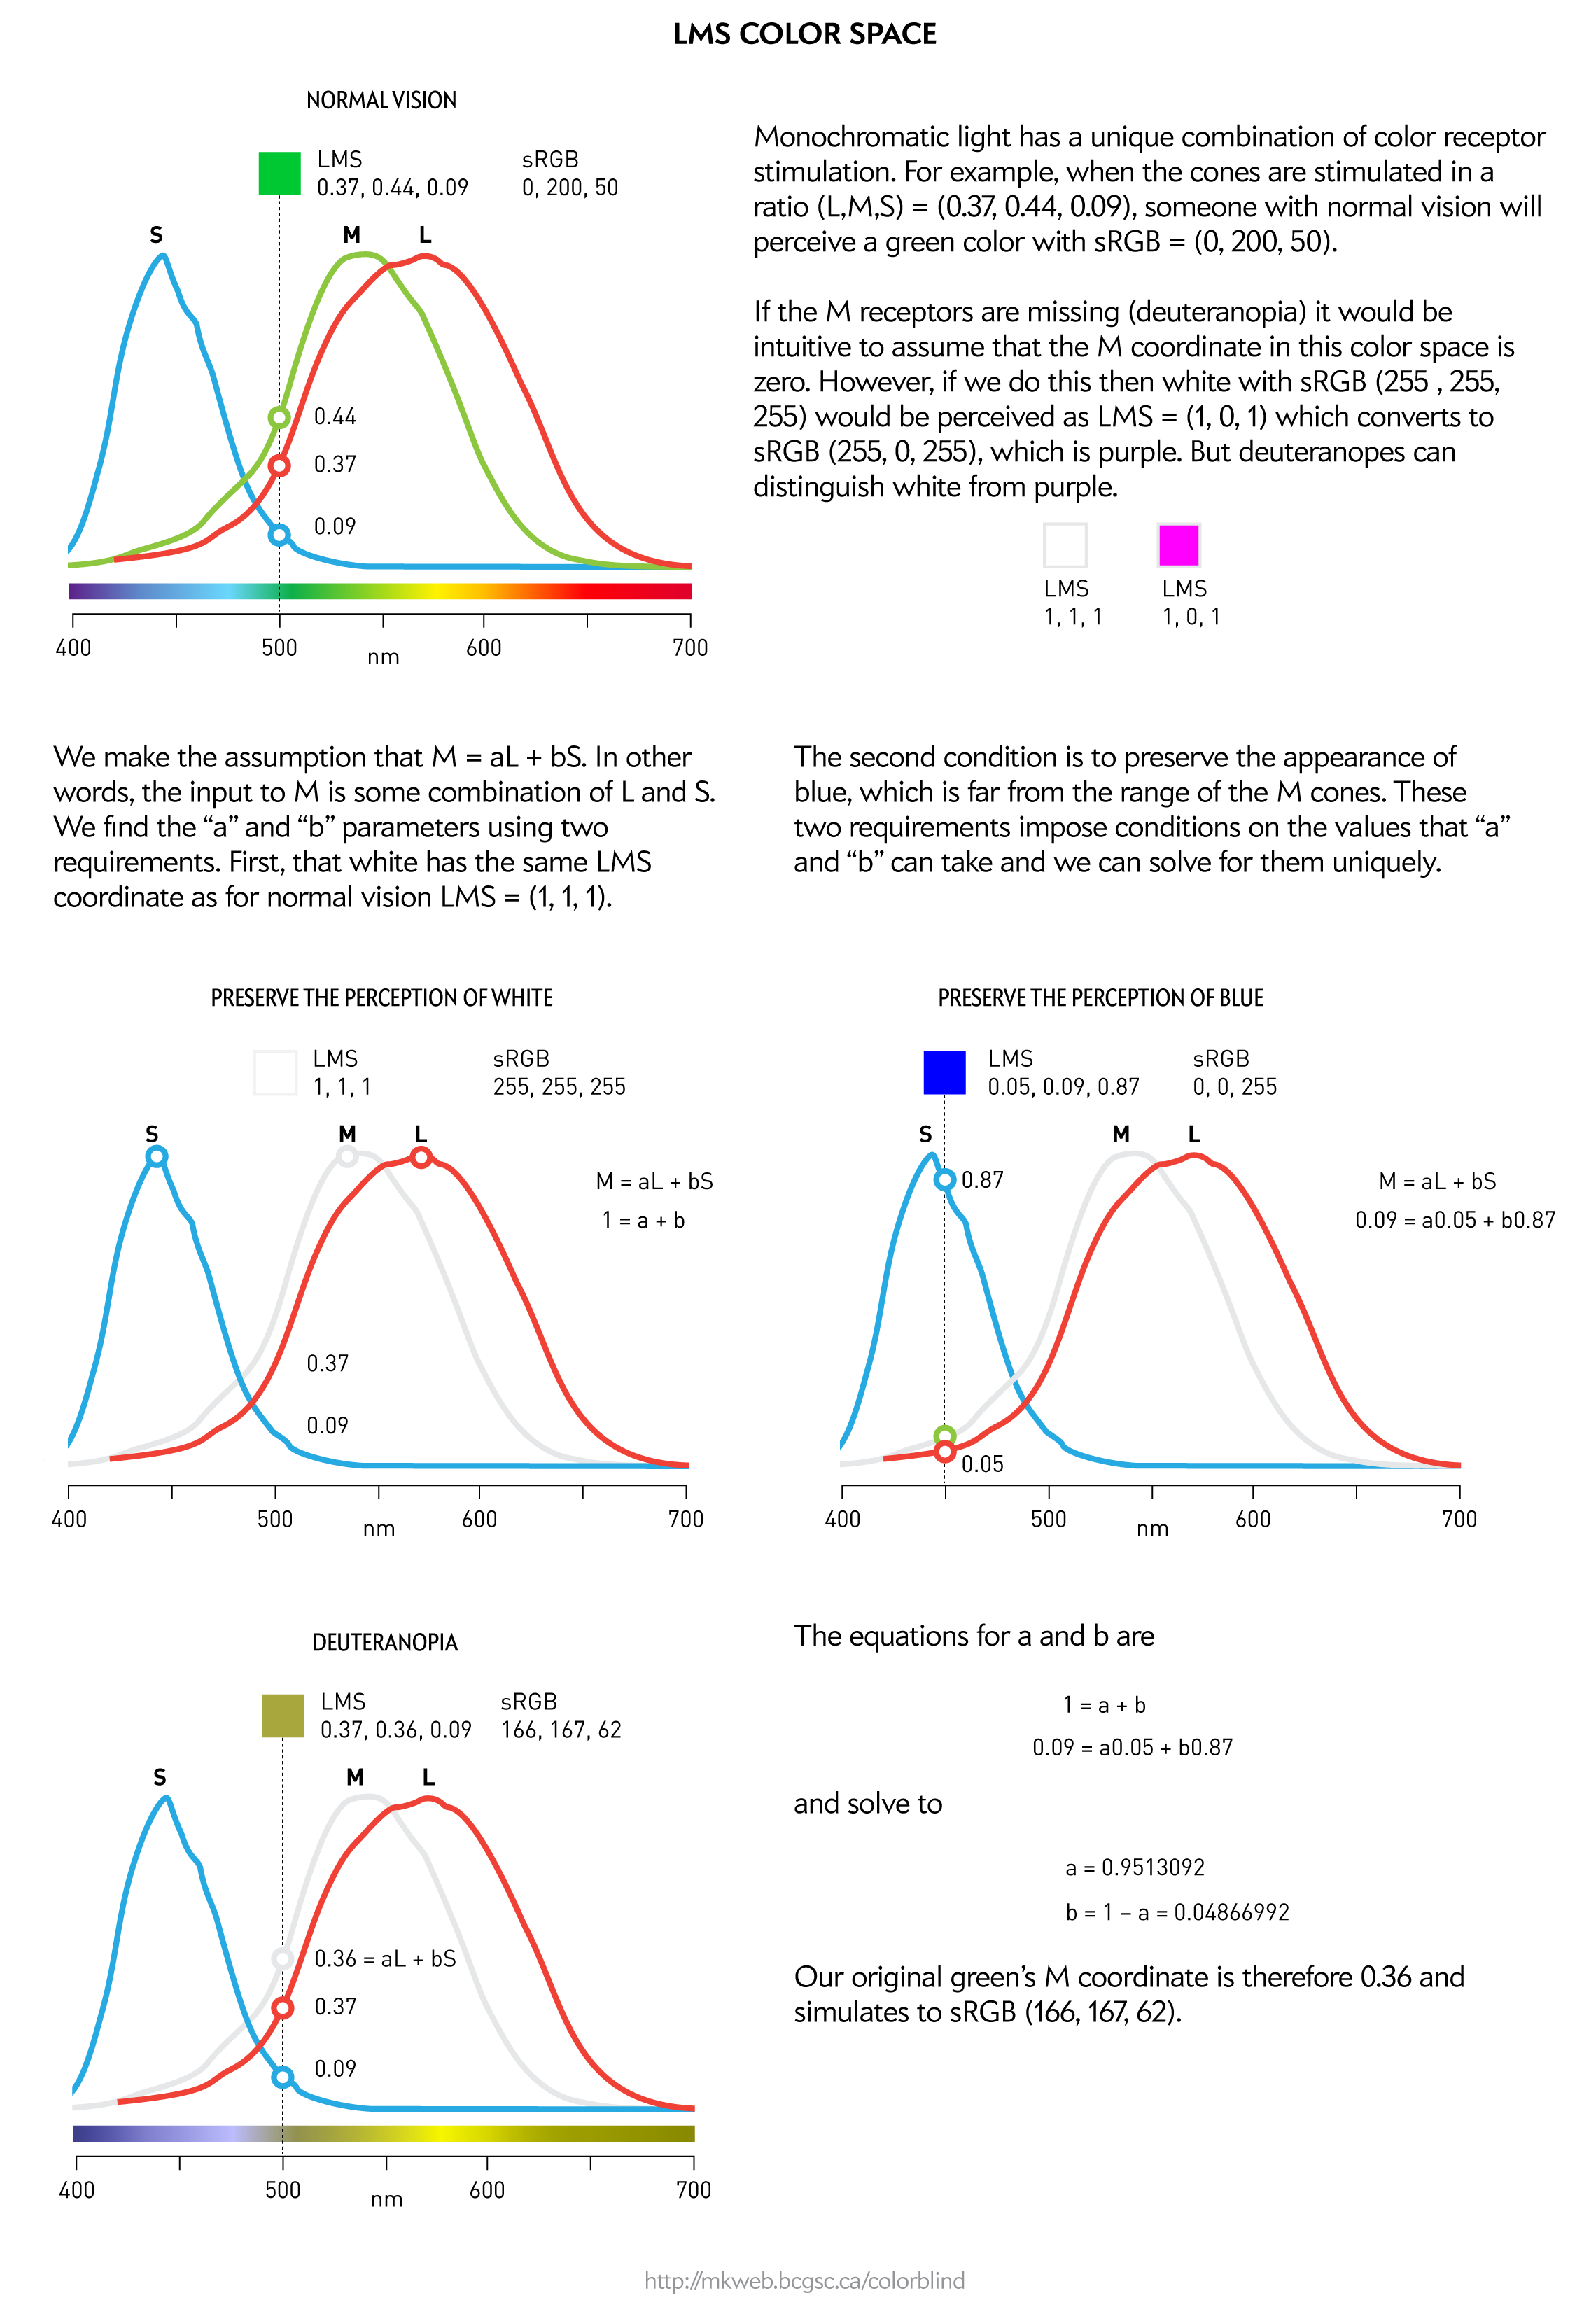
To understand how to simulate color blindness we have to look briefly at how color can be represented. You're probaby familiar with the RGB color space—just one kind of many color spaces. The RGB coordinates of a color are a device-dependent output model—they tell a device, such as your monitor or TV how much of a pixel's red, green and blue to activate. Obviously, depending on which specific display panel we're talking about, the output color might actually look very different—it's a function of the actual phosphors and any calibration and adjustments.
It turns out that we can also specify color in terms of coordinates in a space based on the physiological response of the eye to the color. Since a normal eye has three photoreceptors whose sensitivity is centered on short (S), medium (M) and long (L) wavelengths, any given color (i.e. monochromatic light) creates a unique combination of S, M and L cone response.
Using a color's LMS coordinates we can simulate color blindness by modifying the coordinate that corresponds to the missing photoreceptor under the observations that (a) deuteranopes, for example, can distinguish white and greys from blues and greens and (b) colors for which the sensitivity of the missing photoreceptors is low should be perceived normally.
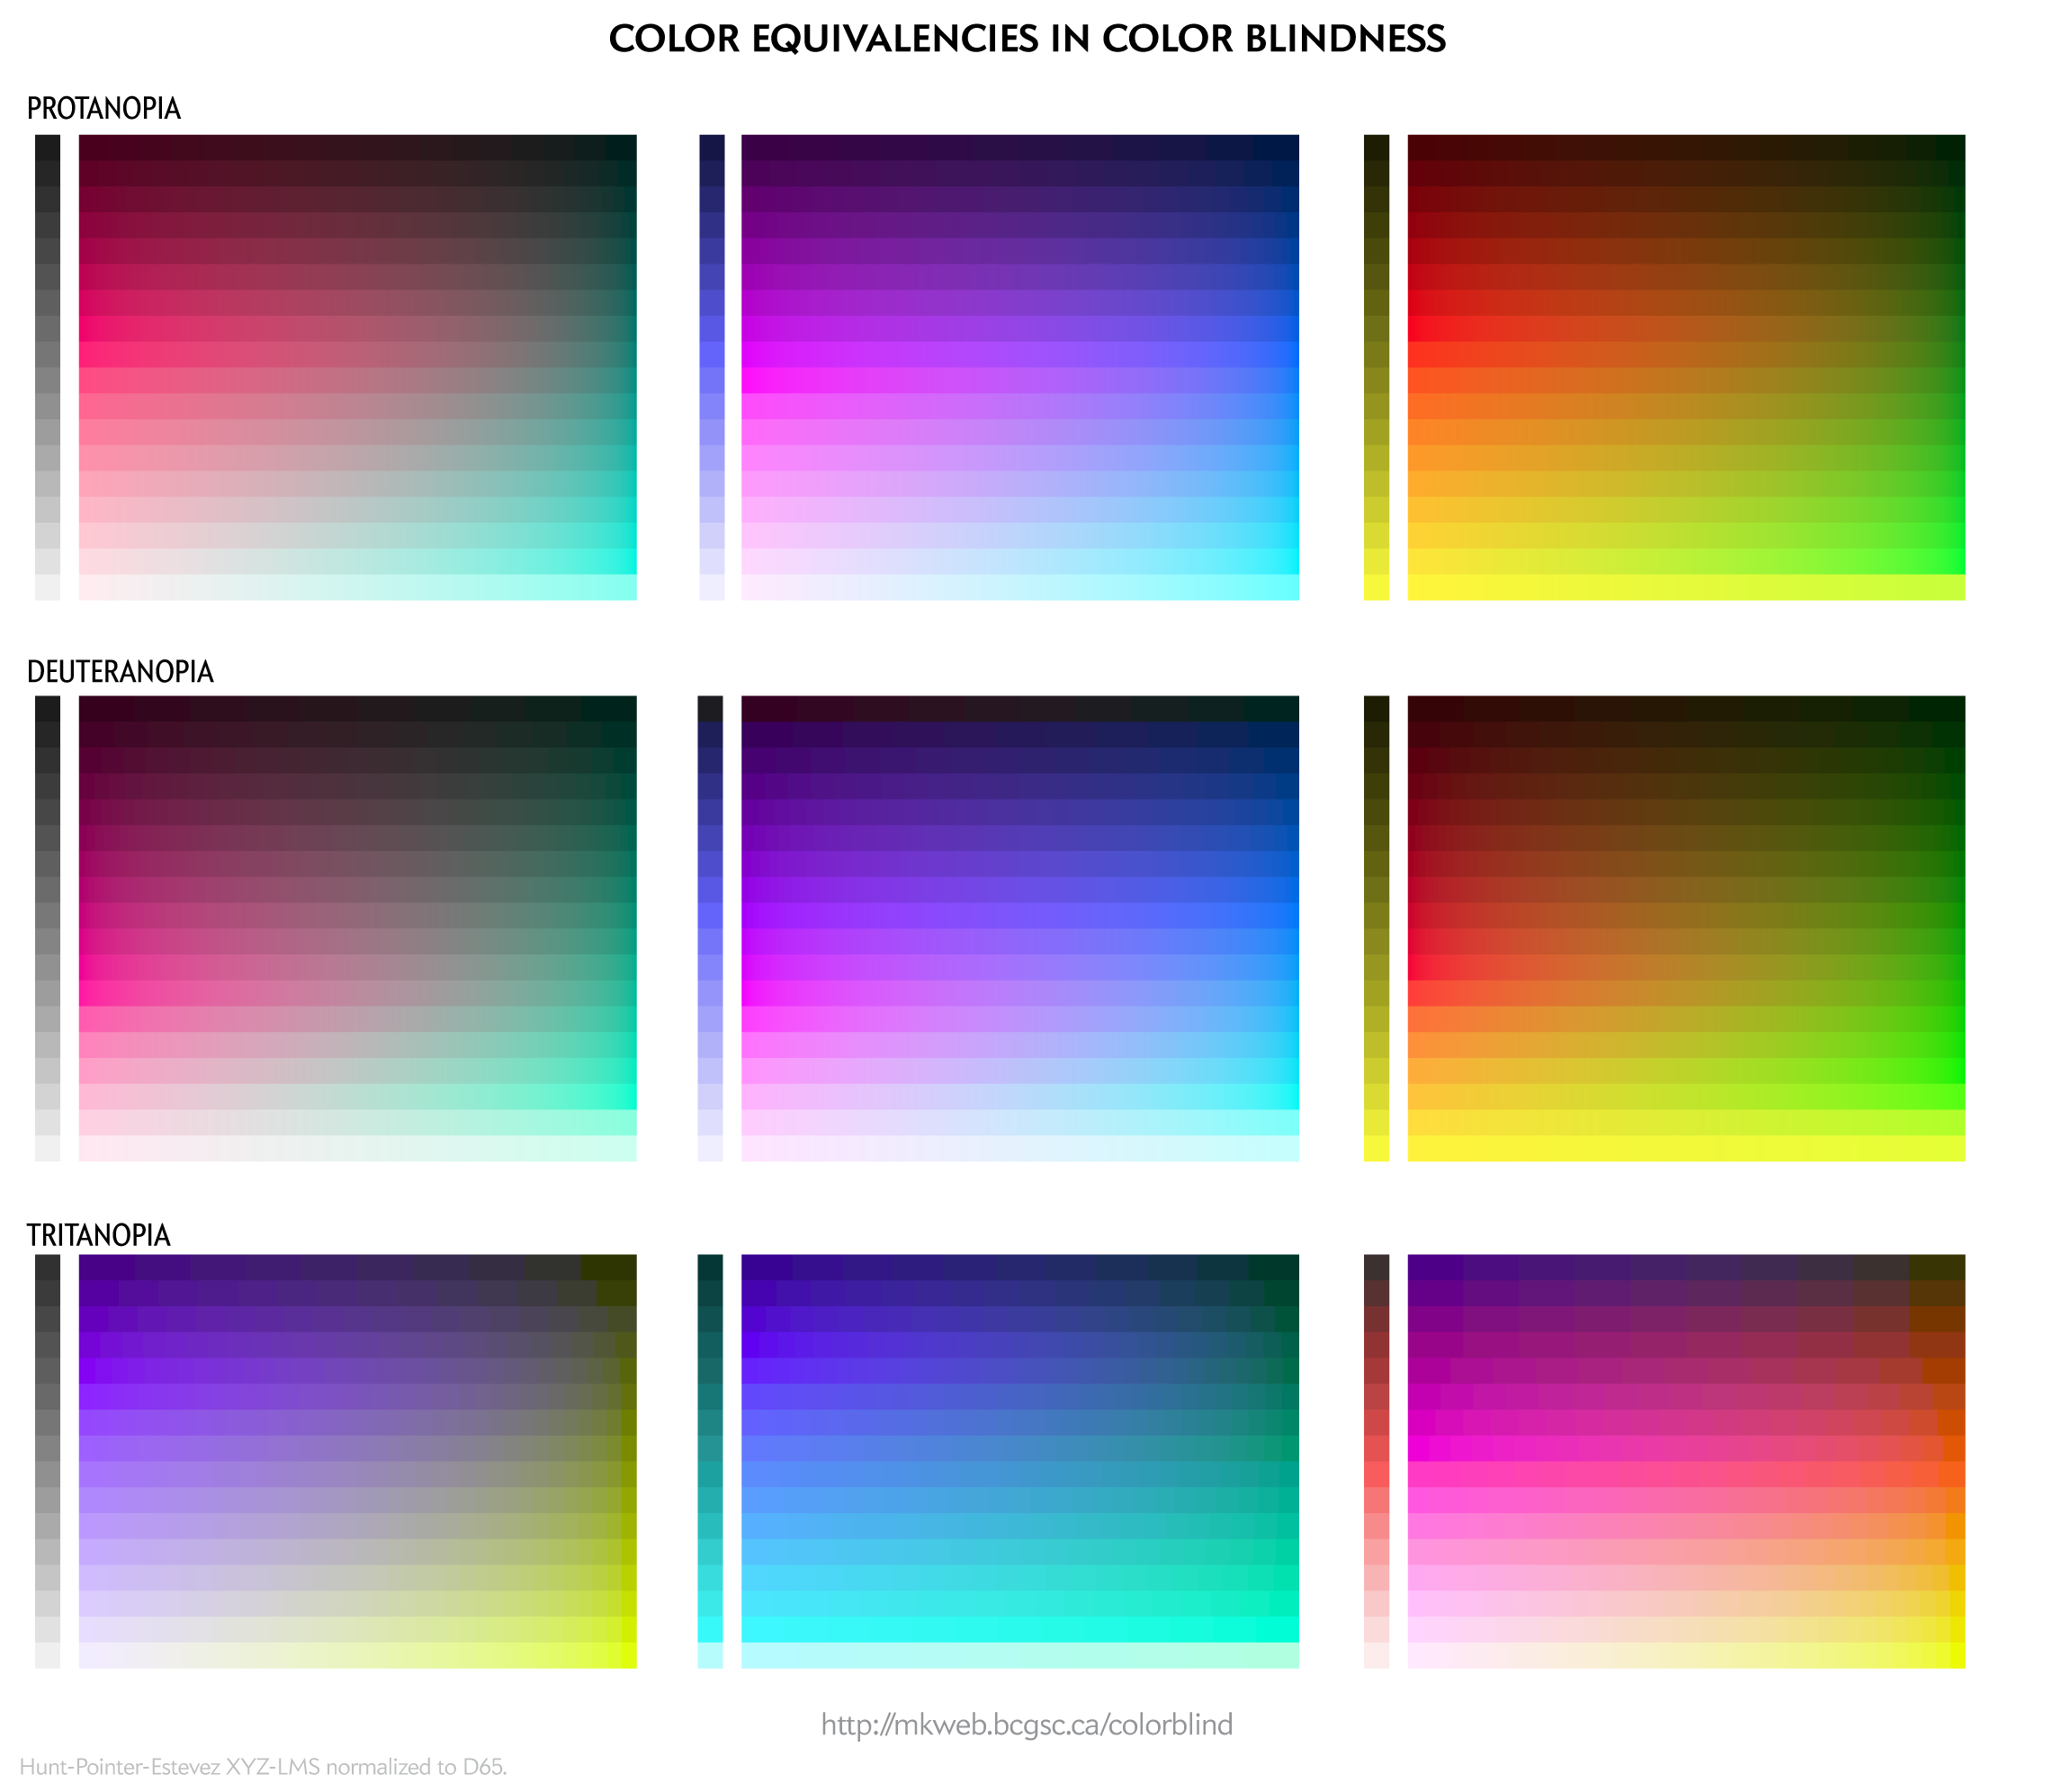
Because color blindess reduces the number of color dimensions, a large number of colors distinguishable to people with normal vision appear the same to someone with color blidness. The ramps below show these families of equivalent colors.
super color vision
The opposite condition to color blindness exists too—tetrachromacy. In this case, an individual has an extra type of color receptor which improves discrimination in the red part of the spectrum. While the anatomy of their retina can be described, how true tetrachromats subjectively perceive color is unknown. And, perhaps, even unknowable.
Tetrachromacy is common in other animals, such as fish (e.g. goldfish, zebrafish) and birds (e.g. finch, starling). The dimensionality of the perceived color space isn't necessarily proportional to the number of different receptors. If the signal from 3 color receptors are combined by the brain and each processor has a weighted response to a broad range of wavelengths, then a color can be modeled by a point in 3-dimensional space, in which the receptors are the axes. This system can perceive a large number of colors.
In the extreme case where the receptors respond to a very narrow range, of which none overlap with the other, a color is one of three points in a 1-dimensional space. This sytem can perceive only 3 colors.
For example, although the mantis shrimp has 12 different color receptors, the receptors work independently, their color discrimination is poorer than ours.
Nasa to send our human genome discs to the Moon
We'd like to say a ‘cosmic hello’: mathematics, culture, palaeontology, art and science, and ... human genomes.


Comparing classifier performance with baselines
All animals are equal, but some animals are more equal than others. —George Orwell
This month, we will illustrate the importance of establishing a baseline performance level.
Baselines are typically generated independently for each dataset using very simple models. Their role is to set the minimum level of acceptable performance and help with comparing relative improvements in performance of other models.

Unfortunately, baselines are often overlooked and, in the presence of a class imbalance5, must be established with care.
Megahed, F.M, Chen, Y-J., Jones-Farmer, A., Rigdon, S.E., Krzywinski, M. & Altman, N. (2024) Points of significance: Comparing classifier performance with baselines. Nat. Methods 20.
Happy 2024 π Day—
sunflowers ho!
Celebrate π Day (March 14th) and dig into the digit garden. Let's grow something.

How Analyzing Cosmic Nothing Might Explain Everything
Huge empty areas of the universe called voids could help solve the greatest mysteries in the cosmos.
My graphic accompanying How Analyzing Cosmic Nothing Might Explain Everything in the January 2024 issue of Scientific American depicts the entire Universe in a two-page spread — full of nothing.

The graphic uses the latest data from SDSS 12 and is an update to my Superclusters and Voids poster.
Michael Lemonick (editor) explains on the graphic:
“Regions of relatively empty space called cosmic voids are everywhere in the universe, and scientists believe studying their size, shape and spread across the cosmos could help them understand dark matter, dark energy and other big mysteries.
To use voids in this way, astronomers must map these regions in detail—a project that is just beginning.
Shown here are voids discovered by the Sloan Digital Sky Survey (SDSS), along with a selection of 16 previously named voids. Scientists expect voids to be evenly distributed throughout space—the lack of voids in some regions on the globe simply reflects SDSS’s sky coverage.”
voids
Sofia Contarini, Alice Pisani, Nico Hamaus, Federico Marulli Lauro Moscardini & Marco Baldi (2023) Cosmological Constraints from the BOSS DR12 Void Size Function Astrophysical Journal 953:46.
Nico Hamaus, Alice Pisani, Jin-Ah Choi, Guilhem Lavaux, Benjamin D. Wandelt & Jochen Weller (2020) Journal of Cosmology and Astroparticle Physics 2020:023.
Sloan Digital Sky Survey Data Release 12
Alan MacRobert (Sky & Telescope), Paulina Rowicka/Martin Krzywinski (revisions & Microscopium)
Hoffleit & Warren Jr. (1991) The Bright Star Catalog, 5th Revised Edition (Preliminary Version).
H0 = 67.4 km/(Mpc·s), Ωm = 0.315, Ωv = 0.685. Planck collaboration Planck 2018 results. VI. Cosmological parameters (2018).
constellation figures
stars
cosmology
Error in predictor variables
It is the mark of an educated mind to rest satisfied with the degree of precision that the nature of the subject admits and not to seek exactness where only an approximation is possible. —Aristotle
In regression, the predictors are (typically) assumed to have known values that are measured without error.
Practically, however, predictors are often measured with error. This has a profound (but predictable) effect on the estimates of relationships among variables – the so-called “error in variables” problem.

Error in measuring the predictors is often ignored. In this column, we discuss when ignoring this error is harmless and when it can lead to large bias that can leads us to miss important effects.
Altman, N. & Krzywinski, M. (2024) Points of significance: Error in predictor variables. Nat. Methods 20.
Background reading
Altman, N. & Krzywinski, M. (2015) Points of significance: Simple linear regression. Nat. Methods 12:999–1000.
Lever, J., Krzywinski, M. & Altman, N. (2016) Points of significance: Logistic regression. Nat. Methods 13:541–542 (2016).
Das, K., Krzywinski, M. & Altman, N. (2019) Points of significance: Quantile regression. Nat. Methods 16:451–452.